Grunnleggende statistikk
| Institusjonelle eiere | 269 total, 266 long only, 0 short only, 3 long/short - change of 5,08% MRQ |
| Gjennomsnittlig porteføljeallokering | 0.3223 % - change of −6,14% MRQ |
| Institusjonelle aksjer (Long) | 52 151 765 (ex 13D/G) - change of 1,12MM shares 2,19% MRQ |
| Institusjonell verdi (Long) | $ 1 203 095 USD ($1000) |
Institusjonelt eierskap og aksjonærer
Sixth Street Specialty Lending, Inc. (US:TSLX) har 269 institusjonelle eiere og aksjonærer som har sendt inn 13D/G- eller 13F-skjemaer til Securities Exchange Commission (SEC). Disse institusjonene eier til sammen 52,151,765 aksjer. De største aksjonærene inkluderer Strs Ohio, Sixth Street Partners Management Company, L.P., Progeny 3, Inc., Sound Income Strategies, LLC, Burgundy Asset Management Ltd., Van Eck Associates Corp, BIZD - VanEck Vectors BDC Income ETF, Morgan Stanley, Allen Investment Management LLC, and Ares Management Llc .
Sixth Street Specialty Lending, Inc. (NYSE:TSLX) institusjonell eierstruktur viser nåværende posisjoner i selskapet fordelt på institusjoner og fond, samt de siste endringene i posisjonsstørrelse. De største aksjonærene kan være individuelle investorer, verdipapirfond, hedgefond eller institusjoner. Schedule 13D indikerer at investoren eier (eller har eid) mer enn 5 % av selskapet og har til hensikt (eller hadde til hensikt) å aktivt forfølge en endring i forretningsstrategien. Schedule 13G indikerer en passiv investering på over 5 %.
The share price as of September 9, 2025 is 24,49 / share. Previously, on September 10, 2024, the share price was 21,06 / share. This represents an increase of 16,29% over that period.

Fondssentiment-score
Fondssentiment Score (også kjent som akkumulering av eierskap poengsum) viser hvilke aksjer som er mest kjøpt av fond. Den er resultatet av en sofistikert, kvantitativ flerfaktormodell som identifiserer selskaper med de høyeste nivåene av institusjonell akkumulering. Beregningsmodellen for poeng bruker en kombinasjon av den totale økningen i antall offentliggjorte eiere, endringer i porteføljeallokeringen til disse eierne og andre beregninger. Tallet går fra 0 til 100, der høyere tall indikerer en høyere grad av akkumulering i forhold til sammenlignbare selskaper, der 50 er gjennomsnittet.
Oppdateringsfrekvens: Daglig
Sjekk ut Ownership Explorer, som inneholder en liste over de høyest rangerte selskapene.
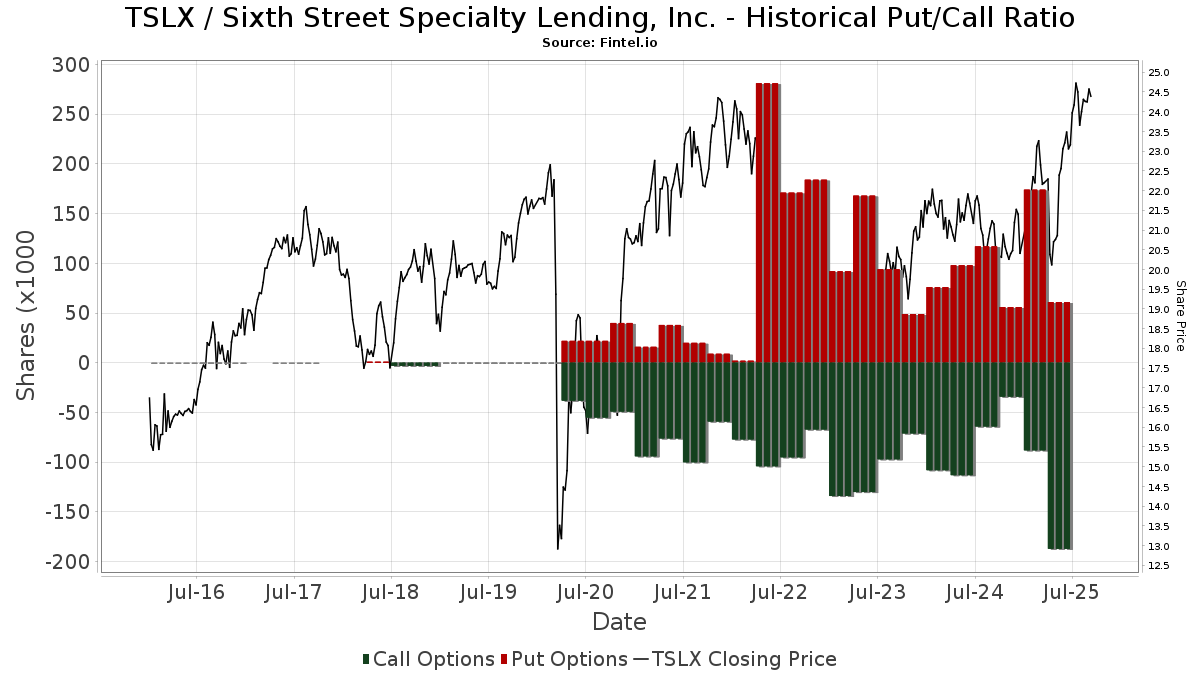
Institusjonell Put/Call-forhold
I tillegg til å rapportere standard aksje- og gjeldsemisjoner må institusjoner med mer enn 100 millioner kroner i forvaltningskapital også oppgi beholdningen av put- og callopsjoner. Siden put-opsjoner generelt indikerer et negativt sentiment, og call-opsjoner indikerer et positivt sentiment, kan vi få et inntrykk av det generelle institusjonelle sentimentet ved å plotte forholdet mellom put- og call-opsjoner. Diagrammet til høyre viser det historiske forholdet mellom put- og call-opsjoner for dette instrumentet.
Ved å bruke Put/Call-forholdet som en indikator på investorsentimentet kan man overvinne en av de viktigste svakhetene ved å bruke totalt institusjonelt eierskap, nemlig at en betydelig andel av forvaltningskapitalen investeres passivt for å følge indekser. Passivt forvaltede fond kjøper vanligvis ikke opsjoner, slik at indikatoren for put/call-forhold i større grad gjenspeiler stemningen i aktivt forvaltede fond.
13F- og NPORT-arkiveringer
Detaljer om 13F-arkiveringer er gratis. Detaljer om NP-arkiveringer krever et premium-medlemskap. Grønne rader indikerer nye posisjoner. Røde rader indikerer lukkede posisjoner. Klikk på lenke ikonet for å se hele transaksjonshistorikken.
Oppgrader
for å låse opp premiedata og eksportere til Excel. ![]() .
.
| Fildato | Kilde | Investor | Type | Gjennomsnittlig pris (estimert) |
Aksjer | Δ Aksjer (%) |
Rapportert verdi ($1000) | Verdi (%) | Portallokering (%) | |
|---|---|---|---|---|---|---|---|---|---|---|
| 2025-08-11 | 13F | EMC Capital Management | 6 120 | −9,29 | 0 | |||||
| 2025-08-01 | 13F | Rossby Financial, LCC | 2 983 | 0,10 | 71 | 14,52 | ||||
| 2025-08-28 | NP | SVOAX - Simt Us Managed Volatility Fund Class F | 38 650 | −38,99 | 920 | −35,07 | ||||
| 2025-05-05 | 13F | Transce3nd, LLC | 0 | −100,00 | 0 | |||||
| 2025-08-04 | 13F | Muzinich & Co., Inc. | 608 616 | 35,21 | 14 491 | 43,85 | ||||
| 2025-08-14 | 13F | Two Sigma Investments, Lp | 512 747 | 17,61 | 12 209 | 25,13 | ||||
| 2025-08-15 | 13F | Northeast Financial Consultants Inc | 26 000 | 0,00 | 619 | 6,54 | ||||
| 2025-08-07 | 13F | ProShare Advisors LLC | 19 159 | −3,69 | 456 | 2,47 | ||||
| 2025-08-14 | 13F | Prelude Capital Management, Llc | 98 843 | 0,00 | 2 353 | 6,37 | ||||
| 2025-08-05 | 13F | Huntington National Bank | 1 001 | 0,00 | 24 | 4,55 | ||||
| 2025-08-13 | 13F | Northern Trust Corp | 84 292 | 52,37 | 2 007 | 62,04 | ||||
| 2025-07-17 | 13F | HB Wealth Management, LLC | 76 206 | −4,27 | 1 814 | 1,85 | ||||
| 2025-08-27 | 13F/A | Squarepoint Ops LLC | 16 052 | 24,86 | 382 | 33,10 | ||||
| 2025-08-08 | 13F | Foundations Investment Advisors, LLC | 42 122 | 1 003 | ||||||
| 2025-08-14 | 13F | UBS Group AG | 1 186 011 | 35,43 | 28 239 | 44,09 | ||||
| 2025-07-16 | 13F | Signaturefd, Llc | 4 659 | −8,70 | 111 | −3,51 | ||||
| 2025-05-01 | 13F | Country Club Bank /gfn | 0 | −100,00 | 0 | |||||
| 2025-05-14 | 13F | Virtus ETF Advisers LLC | 0 | −100,00 | 0 | |||||
| 2025-07-23 | 13F | Hager Investment Management Services, Llc | 55 | 1,85 | 1 | 0,00 | ||||
| 2025-08-06 | 13F | Round Rock Advisors, LLC | 281 184 | 2,44 | 6 695 | 8,99 | ||||
| 2025-08-07 | 13F | Rathbone Brothers plc | 0 | −100,00 | 0 | |||||
| 2025-07-23 | 13F | Ellsworth Advisors, LLC | 29 815 | 710 | ||||||
| 2025-08-15 | 13F | Tower Research Capital LLC (TRC) | 1 770 | −31,37 | 42 | −26,32 | ||||
| 2025-06-18 | NP | Putnam ETF Trust - Putnam BDC ETF - | 479 138 | 21,72 | 9 947 | 12,91 | ||||
| 2025-07-01 | 13F | Confluence Investment Management Llc | 288 066 | 14,58 | 6 859 | 21,90 | ||||
| 2025-07-18 | 13F | Trust Co Of Vermont | 1 584 | −13,63 | 38 | −9,76 | ||||
| 2025-08-13 | 13F | 1832 Asset Management L.P. | 395 347 | 12,96 | 9 413 | 20,17 | ||||
| 2025-08-14 | 13F | Alyeska Investment Group, L.P. | 189 491 | 4 512 | ||||||
| 2025-08-14 | 13F | Mariner, LLC | 38 629 | 13,16 | 920 | 20,45 | ||||
| 2025-08-14 | 13F | FJ Capital Management LLC | 0 | −100,00 | 0 | |||||
| 2025-07-29 | NP | SVYAX - SIIT U.S. Managed Volatility Fund - Class A | 104 200 | 0,00 | 2 427 | −0,94 | ||||
| 2025-08-07 | 13F | Allworth Financial LP | 334 | 1 570,00 | 8 | |||||
| 2025-08-14 | 13F | GWM Advisors LLC | 1 672 | 0,00 | 40 | 5,41 | ||||
| 2025-08-11 | 13F | Annis Gardner Whiting Capital Advisors, LLC | 5 235 | 0,00 | 125 | 5,98 | ||||
| 2025-08-15 | 13F | Morgan Stanley | 1 872 708 | 0,15 | 44 589 | 6,55 | ||||
| 2025-08-14 | 13F | Citadel Advisors Llc | Put | 17 300 | −24,78 | 412 | −20,04 | |||
| 2025-08-14 | 13F | Wetherby Asset Management Inc | 11 514 | 274 | ||||||
| 2025-07-11 | 13F | Farther Finance Advisors, LLC | 667 | 0,00 | 16 | 7,14 | ||||
| 2025-08-14 | 13F | Qube Research & Technologies Ltd | 50 774 | −76,82 | 1 209 | −75,36 | ||||
| 2025-08-14 | 13F | Citadel Advisors Llc | Call | 46 900 | 838,00 | 1 117 | 905,41 | |||
| 2025-07-10 | 13F | Security National Bank | 3 361 | 5,96 | 80 | 14,29 | ||||
| 2025-07-22 | 13F | Romano Brothers And Company | 25 200 | 46,51 | 601 | 56,51 | ||||
| 2025-08-11 | 13F | Greykasell Wealth Strategies, Inc. | 497 | −39,76 | 12 | −38,89 | ||||
| 2025-07-28 | NP | FXED - Sound Enhanced Fixed Income ETF | 52 635 | 1,12 | 1 226 | 0,16 | ||||
| 2025-07-29 | 13F | Private Trust Co Na | 600 | 0,00 | 14 | 7,69 | ||||
| 2025-08-14 | 13F | Citadel Advisors Llc | 74 279 | 176,23 | 1 769 | 194,18 | ||||
| 2025-08-12 | 13F | Virtu Financial LLC | 0 | −100,00 | 0 | |||||
| 2025-07-16 | 13F | Register Financial Advisors LLC | 7 665 | 0,24 | 183 | 6,43 | ||||
| 2025-08-08 | 13F | Pnc Financial Services Group, Inc. | 7 341 | 0,00 | 175 | 6,10 | ||||
| 2025-08-25 | 13F/A | Neuberger Berman Group LLC | 595 029 | −1,60 | 14 168 | 4,68 | ||||
| 2025-07-28 | 13F | Melia Wealth LLC | 614 916 | 3,56 | 14 641 | 10,18 | ||||
| 2025-08-13 | 13F | Lansforsakringar Fondforvaltning AB (publ) | 0 | −100,00 | 0 | |||||
| 2025-08-01 | 13F | Pasadena Private Wealth, LLC | 10 090 | −9,66 | 240 | −3,61 | ||||
| 2025-05-14 | 13F | Campbell & CO Investment Adviser LLC | 0 | −100,00 | 0 | |||||
| 2025-07-24 | 13F | Standard Life Aberdeen plc | 123 237 | −5,70 | 2 936 | 0,75 | ||||
| 2025-07-25 | 13F | Atria Wealth Solutions, Inc. | 8 570 | 204 | ||||||
| 2025-08-13 | 13F | Marshall Wace, Llp | 75 811 | 186,63 | 1 805 | 205,41 | ||||
| 2025-08-14 | 13F | Balyasny Asset Management Llc | 17 540 | 418 | ||||||
| 2025-08-11 | 13F | Lsv Asset Management | 1 055 562 | −10,33 | 25 | −3,85 | ||||
| 2025-08-12 | 13F | Franklin Resources Inc | 485 418 | 9,97 | 11 558 | 17,00 | ||||
| 2025-08-14 | 13F | Benjamin Edwards Inc | 211 976 | 3,40 | 5 047 | 10,00 | ||||
| 2025-08-20 | NP | LSPAX - LoCorr Spectrum Income Fund Class A | 29 829 | −48,40 | 710 | −45,09 | ||||
| 2025-08-14 | 13F | London & Capital Asset Management Ltd | 19 400 | 0,00 | 462 | 6,22 | ||||
| 2025-07-15 | 13F | Family Wealth Partners, Llc | 16 297 | 81,54 | 388 | 94,00 | ||||
| 2025-07-21 | 13F | Future Financial Wealth Managment LLC | 4 200 | 0,00 | 100 | 7,53 | ||||
| 2025-08-13 | 13F | Invesco Ltd. | 30 628 | 7,98 | 729 | 14,98 | ||||
| 2025-04-22 | 13F | Synergy Financial Management, LLC | 0 | −100,00 | 0 | |||||
| 2025-07-14 | 13F | GAMMA Investing LLC | 37 | 0,00 | 1 | |||||
| 2025-08-14 | 13F | DRW Securities, LLC | 25 122 | 598 | ||||||
| 2025-08-14 | 13F | Toroso Investments, LLC | 53 219 | 2,24 | 1 267 | 8,85 | ||||
| 2025-08-13 | 13F | Legacy Capital Wealth Partners, LLC | 61 987 | −3,10 | 1 476 | 3,07 | ||||
| 2025-08-13 | 13F | Texas Capital Bank Wealth Management Services Inc | 148 017 | 5,87 | 3 524 | 12,66 | ||||
| 2025-08-14 | 13F | Mercer Global Advisors Inc /adv | 8 733 | 208 | ||||||
| 2025-07-29 | 13F | Stableford Capital Ii Llc | 8 500 | 208 | ||||||
| 2025-08-04 | 13F | IFG Advisory, LLC | 20 608 | 14,31 | 491 | 21,59 | ||||
| 2025-08-13 | 13F | Advisory Research Inc | 10 564 | −1,55 | 252 | 4,58 | ||||
| 2025-08-13 | 13F | Wambolt & Associates, LLC | 146 586 | −8,68 | 3 487 | −3,14 | ||||
| 2025-07-18 | 13F | Generali Investments CEE, investicni spolecnost, a.s. | 24 084 | 4,50 | 573 | 11,26 | ||||
| 2025-07-25 | NP | First Trust Specialty Finance & Financial Opportunities Fund This fund is a listed as child fund of First Trust Advisors Lp and if that institution has disclosed ownership in this security, then these positions will not be double counted when calculating total shares and total value | 222 000 | 12,69 | 5 170 | 11,64 | ||||
| 2025-08-07 | 13F | Acadian Asset Management Llc | 1 297 | −9,55 | 0 | |||||
| 2025-06-30 | NP | PSP - Invesco Global Listed Private Equity ETF This fund is a listed as child fund of Invesco Ltd. and if that institution has disclosed ownership in this security, then these positions will not be double counted when calculating total shares and total value | 26 905 | −22,31 | 559 | −28,00 | ||||
| 2025-07-25 | 13F | Community Bank, N.A. | 1 000 | 0,00 | 24 | 4,55 | ||||
| 2025-08-14 | 13F | Wells Fargo & Company/mn | 1 241 039 | 3,07 | 29 549 | 9,66 | ||||
| 2025-08-26 | NP | NORTHERN FUNDS - NORTHERN SMALL CAP CORE FUND Class K | 10 068 | −5,54 | 240 | 0,42 | ||||
| 2025-08-11 | 13F | Universal- Beteiligungs- und Servicegesellschaft mbH | 150 543 | 0,00 | 3 584 | 6,41 | ||||
| 2025-07-15 | 13F | SJS Investment Consulting Inc. | 43 | 1 | ||||||
| 2025-08-13 | 13F | Brown Advisory Inc | 38 999 | −14,98 | 929 | −9,55 | ||||
| 2025-07-16 | 13F | Essex Financial Services, Inc. | 41 047 | 4,57 | 977 | 11,28 | ||||
| 2025-07-29 | NP | PPADX - GMO U.S. Opportunistic Value Fund Class III | 21 838 | 509 | ||||||
| 2025-07-08 | 13F | Parallel Advisors, LLC | 18 012 | −13,02 | 429 | −7,56 | ||||
| 2025-08-01 | 13F | Envestnet Asset Management Inc | 538 400 | 8,83 | 12 819 | 15,79 | ||||
| 2025-07-25 | 13F | Concurrent Investment Advisors, LLC | 11 138 | 265 | ||||||
| 2025-07-21 | 13F | Mirae Asset Global Investments Co., Ltd. | 15 050 | 66,87 | 358 | 78,11 | ||||
| 2025-08-08 | 13F | Tortoise Investment Management, LLC | Call | 500 | 0 | |||||
| 2025-07-28 | 13F | Frazier Financial Advisors, LLC | 4 814 | 0,00 | 115 | 6,54 | ||||
| 2025-08-14 | 13F | Stifel Financial Corp | 663 112 | −4,02 | 15 789 | 2,11 | ||||
| 2025-05-30 | NP | ERNZ - TrueShares Active Yield ETF | 13 535 | −93,77 | 303 | −93,47 | ||||
| 2025-08-13 | 13F | Delphi Financial Group, Inc. | 20 041 | −55,57 | 477 | −52,73 | ||||
| 2025-08-14 | 13F | Verition Fund Management LLC | 14 825 | 353 | ||||||
| 2025-06-26 | NP | LSVQX - LSV Small Cap Value Fund Institutional Class Shares | 90 000 | 0,00 | 1 868 | −7,25 | ||||
| 2025-08-14 | 13F | Federation des caisses Desjardins du Quebec | 4 000 | 0,00 | 95 | 6,74 | ||||
| 2025-08-14 | 13F | BI Asset Management Fondsmaeglerselskab A/S | 1 919 | 0,00 | 0 | |||||
| 2025-08-12 | 13F | Advisors Asset Management, Inc. | 206 077 | 16,24 | 4 907 | 23,67 | ||||
| 2025-08-14 | 13F | Two Sigma Advisers, Lp | 678 886 | −7,62 | 16 164 | −1,71 | ||||
| 2025-08-05 | 13F | Bank Of Montreal /can/ | 324 196 | 7 719 | ||||||
| 2025-08-13 | 13F | Russell Investments Group, Ltd. | 94 | −57,27 | 2 | −50,00 | ||||
| 2025-08-14 | 13F | Clayton Partners LLC | 137 140 | −9,62 | 3 265 | −3,83 | ||||
| 2025-07-01 | 13F | Harbor Investment Advisory, Llc | 219 | 2,34 | 5 | 25,00 | ||||
| 2025-05-15 | 13F | Centiva Capital, LP | 0 | −100,00 | 0 | −100,00 | ||||
| 2025-06-25 | NP | VPC - Virtus Private Credit Strategy ETF | 36 498 | −16,64 | 758 | −22,68 | ||||
| 2025-08-14 | 13F | Raymond James Financial Inc | 828 529 | −0,33 | 19 727 | 6,04 | ||||
| 2025-08-14 | 13F | Barnett & Company, Inc. | 36 750 | 22,30 | 875 | 30,21 | ||||
| 2025-08-11 | 13F | Private Advisor Group, LLC | 21 868 | 1,38 | 521 | 7,88 | ||||
| 2025-08-18 | 13F | Wolverine Trading, Llc | Put | 0 | −100,00 | 0 | ||||
| 2025-07-17 | 13F | LexAurum Advisors, LLC | 8 454 | 201 | ||||||
| 2025-08-05 | 13F | Simplex Trading, Llc | 0 | −100,00 | 0 | |||||
| 2025-07-16 | 13F | Eagle Global Advisors Llc | 14 150 | 0,00 | 337 | 6,33 | ||||
| 2025-07-11 | 13F | Mallini Complete Financial Planning LLC | 15 226 | 16,87 | 362 | 24,40 | ||||
| 2025-08-04 | 13F | Savvy Advisors, Inc. | 35 138 | 15,92 | 837 | 23,30 | ||||
| 2025-07-28 | 13F | Harbour Investments, Inc. | 178 | 0,00 | 4 | 33,33 | ||||
| 2025-07-16 | 13F | Magnus Financial Group LLC | 12 526 | −13,05 | 298 | −7,45 | ||||
| 2025-07-18 | 13F | Union Bancaire Privee, UBP SA | 19 319 | 5,09 | 65 559 | 15 851,09 | ||||
| 2025-08-14 | 13F | Susquehanna International Group, Llp | 14 726 | −60,82 | 351 | −58,38 | ||||
| 2025-08-12 | 13F | Argent Trust Co | 144 734 | 36,10 | 3 446 | 44,85 | ||||
| 2025-08-12 | 13F | CIBC Private Wealth Group, LLC | 2 144 | 0,00 | 51 | 24,39 | ||||
| 2025-08-14 | 13F | AllSquare Wealth Management LLC | 500 | 0,00 | 12 | 0,00 | ||||
| 2025-08-05 | 13F | Simplex Trading, Llc | Put | 100 | 0,00 | 0 | ||||
| 2025-08-14 | 13F | Susquehanna International Group, Llp | Call | 107 300 | 29,75 | 2 555 | 38,05 | |||
| 2025-08-05 | 13F | Simplex Trading, Llc | Call | 9 300 | 3 000,00 | 0 | ||||
| 2025-08-14 | 13F | FIL Ltd | 0 | −100,00 | 0 | |||||
| 2025-08-14 | 13F | Susquehanna International Group, Llp | Put | 44 000 | −64,80 | 1 048 | −62,57 | |||
| 2025-08-14 | 13F | Hrt Financial Lp | 190 316 | 185,61 | 5 | 300,00 | ||||
| 2025-07-30 | 13F | Principle Wealth Partners Llc | 11 701 | −11,02 | 279 | −5,44 | ||||
| 2025-08-11 | 13F | Nomura Asset Management Co Ltd | 6 588 | 157 | ||||||
| 2025-08-11 | 13F | Delta Asset Management Llc/tn | 250 | 0,00 | 6 | 0,00 | ||||
| 2025-07-29 | 13F | TrueMark Investments, LLC | 0 | −100,00 | 0 | |||||
| 2025-04-28 | 13F | Redmont Wealth Advisors Llc | 4 341 | 97 | ||||||
| 2025-08-14 | 13F | Millennium Management Llc | 0 | −100,00 | 0 | |||||
| 2025-08-14 | 13F | Bramshill Investments, LLC | 32 652 | −47,47 | 777 | −44,14 | ||||
| 2025-08-12 | 13F | Steward Partners Investment Advisory, Llc | 19 502 | 1,22 | 464 | 7,66 | ||||
| 2025-05-15 | 13F | Nebula Research & Development LLC | 0 | −100,00 | 0 | |||||
| 2025-08-12 | 13F | Trexquant Investment LP | 168 058 | 11,57 | 4 001 | 18,69 | ||||
| 2025-08-12 | 13F | BlackRock, Inc. | 696 005 | 16,84 | 16 572 | 24,30 | ||||
| 2025-08-07 | 13F | Allen Investment Management LLC | 1 557 126 | 8,52 | 37 075 | 15,45 | ||||
| 2025-08-14 | 13F | Parkwood LLC | 184 819 | 0,00 | 4 | 0,00 | ||||
| 2025-08-14 | 13F | Group One Trading, L.p. | Call | 11 100 | 264 | |||||
| 2025-08-06 | 13F | AE Wealth Management LLC | 9 361 | −13,84 | 223 | −8,64 | ||||
| 2025-06-26 | NP | LSVMX - LSV U.S. MANAGED VOLATILITY FUND Institutional Class Shares | 4 700 | 0,00 | 98 | −7,62 | ||||
| 2025-07-30 | NP | BIGTX - The Texas Fund Class I | 5 220 | 89,82 | 122 | 105,08 | ||||
| 2025-08-12 | 13F | Global Retirement Partners, LLC | 2 825 | −80,22 | 67 | −77,96 | ||||
| 2025-08-06 | 13F | Commonwealth Equity Services, Llc | 142 414 | 12,01 | 3 | 50,00 | ||||
| 2025-04-29 | 13F | Riggs Asset Managment Co. Inc. | 0 | −100,00 | 0 | |||||
| 2025-08-14 | 13F | Van Eck Associates Corp | 2 143 789 | −3,78 | 51 | 4,08 | ||||
| 2025-08-01 | 13F | First National Trust Co | 214 770 | 0,00 | 5 114 | 6,39 | ||||
| 2025-08-13 | 13F | Grantham, Mayo, Van Otterloo & Co. LLC | 67 700 | −7,02 | 1 612 | −1,10 | ||||
| 2025-07-18 | 13F | Bartlett & Co. Wealth Management Llc | 700 | 0,00 | 17 | 6,67 | ||||
| 2025-08-14 | 13F | Bank Of America Corp /de/ | 575 432 | −8,50 | 13 701 | −2,66 | ||||
| 2025-08-14 | 13F | Glenview Trust Co | 9 700 | 231 | ||||||
| 2025-07-24 | 13F | Wealthstar Advisors, Llc | 129 482 | −0,40 | 3 083 | 5,95 | ||||
| 2025-08-13 | 13F | Callodine Capital Management, LP | 1 064 824 | −0,02 | 25 353 | 6,36 | ||||
| 2025-07-29 | NP | GBFFX - GMO Benchmark-Free Fund Class III | 2 970 | 69 | ||||||
| 2025-08-13 | 13F | Lido Advisors, LLC | 52 996 | −23,25 | 1 262 | −18,38 | ||||
| 2025-08-14 | 13F | Diversify Advisory Services, LLC | 32 519 | 787 | ||||||
| 2025-08-15 | 13F | Provenance Wealth Advisors, LLC | 100 | 0,00 | 2 | 0,00 | ||||
| 2025-07-21 | 13F | Ameriflex Group, Inc. | 0 | −100,00 | 0 | |||||
| 2025-07-25 | 13F | We Are One Seven, LLC | 427 840 | 3,05 | 10 187 | 9,63 | ||||
| 2025-08-14 | 13F | Glen Eagle Advisors, LLC | 100 | 0,00 | 2 | 0,00 | ||||
| 2025-08-14 | 13F | Sargent Investment Group, LLC | 28 400 | 0,00 | 682 | 7,24 | ||||
| 2025-08-14 | 13F | Comerica Bank | 9 280 | 12,42 | 221 | 19,57 | ||||
| 2025-08-07 | 13F | Hennion & Walsh Asset Management, Inc. | 63 911 | −38,55 | 1 522 | −34,64 | ||||
| 2025-08-15 | 13F | CI Private Wealth, LLC | 113 162 | 181,73 | 2 694 | 200,00 | ||||
| 2025-09-04 | 13F/A | Advisor Group Holdings, Inc. | 40 339 | −4,92 | 961 | 1,16 | ||||
| 2025-07-17 | 13F | Sound Income Strategies, LLC | 2 406 296 | 1,91 | 57 294 | 8,42 | ||||
| 2025-07-14 | 13F | AdvisorNet Financial, Inc | 2 000 | 11,11 | 48 | 17,50 | ||||
| 2025-07-25 | 13F | Cwm, Llc | 64 376 | 7 857,48 | 2 | |||||
| 2025-07-07 | 13F | First Community Trust Na | 1 040 | 0,00 | 25 | 4,35 | ||||
| 2025-07-22 | 13F | Valley National Advisers Inc | 500 | 0 | ||||||
| 2025-07-24 | 13F | IFP Advisors, Inc | 70 817 | −42,45 | 1 686 | −38,76 | ||||
| 2025-08-11 | 13F | HighTower Advisors, LLC | 47 667 | 9,70 | 1 135 | 16,67 | ||||
| 2025-07-30 | 13F | Cullen/frost Bankers, Inc. | 0 | −100,00 | 0 | |||||
| 2025-05-15 | 13F | Quarry LP | 0 | −100,00 | 0 | |||||
| 2025-07-31 | 13F | Sumitomo Mitsui Trust Holdings, Inc. | 527 107 | 21,01 | 12 550 | 28,74 | ||||
| 2025-07-10 | 13F | Worth Asset Management, LLC | 14 322 | 0,10 | 341 | 6,56 | ||||
| 2025-08-14 | 13F | Principal Street Partners, LLC | 14 570 | −4,65 | 347 | 1,47 | ||||
| 2025-08-14 | 13F | Bnp Paribas Arbitrage, Sa | 93 065 | 16,48 | 2 216 | 23,88 | ||||
| 2025-07-28 | NP | PEX - ProShares Global Listed Private Equity ETF | 20 431 | 1,50 | 476 | 0,42 | ||||
| 2025-08-05 | 13F | Bank of New York Mellon Corp | 12 595 | 5,85 | 300 | 12,41 | ||||
| 2025-08-15 | 13F | Kestra Advisory Services, LLC | 39 024 | −17,62 | 929 | −12,36 | ||||
| 2025-08-12 | 13F | Heritage Trust Co | 15 580 | 371 | ||||||
| 2025-08-12 | 13F | Waterloo Capital, L.P. | 103 773 | 7,64 | 2 471 | 14,51 | ||||
| 2025-07-29 | NP | SLPAX - Siit Small Cap Fund - Class A | 12 300 | 0,00 | 286 | −1,04 | ||||
| 2025-08-06 | 13F | Ethos Financial Group, LLC | 29 811 | −26,19 | 710 | −21,48 | ||||
| 2025-07-28 | 13F | Naviter Wealth, LLC | 137 708 | 19,01 | 3 279 | 24,31 | ||||
| 2025-08-11 | 13F | Platform Technology Partners | 27 945 | −4,90 | 665 | 1,22 | ||||
| 2025-08-14 | 13F | Evergreen Capital Management Llc | 16 513 | −4,37 | 393 | 1,81 | ||||
| 2025-08-08 | 13F | MTM Investment Management, LLC | 2 040 | 49 | ||||||
| 2025-07-17 | 13F | Beacon Capital Management, LLC | 1 204 | 2,29 | 29 | 7,69 | ||||
| 2025-08-18 | 13F | Geneos Wealth Management Inc. | 1 746 | 0,00 | 42 | 5,13 | ||||
| 2025-08-11 | 13F | Brown Brothers Harriman & Co | 100 | 2 | ||||||
| 2025-08-05 | 13F | Westside Investment Management, Inc. | 286 | 7 | ||||||
| 2025-08-12 | 13F | Legal & General Group Plc | 622 774 | 0,14 | 14 822 | 6,57 | ||||
| 2025-07-09 | 13F | Inspirion Wealth Advisors, Llc | 15 426 | 0,00 | 367 | 6,38 | ||||
| 2025-07-11 | 13F | SILVER OAK SECURITIES, Inc | 19 955 | 145,57 | 475 | 162,43 | ||||
| 2025-08-15 | 13F | WealthCollab, LLC | 225 | −43,47 | 5 | −37,50 | ||||
| 2025-08-11 | 13F | Nations Financial Group Inc, /ia/ /adv | 35 508 | −2,42 | 845 | 3,81 | ||||
| 2025-08-14 | 13F | Fmr Llc | 34 | 0,00 | 1 | |||||
| 2025-08-12 | 13F | Cornerstone Wealth Management, LLC | 46 666 | −0,14 | 1 111 | 6,32 | ||||
| 2025-08-13 | 13F | Burgundy Asset Management Ltd. | 2 378 968 | 1,36 | 56 643 | 7,84 | ||||
| 2025-08-08 | 13F | Larson Financial Group LLC | 161 | 1,90 | 4 | 0,00 | ||||
| 2025-08-13 | 13F | Northwestern Mutual Wealth Management Co | 83 | −82,23 | 2 | −90,00 | ||||
| 2025-08-14 | 13F | Jane Street Group, Llc | 52 974 | 1 261 | ||||||
| 2025-08-08 | 13F | Creative Planning | 38 717 | −3,54 | 922 | 2,56 | ||||
| 2025-08-14 | 13F | Jane Street Group, Llc | Call | 12 200 | 290 | |||||
| 2025-05-05 | 13F | Lindbrook Capital, Llc | 260 | 61,49 | 6 | 66,67 | ||||
| 2025-08-14 | 13F | Dearborn Partners Llc | 63 576 | 0,27 | 1 514 | 6,62 | ||||
| 2025-08-13 | 13F | ExodusPoint Capital Management, LP | 0 | −100,00 | 0 | |||||
| 2025-08-13 | 13F | Whalerock Point Partners, Llc | 13 200 | 24,24 | 314 | 32,49 | ||||
| 2025-07-09 | 13F | Pallas Capital Advisors LLC | 48 778 | −9,64 | 1 161 | −3,89 | ||||
| 2025-07-30 | 13F | Denali Advisors Llc | 198 685 | −2,34 | 4 731 | 3,91 | ||||
| 2025-08-08 | 13F | Cetera Investment Advisers | 494 410 | 10,14 | 11 772 | 17,17 | ||||
| 2025-08-13 | 13F | SCS Capital Management LLC | 622 522 | 2,86 | 14 822 | 9,43 | ||||
| 2025-08-21 | NP | BIZD - VanEck Vectors BDC Income ETF | 1 873 346 | −9,19 | 44 604 | −3,39 | ||||
| 2025-06-27 | NP | LBO - WHITEWOLF Publicly Listed Private Equity ETF | 6 624 | 14,29 | 138 | 6,20 | ||||
| 2025-08-04 | 13F | Strs Ohio | 3 176 606 | −10,80 | 75 635 | −5,10 | ||||
| 2025-08-08 | 13F | Marble Harbor Investment Counsel, LLC | 10 210 | −10,00 | 243 | −3,95 | ||||
| 2025-07-21 | 13F | Vaughan Nelson Investment Management, L.p. | 5 350 | 0,00 | 127 | |||||
| 2025-08-08 | 13F | Advisors Capital Management, LLC | 718 338 | 1,95 | 17 104 | 8,46 | ||||
| 2025-08-29 | NP | John Hancock Financial Opportunities Fund | 228 214 | 0,00 | 5 434 | 6,38 | ||||
| 2025-07-09 | 13F | Westmount Partners, LLC | 13 030 | 0,00 | 310 | 6,53 | ||||
| 2025-08-06 | 13F | Baillie Gifford & Co | 0 | −100,00 | 0 | −100,00 | ||||
| 2025-07-23 | 13F | PARK CIRCLE Co | 62 000 | 0,00 | 1 476 | 6,42 | ||||
| 2025-08-12 | 13F | MAI Capital Management | 4 264 | 83,48 | 102 | 94,23 | ||||
| 2025-08-13 | 13F | Virtus Investment Advisers, Inc. | 29 302 | −26,67 | 698 | −22,04 | ||||
| 2025-07-29 | 13F | Chicago Partners Investment Group LLC | 22 864 | 1,33 | 560 | 19,15 | ||||
| 2025-08-08 | 13F | Alberta Investment Management Corp | 0 | −100,00 | 0 | |||||
| 2025-08-14 | 13F | Royal Bank Of Canada | 141 477 | 13,87 | 3 369 | 21,19 | ||||
| 2025-08-12 | 13F | LPL Financial LLC | 609 227 | 0,94 | 14 506 | 7,39 | ||||
| 2025-08-13 | 13F | Jones Financial Companies Lllp | 604 | 0,00 | 14 | 7,69 | ||||
| 2025-05-16 | 13F | Coppell Advisory Solutions LLC | 0 | −100,00 | 0 | |||||
| 2025-07-16 | 13F | Dakota Wealth Management | 39 220 | 8,27 | 934 | 15,19 | ||||
| 2025-08-12 | 13F | Proequities, Inc. | Call | 0 | 0 | |||||
| 2025-08-13 | 13F | EverSource Wealth Advisors, LLC | 1 061 | 0,00 | 25 | 8,70 | ||||
| 2025-08-12 | 13F | Proequities, Inc. | 0 | 0 | ||||||
| 2025-07-30 | 13F | D.a. Davidson & Co. | 179 702 | 3,56 | 4 279 | 10,17 | ||||
| 2025-05-15 | 13F | Brevan Howard Capital Management LP | 0 | −100,00 | 0 | |||||
| 2025-08-13 | 13F | Beacon Pointe Advisors, LLC | 49 612 | 58,49 | 1 181 | 68,71 | ||||
| 2025-07-24 | 13F | Robertson Stephens Wealth Management, LLC | 9 700 | 0,00 | 231 | 5,99 | ||||
| 2025-08-13 | 13F | Cerity Partners LLC | 422 634 | −4,82 | 10 063 | 1,26 | ||||
| 2025-08-13 | 13F | Guggenheim Capital Llc | 26 971 | 5,81 | 642 | 12,63 | ||||
| 2025-08-14 | 13F | Manufacturers Life Insurance Company, The | 230 586 | −0,88 | 5 490 | 5,46 | ||||
| 2025-08-13 | 13F | OMERS ADMINISTRATION Corp | 178 214 | 4 243 | ||||||
| 2025-07-09 | 13F | Mirador Capital Partners LP | 21 920 | 4,38 | 522 | 10,85 | ||||
| 2025-08-11 | 13F | Citigroup Inc | 0 | −100,00 | 0 | |||||
| 2025-07-31 | 13F | Buckingham Strategic Partners | 16 296 | 81,55 | 388 | 94,00 | ||||
| 2025-07-30 | 13F | Whittier Trust Co Of Nevada Inc | 9 575 | 0,00 | 228 | 6,07 | ||||
| 2025-08-11 | 13F | Core Wealth Partners LLC | 11 668 | 0,00 | 278 | 6,13 | ||||
| 2025-08-08 | 13F | Hartland & Co., LLC | 18 000 | 0,00 | 429 | 6,47 | ||||
| 2025-08-14 | 13F | Lazard Asset Management Llc | 32 266 | −38,05 | 1 | −100,00 | ||||
| 2025-08-07 | 13F | Evoke Wealth, Llc | 39 859 | 0,00 | 949 | 6,39 | ||||
| 2025-08-13 | 13F | Truvestments Capital Llc | 193 963 | −0,71 | 4 618 | 5,65 | ||||
| 2025-07-30 | 13F | Mid-American Wealth Advisory Group, Inc. | 189 | 4 | ||||||
| 2025-08-08 | 13F | Bouchey Financial Group Ltd | 30 252 | 0,00 | 720 | 6,35 | ||||
| 2025-04-30 | 13F | Stratos Wealth Advisors, LLC | 0 | −100,00 | 0 | |||||
| 2025-07-28 | 13F | RMR Capital Management, LLC | 190 495 | −21,68 | 4 536 | −16,68 | ||||
| 2025-07-23 | 13F | Columbus Macro, LLC | 437 561 | 12,40 | 10 418 | 19,60 | ||||
| 2025-08-13 | 13F | Natixis | 25 249 | 0,00 | 601 | 6,75 | ||||
| 2025-07-30 | 13F | Blume Capital Management, Inc. | 450 | 0,00 | 11 | 0,00 | ||||
| 2025-08-08 | 13F/A | Ignite Planners, LLC | 71 358 | 53,96 | 1 770 | 85,82 | ||||
| 2025-08-14 | 13F | Integrated Wealth Concepts LLC | 18 339 | 10,88 | 437 | 17,84 | ||||
| 2025-08-14 | 13F | Progeny 3, Inc. | 2 476 398 | 0,96 | 58 963 | 7,41 | ||||
| 2025-05-14 | 13F | Group One Trading, L.p. | 0 | −100,00 | 0 | −100,00 | ||||
| 2025-08-12 | 13F | Atlas Capital Advisors Llc | 5 115 | 0,00 | 122 | 6,14 | ||||
| 2025-07-07 | 13F | Thurston, Springer, Miller, Herd & Titak, Inc. | 200 | 0,00 | 5 | 0,00 | ||||
| 2025-08-28 | NP | SMVIX - Simt Small Cap Value Fund Class I | 4 848 | −71,11 | 115 | −69,33 | ||||
| 2025-08-07 | 13F | Merrion Investment Management Co, LLC | 25 000 | 0,00 | 595 | 6,44 | ||||
| 2025-08-14 | 13F | Ameriprise Financial Inc | 215 650 | 6,58 | 5 176 | 14,24 | ||||
| 2025-06-10 | 13F | Birchbrook, Inc. | 0 | −100,00 | 0 | −100,00 | ||||
| 2025-08-12 | 13F | Jpmorgan Chase & Co | 942 789 | 0,49 | 22 448 | 6,92 | ||||
| 2025-08-14 | 13F | State Street Corp | 89 663 | 257,76 | 2 135 | 281,07 | ||||
| 2025-07-22 | 13F | Grimes & Company, Inc. | 12 161 | 290 | ||||||
| 2025-08-13 | 13F | Barclays Plc | 0 | −100,00 | 0 | |||||
| 2025-08-13 | 13F | Quadrant Capital Group Llc | 0 | −100,00 | 0 | |||||
| 2025-07-10 | 13F | Peoples Bank/KS | 0 | −100,00 | 0 | |||||
| 2025-08-14 | 13F | Quantinno Capital Management LP | 58 035 | 1 382 | ||||||
| 2025-08-15 | 13F | Captrust Financial Advisors | 44 425 | −31,00 | 1 058 | −26,60 | ||||
| 2025-08-13 | 13F | Plan Group Financial, LLC | 51 428 | 32,13 | 1 224 | 40,53 | ||||
| 2025-05-14 | 13F | Caitlin John, LLC | 0 | −100,00 | 0 | |||||
| 2025-07-29 | NP | GIMFX - GMO Implementation Fund | 6 729 | 157 | ||||||
| 2025-08-06 | 13F | First Horizon Advisors, Inc. | 4 123 | 73,97 | 98 | 84,91 | ||||
| 2025-08-12 | 13F | XTX Topco Ltd | 51 926 | 1 236 | ||||||
| 2025-07-15 | 13F | Riverbridge Partners Llc | 48 835 | 3,37 | 1 163 | 9,93 | ||||
| 2025-05-14 | 13F | Group One Trading, L.p. | Put | 0 | −100,00 | 0 | −100,00 | |||
| 2025-07-28 | 13F | BRYN MAWR TRUST Co | 31 070 | 0,00 | 740 | 6,33 | ||||
| 2025-08-14 | 13F | Ares Management Llc | 1 402 689 | 2,19 | 33 398 | 8,72 | ||||
| 2025-08-14 | 13F | Goldman Sachs Group Inc | 347 494 | 336,55 | 8 274 | 364,51 | ||||
| 2025-07-17 | 13F | Janney Montgomery Scott LLC | 264 827 | −4,34 | 6 | 0,00 | ||||
| 2025-07-18 | 13F | SOA Wealth Advisors, LLC. | 0 | −100,00 | 0 | |||||
| 2025-08-14 | 13F | IHT Wealth Management, LLC | 105 149 | 6,64 | 2 504 | 13,46 | ||||
| 2025-07-29 | 13F | Stratos Wealth Partners, LTD. | 9 484 | 0,32 | 226 | 6,64 | ||||
| 2025-07-09 | 13F | Gilman Hill Asset Management, LLC | 465 241 | 4,09 | 11 077 | 10,74 | ||||
| 2025-08-14 | 13F/A | Rockefeller Capital Management L.P. | 207 112 | 7,31 | 4 931 | 14,17 | ||||
| 2025-08-04 | 13F | Canton Hathaway, LLC | 47 430 | −1,66 | 1 | 0,00 | ||||
| 2025-07-22 | 13F | Sage Investment Counsel LLC | 26 277 | 0,00 | 626 | 6,29 | ||||
| 2025-08-13 | 13F | Cresset Asset Management, LLC | 303 843 | −0,12 | 7 235 | 6,26 | ||||
| 2025-08-12 | 13F | Sixth Street Partners Management Company, L.P. | 2 714 226 | 0,00 | 64 626 | 6,39 | ||||
| 2025-08-15 | 13F | Great West Life Assurance Co /can/ | 136 054 | 2,59 | 3 | 50,00 | ||||
| 2025-08-21 | NP | MOFTX - Mercer Opportunistic Fixed Income Fund Class I | 30 000 | 714 | ||||||
| 2025-08-26 | NP | GMOV - GMO U.S. Value ETF | 2 345 | −1,64 | 56 | 3,77 | ||||
| 2025-08-06 | 13F | Texas Yale Capital Corp. | 35 500 | 1,43 | 845 | 7,92 | ||||
| 2025-07-24 | 13F | Us Bancorp \de\ | 25 113 | 0,00 | 598 | 6,23 | ||||
| 2025-08-08 | 13F | Lgt Capital Partners Ltd. | 336 500 | −14,81 | 8 012 | −9,37 | ||||
| 2025-08-12 | 13F | Financial Advocates Investment Management | 0 | −100,00 | 0 | |||||
| 2025-08-14 | 13F | D. E. Shaw & Co., Inc. | 24 606 | 586 | ||||||
| 2025-08-12 | 13F | Proequities, Inc. | Put | 0 | 0 | |||||
| 2025-08-14 | 13F | Boston Private Wealth Llc | 0 | −100,00 | 0 |