Grunnleggende statistikk
| Institusjonelle eiere | 397 total, 397 long only, 0 short only, 0 long/short - change of 5,54% MRQ |
| Gjennomsnittlig porteføljeallokering | 0.4005 % - change of 0,98% MRQ |
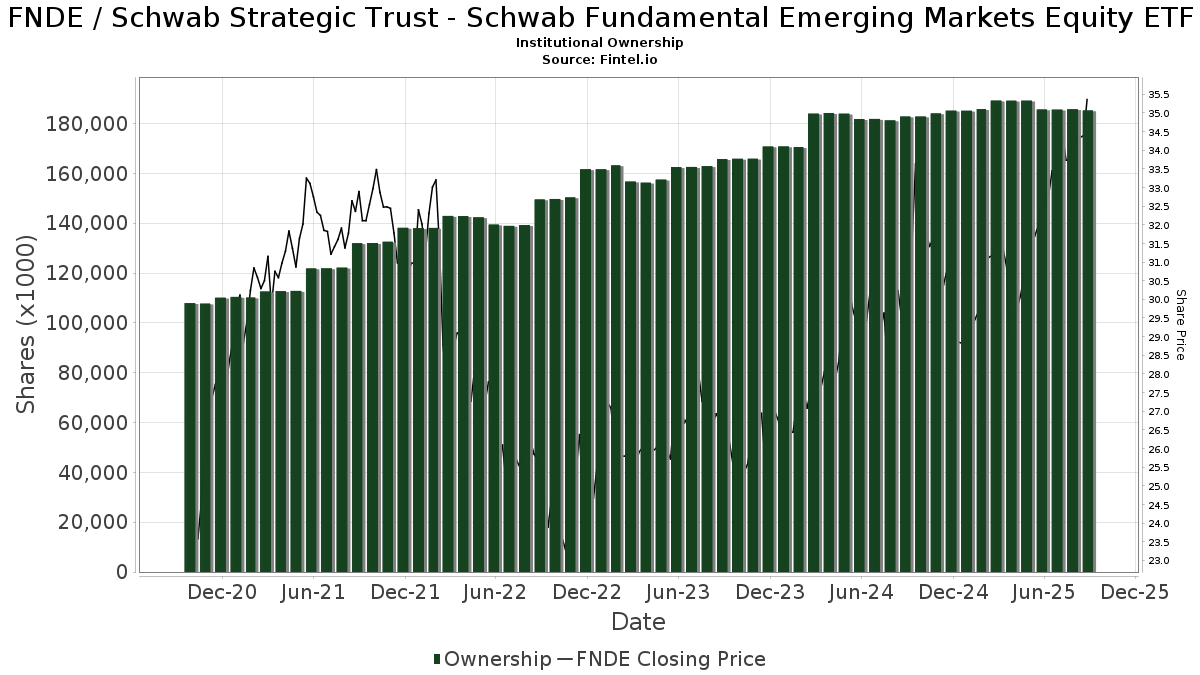
| Institusjonelle aksjer (Long) | 185 222 740 (ex 13D/G) - change of −0,39MM shares −0,21% MRQ |
| Institusjonell verdi (Long) | $ 5 999 238 USD ($1000) |
Institusjonelt eierskap og aksjonærer
Schwab Strategic Trust - Schwab Fundamental Emerging Markets Equity ETF (US:FNDE) har 397 institusjonelle eiere og aksjonærer som har sendt inn 13D/G- eller 13F-skjemaer til Securities Exchange Commission (SEC). Disse institusjonene eier til sammen 185,222,740 aksjer. De største aksjonærene inkluderer Charles Schwab Investment Management Inc, Fmr Llc, RMEAX - Aspiriant Risk-Managed Equity Allocation Fund Advisor Shares, Morgan Stanley, Victory Capital Management Inc, Bank Of America Corp /de/, Bogart Wealth, LLC, 1832 Asset Management L.P., USCRX - Cornerstone Moderately Aggressive Fund, and Unison Advisors LLC .
Schwab Strategic Trust - Schwab Fundamental Emerging Markets Equity ETF (ARCA:FNDE) institusjonell eierstruktur viser nåværende posisjoner i selskapet fordelt på institusjoner og fond, samt de siste endringene i posisjonsstørrelse. De største aksjonærene kan være individuelle investorer, verdipapirfond, hedgefond eller institusjoner. Schedule 13D indikerer at investoren eier (eller har eid) mer enn 5 % av selskapet og har til hensikt (eller hadde til hensikt) å aktivt forfølge en endring i forretningsstrategien. Schedule 13G indikerer en passiv investering på over 5 %.
The share price as of September 12, 2025 is 35,77 / share. Previously, on September 13, 2024, the share price was 29,54 / share. This represents an increase of 21,09% over that period.
Fondssentiment-score
Fondssentiment Score (også kjent som akkumulering av eierskap poengsum) viser hvilke aksjer som er mest kjøpt av fond. Den er resultatet av en sofistikert, kvantitativ flerfaktormodell som identifiserer selskaper med de høyeste nivåene av institusjonell akkumulering. Beregningsmodellen for poeng bruker en kombinasjon av den totale økningen i antall offentliggjorte eiere, endringer i porteføljeallokeringen til disse eierne og andre beregninger. Tallet går fra 0 til 100, der høyere tall indikerer en høyere grad av akkumulering i forhold til sammenlignbare selskaper, der 50 er gjennomsnittet.
Oppdateringsfrekvens: Daglig
Sjekk ut Ownership Explorer, som inneholder en liste over de høyest rangerte selskapene.
Institusjonell Put/Call-forhold
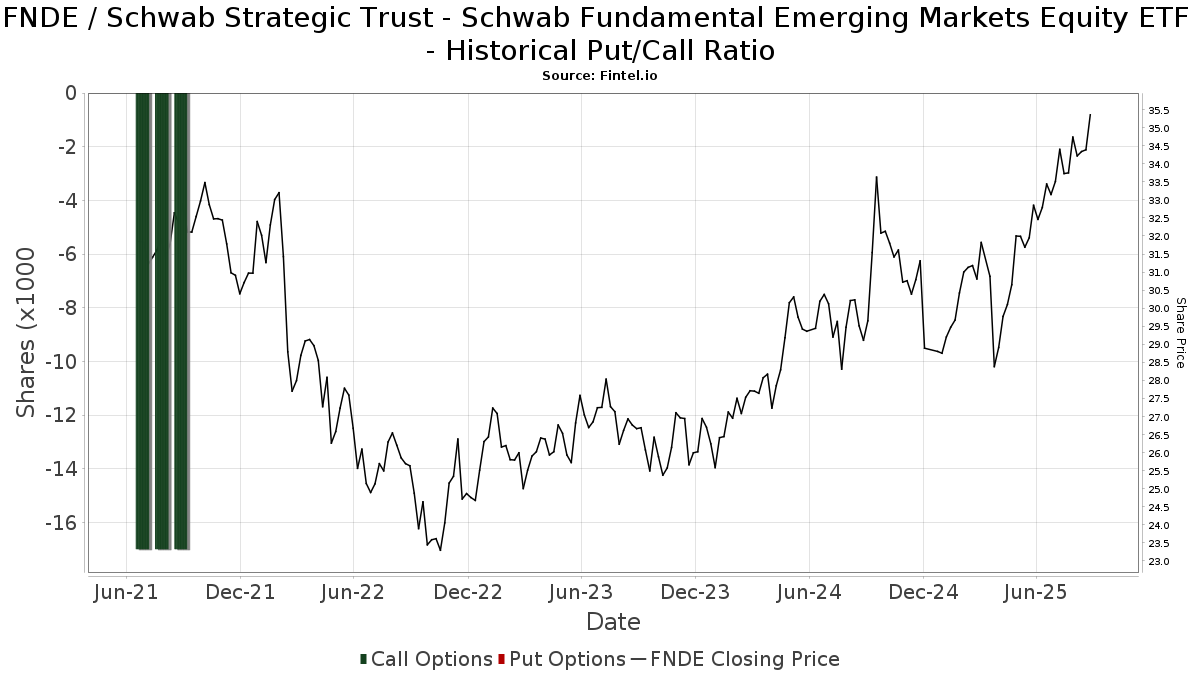
I tillegg til å rapportere standard aksje- og gjeldsemisjoner må institusjoner med mer enn 100 millioner kroner i forvaltningskapital også oppgi beholdningen av put- og callopsjoner. Siden put-opsjoner generelt indikerer et negativt sentiment, og call-opsjoner indikerer et positivt sentiment, kan vi få et inntrykk av det generelle institusjonelle sentimentet ved å plotte forholdet mellom put- og call-opsjoner. Diagrammet til høyre viser det historiske forholdet mellom put- og call-opsjoner for dette instrumentet.
Ved å bruke Put/Call-forholdet som en indikator på investorsentimentet kan man overvinne en av de viktigste svakhetene ved å bruke totalt institusjonelt eierskap, nemlig at en betydelig andel av forvaltningskapitalen investeres passivt for å følge indekser. Passivt forvaltede fond kjøper vanligvis ikke opsjoner, slik at indikatoren for put/call-forhold i større grad gjenspeiler stemningen i aktivt forvaltede fond.
13D/G-arkiveringer
Vi presenterer 13D/G-arkiveringene separat fra 13F-arkiveringene fordi de behandles forskjellig av SEC. 13D/G-arkiveringene kan sendes inn av grupper av investorer (med én leder), mens 13D/G-arkiveringene ikke kan sendes inn. Dette fører til situasjoner der en investor kan sende inn en 13D/G-rapport med én verdi for alle aksjene (som representerer alle aksjene som eies av investorgruppen), men deretter sende inn en 13F-melding med en annen verdi for alle aksjene (som kun representerer deres eget eierskap). Dette betyr at aksjeeierskap i 13D/G-arkiveringene og 13F-arkiveringene ofte ikke er direkte sammenlignbare, og vi presenterer dem derfor separat.
Merk: Fra og med 16. mai 2021 viser vi ikke lenger eiere som ikke har sendt inn en 13D/G i løpet av det siste året. Tidligere viste vi hele historikken for 13D/G-arkiveringer. Generelt må enheter som er pålagt å sende inn 13D/G-arkiveringer, sende inn minst én gang i året før de sender inn en avsluttende rapport. Det hender imidlertid at fond trekker seg ut av posisjoner uten å sende inn en avsluttende innlevering (dvs. at de avvikler), slik at visning av hele historikken av og til fører til forvirring om det nåværende eierskapet. For å unngå forvirring viser vi nå bare "nåværende" eiere, det vil si eiere som har sendt inn informasjon i løpet av det siste året.
Upgrade to unlock premium data.
13F- og NPORT-arkiveringer
Detaljer om 13F-arkiveringer er gratis. Detaljer om NP-arkiveringer krever et premium-medlemskap. Grønne rader indikerer nye posisjoner. Røde rader indikerer lukkede posisjoner. Klikk på lenke ikonet for å se hele transaksjonshistorikken.
Oppgrader
for å låse opp premiedata og eksportere til Excel. ![]() .
.
| Fildato | Kilde | Investor | Type | Gjennomsnittlig pris (estimert) |
Aksjer | Δ Aksjer (%) |
Rapportert verdi ($1000) | Verdi (%) | Portallokering (%) | |
|---|---|---|---|---|---|---|---|---|---|---|
| 2025-08-04 | 13F | Waterfront Wealth Inc. | 9 088 | 0,00 | 300 | 7,17 | ||||
| 2025-07-07 | 13F | Investors Research Corp | 349 | 0,00 | 12 | 10,00 | ||||
| 2025-08-01 | 13F | Envestnet Asset Management Inc | 1 203 500 | −1,58 | 39 728 | 5,48 | ||||
| 2025-07-28 | 13F | Essex LLC | 164 047 | 2,97 | 5 415 | 10,38 | ||||
| 2025-07-25 | 13F | Ackerman Capital Advisors, LLC | 44 682 | −1,40 | 1 475 | 5,66 | ||||
| 2025-08-01 | 13F | Bessemer Group Inc | 0 | −100,00 | 0 | |||||
| 2025-08-07 | 13F | BOK Financial Private Wealth, Inc. | 747 | 0,00 | 25 | 4,35 | ||||
| 2025-08-13 | 13F | 1832 Asset Management L.P. | 1 751 536 | 5,96 | 57 818 | 13,57 | ||||
| 2025-08-12 | 13F | Charles Schwab Investment Management Inc | 120 408 653 | −1,07 | 3 974 690 | 6,03 | ||||
| 2025-08-14 | 13F | Raymond James Financial Inc | 569 618 | 2,97 | 18 803 | 10,37 | ||||
| 2025-08-18 | 13F | Geneos Wealth Management Inc. | 673 | 46,62 | 22 | 57,14 | ||||
| 2025-07-28 | 13F | Cutler Investment Counsel Llc | 29 227 | −0,37 | 965 | 6,76 | ||||
| 2025-08-12 | 13F | Aspiring Ventures, LLC | 14 890 | −23,21 | 492 | −17,34 | ||||
| 2025-08-14 | 13F | Smartleaf Asset Management LLC | 8 161 | 21,44 | 269 | 30,10 | ||||
| 2025-08-04 | 13F | Center for Financial Planning, Inc. | 0 | −100,00 | 0 | |||||
| 2025-08-08 | 13F | Firestone Capital Management | 18 262 | −12,91 | 603 | −6,67 | ||||
| 2025-08-11 | 13F | Pineridge Advisors LLC | 0 | −100,00 | 0 | |||||
| 2025-08-04 | 13F | Creative Financial Designs Inc /adv | 1 025 | −6,39 | 34 | 0,00 | ||||
| 2025-07-14 | 13F | AdvisorNet Financial, Inc | 12 372 | 0,63 | 408 | 7,94 | ||||
| 2025-07-28 | 13F | Perfromance Wealth Partners, LLC | 21 268 | 702 | ||||||
| 2025-07-14 | 13F | Park Avenue Securities Llc | 16 971 | 30,93 | 1 | |||||
| 2025-08-13 | 13F | Crescent Grove Advisors, LLC | 6 245 | 206 | ||||||
| 2025-07-28 | 13F | Hamilton Point Investment Advisors, LLC | 835 | 0,00 | 28 | 8,00 | ||||
| 2025-05-02 | 13F | United Community Bank | 0 | −100,00 | 0 | |||||
| 2025-07-17 | 13F | Wolff Wiese Magana Llc | 215 | 22,86 | 7 | 40,00 | ||||
| 2025-07-29 | 13F | Pinnacle Wealth Management, LLC | 7 155 | −10,01 | 236 | −3,28 | ||||
| 2025-07-16 | 13F | Perigon Wealth Management, LLC | 9 313 | 307 | ||||||
| 2025-07-28 | 13F | Sagace Wealth Management LLC | 63 346 | −1,53 | 2 091 | 5,55 | ||||
| 2025-07-08 | 13F | Parallel Advisors, LLC | 8 982 | 50,33 | 296 | 60,87 | ||||
| 2025-07-09 | 13F | Breakwater Investment Management | 2 236 | 0,00 | 74 | 7,35 | ||||
| 2025-04-24 | 13F | Decker Retirement Planning Inc. | 0 | −100,00 | 0 | |||||
| 2025-07-28 | 13F | Revolve Wealth Partners, LLC | 0 | −100,00 | 0 | |||||
| 2025-08-12 | 13F | Allen Capital Group, LLC | 98 645 | −0,19 | 3 256 | 6,96 | ||||
| 2025-08-12 | 13F | Harbor Advisory Corp /ma/ | 48 443 | 0,00 | 1 599 | 7,17 | ||||
| 2025-08-14 | 13F | Greenline Partners, LLC | 0 | −100,00 | 0 | |||||
| 2025-08-06 | 13F | First Horizon Advisors, Inc. | 1 229 | 1 154,08 | 41 | 1 233,33 | ||||
| 2025-07-18 | 13F | Bridge Generations Wealth Management Llc | 0 | −100,00 | 0 | |||||
| 2025-08-06 | 13F | Commonwealth Equity Services, Llc | 451 600 | 1,32 | 15 | 7,69 | ||||
| 2025-07-08 | 13F | 21 West Wealth Management LLC | 36 768 | 1 214 | ||||||
| 2025-07-09 | 13F | Fermata Advisors, LLC | 105 216 | 2,29 | 3 473 | 9,63 | ||||
| 2025-07-14 | 13F | UMA Financial Services, Inc. | 668 | 0,00 | 22 | 10,00 | ||||
| 2025-08-14 | 13F | GWM Advisors LLC | 5 275 | 25,27 | 174 | 34,88 | ||||
| 2025-07-21 | 13F | Future Financial Wealth Managment LLC | 800 | 0,00 | 26 | 8,33 | ||||
| 2025-04-29 | 13F | Wood Tarver Financial Group, LLC | 0 | −100,00 | 0 | |||||
| 2025-08-13 | 13F | Twin Peaks Wealth Advisors, LLC | 131 | 5 | ||||||
| 2025-07-28 | 13F | Kiker Wealth Management, LLC | 75 | −68,22 | 2 | −71,43 | ||||
| 2025-08-11 | 13F | Aptus Capital Advisors, LLC | 5 064 | 7,08 | 167 | 15,17 | ||||
| 2025-07-30 | 13F | Klingman & Associates, LLC | 6 316 | 208 | ||||||
| 2025-08-11 | 13F | Private Advisor Group, LLC | 19 301 | −85,43 | 637 | −84,39 | ||||
| 2025-08-11 | 13F | Greykasell Wealth Strategies, Inc. | 135 | 0,00 | 4 | 0,00 | ||||
| 2025-05-12 | 13F | Kohmann Bosshard Financial Services, LLC | 0 | −100,00 | 0 | |||||
| 2025-07-25 | 13F | Concord Asset Management, LLC/VA | 70 474 | 2 326 | ||||||
| 2025-07-31 | 13F | Guardian Financial Partners, LLC | 31 420 | 16,21 | 1 037 | 24,64 | ||||
| 2025-08-04 | 13F | REDW Wealth LLC | 8 019 | 0,00 | 265 | 7,32 | ||||
| 2025-07-15 | 13F | SJS Investment Consulting Inc. | 538 | 0,00 | 18 | 6,25 | ||||
| 2025-07-25 | 13F | Concord Wealth Partners | 70 474 | 2,01 | 2 326 | 9,36 | ||||
| 2025-08-05 | 13F | Mission Wealth Management, Lp | 7 267 | 10,73 | 240 | 18,32 | ||||
| 2025-09-04 | 13F/A | Advisor Group Holdings, Inc. | 770 490 | −15,01 | 25 418 | −8,98 | ||||
| 2025-04-22 | 13F | Veridan Wealth LLC | 102 798 | −1,53 | 3 166 | 2,96 | ||||
| 2025-08-06 | 13F | AE Wealth Management LLC | 2 038 | −32,22 | 67 | −27,17 | ||||
| 2025-04-22 | 13F | Cordant, Inc. | 0 | −100,00 | 0 | |||||
| 2025-07-24 | 13F | Jfs Wealth Advisors, Llc | 193 | 0,52 | 6 | 20,00 | ||||
| 2025-04-29 | 13F | Element Wealth, LLC | 0 | −100,00 | 0 | |||||
| 2025-07-28 | 13F | Frazier Financial Advisors, LLC | 4 519 | 7,34 | 149 | 15,50 | ||||
| 2025-08-13 | 13F | Northwestern Mutual Wealth Management Co | 393 717 | 76,95 | 12 997 | 89,67 | ||||
| 2025-07-07 | 13F | Retirement Wealth Solutions LLC | 150 | 0,00 | 5 | 0,00 | ||||
| 2025-08-05 | 13F | Bank of New York Mellon Corp | 20 112 | −10,58 | 664 | −4,19 | ||||
| 2025-08-08 | 13F | Sculati Wealth Management, LLC | 112 703 | −55,19 | 3 720 | −51,98 | ||||
| 2025-08-11 | 13F | HighTower Advisors, LLC | 51 108 | −2,60 | 1 687 | 4,39 | ||||
| 2025-08-14 | 13F/A | Rockefeller Capital Management L.P. | 20 678 | 683 | ||||||
| 2025-08-14 | 13F | Federation des caisses Desjardins du Quebec | 77 | 0,00 | 3 | 0,00 | ||||
| 2025-07-24 | 13F | IFP Advisors, Inc | 26 305 | 34,85 | 868 | 44,67 | ||||
| 2025-08-05 | 13F | Dunhill Financial, LLC | 404 | 0,00 | 13 | 8,33 | ||||
| 2025-08-14 | 13F | Van Den Berg Management I, Inc | 2 356 | −3,64 | 78 | 2,67 | ||||
| 2025-07-10 | 13F | Mogy Joel R Investment Counsel Inc | 523 | 17 | ||||||
| 2025-07-29 | 13F | Clearview Wealth Advisors LLC | 12 337 | −0,84 | 407 | 6,27 | ||||
| 2025-07-17 | 13F | Charles Schwab Trust Co | 365 643 | 0,16 | 12 070 | 7,35 | ||||
| 2025-08-15 | 13F | Semmax Financial Advisors Inc. | 35 | 0,00 | 1 | 0,00 | ||||
| 2025-07-17 | 13F | Wagner Wealth Management, Llc | 0 | −100,00 | 0 | |||||
| 2025-08-04 | 13F | IFG Advisory, LLC | 224 814 | 8,31 | 7 421 | 16,08 | ||||
| 2025-08-13 | 13F | Colonial Trust Advisors | 9 785 | 0,00 | 323 | 7,31 | ||||
| 2025-08-08 | 13F | Your Advocates Ltd., LLP | 221 507 | −5,56 | 7 312 | 1,20 | ||||
| 2025-04-25 | 13F | EnRich Financial Partners LLC | 0 | −100,00 | 0 | |||||
| 2025-08-06 | 13F | SOUTH STATE Corp | 15 337 | −8,09 | 506 | −1,36 | ||||
| 2025-08-12 | 13F | Global Retirement Partners, LLC | 4 765 | 46,66 | 157 | 67,02 | ||||
| 2025-08-08 | 13F | Financial Gravity Companies, Inc. | 37 | 1 | ||||||
| 2025-05-15 | 13F | Human Investing LLC | 0 | −100,00 | 0 | |||||
| 2025-08-14 | 13F | Mercer Global Advisors Inc /adv | 36 051 | −14,07 | 1 190 | −7,89 | ||||
| 2025-08-01 | 13F | Y-Intercept (Hong Kong) Ltd | 33 059 | 1 091 | ||||||
| 2025-08-12 | 13F | Steward Partners Investment Advisory, Llc | 4 281 | 252,35 | 141 | 281,08 | ||||
| 2025-07-08 | 13F | Zrc Wealth Management, Llc | 3 625 | 0,44 | 120 | 8,18 | ||||
| 2025-08-13 | 13F | Renaissance Technologies Llc | 0 | −100,00 | 0 | |||||
| 2025-08-13 | 13F | Custom Index Systems, Llc | 79 156 | 28,00 | 2 613 | 37,18 | ||||
| 2025-07-15 | 13F | McAdam, LLC | 320 551 | 20,47 | 10 581 | 29,12 | ||||
| 2025-08-11 | 13F | Cornerstone Planning Group LLC | 318 008 | 611 453,85 | 10 695 | 1 069 300,00 | ||||
| 2025-08-14 | 13F | Hrt Financial Lp | 0 | −100,00 | 0 | |||||
| 2025-08-05 | 13F | Integrity Financial Corp /WA | 2 681 | 0,00 | 88 | 7,32 | ||||
| 2025-08-13 | 13F | Victory Capital Management Inc | 2 236 513 | −30,38 | 73 827 | −25,39 | ||||
| 2025-07-25 | NP | USCRX - Cornerstone Moderately Aggressive Fund | 1 588 753 | −17,56 | 49 903 | −14,51 | ||||
| 2025-08-14 | 13F | Betterment LLC | 41 745 | 15,52 | 1 | 0,00 | ||||
| 2025-07-30 | 13F | Exencial Wealth Advisors, Llc | 290 285 | −2,00 | 9 582 | 5,03 | ||||
| 2025-07-31 | 13F | CVA Family Office, LLC | 243 450 | 3,24 | 8 036 | 10,66 | ||||
| 2025-07-31 | 13F/A | Avion Wealth | 100 | 0,00 | 0 | |||||
| 2025-08-04 | 13F | Assetmark, Inc | 53 345 | 167,25 | 1 761 | 186,64 | ||||
| 2025-08-12 | 13F | SRS Capital Advisors, Inc. | 2 644 | 87 | ||||||
| 2025-08-13 | 13F | Kayne Anderson Rudnick Investment Management Llc | 632 | 0,00 | 21 | 5,26 | ||||
| 2025-08-04 | 13F | Atria Investments Llc | 7 305 | 241 | ||||||
| 2025-08-14 | 13F | Guardian Wealth Advisors, Llc / Nc | 348 | −5,69 | 11 | 0,00 | ||||
| 2025-08-14 | 13F | Stifel Financial Corp | 69 797 | 20,08 | 2 304 | 28,72 | ||||
| 2025-07-10 | 13F | Focus Financial Network, Inc. | 23 914 | 0,59 | 789 | 7,79 | ||||
| 2025-08-14 | 13F | Comerica Bank | 36 794 | 8,98 | 1 215 | 16,84 | ||||
| 2025-07-16 | 13F | West Branch Capital LLC | 185 | 0,00 | 6 | 20,00 | ||||
| 2025-07-03 | 13F | Collective Family Office Llc | 68 516 | 0,46 | 2 262 | 7,67 | ||||
| 2025-07-29 | 13F | Systelligence, LLC | 353 835 | 2,20 | 11 680 | 9,54 | ||||
| 2025-08-14 | 13F | Royal Bank Of Canada | 153 069 | −2,87 | 5 053 | 4,08 | ||||
| 2025-08-08 | 13F | Larson Financial Group LLC | 11 006 | 21,91 | 363 | 30,58 | ||||
| 2025-08-11 | 13F | Pin Oak Investment Advisors Inc | 1 389 | 0 | ||||||
| 2025-08-05 | 13F | Sebold Capital Management, Inc. | 276 545 | 5,93 | 9 129 | 13,52 | ||||
| 2025-08-12 | 13F | Accredited Wealth Management, LLC | 1 285 | −6,95 | 42 | 0,00 | ||||
| 2025-08-06 | 13F | Savant Capital, LLC | 175 224 | −6,13 | 5 784 | 0,61 | ||||
| 2025-07-28 | 13F | Eq Wealth Advisors, Llc | 63 320 | −1,11 | 2 090 | 5,98 | ||||
| 2025-07-25 | 13F | Cwm, Llc | 10 940 | −3,81 | 0 | |||||
| 2025-07-17 | 13F | Paradigm Financial Partners, Llc | 27 807 | 0,04 | 918 | 7,13 | ||||
| 2025-08-15 | 13F | Captrust Financial Advisors | 11 991 | 6,29 | 396 | 13,83 | ||||
| 2025-07-16 | 13F | Embree Financial Group | 19 270 | 636 | ||||||
| 2025-07-14 | 13F | Farmers & Merchants Investments Inc | 0 | −100,00 | 0 | |||||
| 2025-08-14 | 13F | Quantinno Capital Management LP | 20 037 | 26,94 | 661 | 36,01 | ||||
| 2025-07-30 | 13F | Bogart Wealth, LLC | 1 780 920 | 1,21 | 58 788 | 8,47 | ||||
| 2025-08-14 | 13F | Vivaldi Capital Management, LLC | 68 145 | 10,56 | 2 249 | 18,49 | ||||
| 2025-08-13 | 13F | Transce3nd, LLC | 203 | 0,00 | 7 | 0,00 | ||||
| 2025-07-29 | 13F | Unison Advisors LLC | 1 330 222 | −1,38 | 43 911 | 5,70 | ||||
| 2025-08-14 | 13F | UBS Group AG | 532 361 | −14,55 | 17 573 | −8,42 | ||||
| 2025-07-29 | 13F | Aspiriant, Llc | 636 111 | −2,86 | 20 998 | 4,12 | ||||
| 2025-07-11 | 13F | SILVER OAK SECURITIES, Inc | 98 304 | 43,73 | 3 245 | 54,23 | ||||
| 2025-08-12 | 13F | O'shaughnessy Asset Management, Llc | 4 467 | 42,58 | 147 | 53,13 | ||||
| 2025-08-13 | 13F | Jackson Creek Investment Advisors LLC | 29 984 | −4,31 | 1 | |||||
| 2025-07-15 | 13F | BCS Wealth Management | 18 911 | 58,00 | 1 | |||||
| 2025-07-22 | 13F | Appleton Partners Inc/ma | 7 252 | 0 | ||||||
| 2025-08-08 | 13F | Cetera Investment Advisers | 183 487 | 60,83 | 6 057 | 72,39 | ||||
| 2025-04-29 | 13F | Callan Capital, LLC | 625 251 | 11,44 | 19 258 | 18,16 | ||||
| 2025-08-07 | 13F | Resources Investment Advisors, LLC. | 7 257 | −5,66 | 240 | 1,27 | ||||
| 2025-08-07 | 13F | CENTRAL TRUST Co | 38 | 1 | ||||||
| 2025-08-12 | 13F | AlphaCore Capital LLC | 585 637 | 26 387,43 | 19 332 | 28 327,94 | ||||
| 2025-08-14 | 13F | Glenmede Investment Management, LP | 5 574 | 184 | ||||||
| 2025-08-14 | 13F | Old Mission Capital Llc | 639 267 | 2 923,97 | 21 102 | 3 141,47 | ||||
| 2025-07-08 | 13F | FF Advisors,LLC | 51 295 | 0,00 | 1 693 | 7,70 | ||||
| 2025-07-17 | 13F | Beacon Capital Management, LLC | 19 | 1 | ||||||
| 2025-08-08 | 13F | Kaizen Financial Strategies | 42 779 | −5,84 | 1 412 | 0,93 | ||||
| 2025-07-09 | 13F | Westmount Partners, LLC | 25 957 | 0,00 | 857 | 7,13 | ||||
| 2025-07-21 | 13F | Empirical Financial Services, LLC d.b.a. Empirical Wealth Management | 130 135 | 3,30 | 4 296 | 10,70 | ||||
| 2025-08-26 | NP | EVTTX - The E-Valuator Conservative/Moderate (30%-50%) RMS Fund Service Class Shares | 11 644 | 12,80 | 384 | 21,14 | ||||
| 2025-07-25 | 13F | Index Fund Advisors, Inc. | 17 502 | 0,93 | 578 | 8,05 | ||||
| 2025-07-30 | 13F | Studio Investment Management Llc | 0 | −100,00 | 0 | |||||
| 2025-08-04 | 13F | L.m. Kohn & Company | 18 697 | 617 | ||||||
| 2025-07-15 | 13F | Alpha Omega Wealth Management LLC | 121 736 | 2,55 | 4 019 | 9,90 | ||||
| 2025-08-11 | 13F | Bell Investment Advisors, Inc | 220 443 | −0,80 | 7 277 | 6,31 | ||||
| 2025-05-22 | 13F | Mattson Financial Services, LLC | 0 | −100,00 | 0 | |||||
| 2025-07-14 | 13F | Northland Capital Management LLC | 74 839 | 3,41 | 2 470 | 10,81 | ||||
| 2025-07-31 | 13F | Buckingham Strategic Partners | 9 664 | 0,26 | 319 | 7,77 | ||||
| 2025-08-13 | 13F/A | StoneX Group Inc. | 0 | −100,00 | 0 | −100,00 | ||||
| 2025-08-13 | 13F | Fisher Asset Management, LLC | 0 | −100,00 | 0 | |||||
| 2025-08-13 | 13F | Lido Advisors, LLC | 0 | −100,00 | 0 | |||||
| 2025-05-15 | 13F | IHT Wealth Management, LLC | 0 | −100,00 | 0 | |||||
| 2025-07-09 | 13F | WealthCare Investment Partners, LLC | 43 555 | 240,94 | 1 462 | 293,80 | ||||
| 2025-05-15 | 13F | Glen Eagle Advisors, LLC | 0 | −100,00 | 0 | −100,00 | ||||
| 2025-07-17 | 13F | Hengehold Capital Management Llc | 41 162 | −0,03 | 1 359 | 7,10 | ||||
| 2025-07-25 | 13F | Almanack Investment Partners, LLC. | 597 544 | 34,79 | 19 725 | 44,46 | ||||
| 2025-05-09 | 13F | Wade Financial Advisory, Inc | 46 205 | 5,99 | 1 423 | 12,40 | ||||
| 2025-08-13 | 13F | Continuum Advisory, LLC | 0 | −100,00 | 0 | |||||
| 2025-07-10 | 13F | Moller Financial Services | 375 874 | 4,29 | 12 408 | 11,77 | ||||
| 2025-07-16 | 13F | Kathmere Capital Management, LLC | 357 912 | 1,47 | 11 815 | 8,75 | ||||
| 2025-07-25 | 13F | Keener Financial Planning LLC | 436 | 0 | ||||||
| 2025-07-29 | 13F | Stratos Wealth Partners, LTD. | 16 829 | 4,67 | 556 | 12,12 | ||||
| 2025-08-11 | 13F | FSA Wealth Management LLC | 87 | 0,00 | 3 | 0,00 | ||||
| 2025-07-10 | 13F | Trust Point Inc. | 102 451 | 14,47 | 3 382 | 22,68 | ||||
| 2025-07-22 | 13F | Davidson Kahn Capital Management, LLC | 20 664 | −0,80 | 682 | 6,40 | ||||
| 2025-07-15 | 13F | Financial Management Professionals, Inc. | 88 | 0,00 | 3 | 0,00 | ||||
| 2025-08-08 | 13F | Bailard, Inc. | 0 | −100,00 | 0 | |||||
| 2025-07-30 | 13F | Drive Wealth Management, Llc | 65 876 | 0,61 | 2 175 | 7,84 | ||||
| 2025-05-12 | 13F | Independent Advisor Alliance | 0 | −100,00 | 0 | |||||
| 2025-08-12 | 13F | Proequities, Inc. | 0 | 0 | ||||||
| 2025-07-31 | 13F | Wealthfront Advisers Llc | 19 312 | 68,03 | 637 | 80,45 | ||||
| 2025-08-26 | NP | EVAGX - The E-Valuator Aggressive Growth (85%-99%) RMS Fund Service Class Shares | 135 854 | 2,24 | 4 485 | 9,58 | ||||
| 2025-08-14 | 13F | Citadel Advisors Llc | 222 235 | 7 336 | ||||||
| 2025-07-17 | 13F | ERn Financial, LLC | 59 124 | 1 952 | ||||||
| 2025-08-14 | 13F | TCG Advisory Services, LLC | 10 824 | 11,63 | 357 | 19,80 | ||||
| 2025-08-13 | 13F | Capital Analysts, Inc. | 995 | 0,00 | 0 | |||||
| 2025-07-07 | 13F | Versant Capital Management, Inc | 9 234 | −7,18 | 305 | −0,65 | ||||
| 2025-08-11 | 13F | Regal Investment Advisors LLC | 0 | −100,00 | 0 | |||||
| 2025-05-05 | 13F | Parkworth Wealth Management, Inc. | 0 | −100,00 | 0 | |||||
| 2025-08-07 | 13F | Addison Advisors LLC | 100 | 0,00 | 3 | 0,00 | ||||
| 2025-08-11 | 13F | Empowered Funds, LLC | 153 222 | 3,27 | 5 058 | 10,68 | ||||
| 2025-08-05 | 13F | Sensible Money, LLC | 89 732 | 0,67 | 2 962 | 7,91 | ||||
| 2025-08-07 | 13F | Allworth Financial LP | 8 817 | −25,37 | 291 | −18,03 | ||||
| 2025-08-08 | 13F | Smithfield Trust Co | 2 233 | 0,00 | 0 | |||||
| 2025-08-13 | 13F | Cerity Partners LLC | 41 379 | 2,30 | 1 366 | 9,64 | ||||
| 2025-08-13 | 13F | Cheviot Value Management, LLC | 131 168 | 1,66 | 4 465 | 11,63 | ||||
| 2025-07-31 | 13F | Keeler THomas Management LLC | 0 | −100,00 | 0 | |||||
| 2025-07-25 | 13F | Gibson Capital, LLC | 25 823 | −29,71 | 852 | −24,67 | ||||
| 2025-05-06 | 13F | Kathleen S. Wright Associates Inc. | 0 | −100,00 | 0 | |||||
| 2025-08-26 | NP | EVCLX - The E-Valuator Conservative (15%-30%) RMS Fund Service Class Shares | 9 778 | 21,83 | 323 | 30,36 | ||||
| 2025-08-08 | 13F | Tortoise Investment Management, LLC | 1 021 | 0,00 | 34 | 6,45 | ||||
| 2025-08-14 | 13F | Clark Capital Management Group, Inc. | 62 968 | −6,69 | 2 079 | 0,00 | ||||
| 2025-07-21 | 13F | Ameritas Advisory Services, LLC | 3 510 | 116 | ||||||
| 2025-07-08 | 13F | First National Corp /ma/ /adv | 42 271 | 0,00 | 1 395 | 7,23 | ||||
| 2025-08-13 | 13F | Beacon Pointe Advisors, LLC | 42 680 | 11,20 | 1 409 | 19,12 | ||||
| 2025-08-04 | 13F | Integrity Alliance, Llc. | 0 | −100,00 | 0 | |||||
| 2025-07-29 | 13F | Creekside Partners | 28 377 | 33,24 | 937 | 42,90 | ||||
| 2025-08-13 | 13F | Elgethun Capital Management | 446 527 | 8,08 | 14 740 | 15,83 | ||||
| 2025-07-28 | 13F | Morningstar Investment Management LLC | 561 672 | 18,23 | 19 | 28,57 | ||||
| 2025-07-31 | 13F | Oak Harbor Wealth Partners, Llc | 71 | 2 | ||||||
| 2025-07-29 | 13F | Kelman-Lazarov, Inc. | 603 420 | 2,44 | 19 919 | 9,79 | ||||
| 2025-08-27 | 13F/A | Brinker Capital Investments, LLC | 144 227 | −0,92 | 4 761 | 6,18 | ||||
| 2025-09-09 | 13F | Cambridge Financial Group, LLC | 52 383 | −4,72 | 1 729 | 2,13 | ||||
| 2025-07-18 | 13F | Naples Global Advisors, Llc | 7 710 | 0,00 | 255 | 7,17 | ||||
| 2025-04-15 | 13F | Redhawk Wealth Advisors, Inc. | 0 | −100,00 | 0 | |||||
| 2025-07-31 | 13F | Resonant Capital Advisors, LLC | 571 159 | 1,92 | 18 854 | 9,22 | ||||
| 2025-05-15 | 13F | Oxford Financial Group Ltd | 0 | −100,00 | 0 | |||||
| 2025-07-17 | 13F | Raleigh Capital Management Inc. | 0 | 0 | ||||||
| 2025-08-12 | 13F | Peachtree Investment Partners, LLC | 44 | 0,00 | 1 | 0,00 | ||||
| 2025-08-13 | 13F | Colonial Trust Co / SC | 1 315 | −0,75 | 43 | 7,50 | ||||
| 2025-07-10 | 13F | Wealth Enhancement Advisory Services, Llc | 105 294 | 0,35 | 3 534 | 9,35 | ||||
| 2025-07-17 | 13F | Tempus Wealth Planning, LLC | 13 960 | 7,02 | 461 | 14,71 | ||||
| 2025-07-16 | 13F | Prairiewood Capital, LLC | 307 572 | 3,37 | 10 153 | 10,78 | ||||
| 2025-08-08 | 13F | Empower Advisory Group, LLC | 6 658 | 220 | ||||||
| 2025-08-01 | 13F | SYM FINANCIAL Corp | 2 290 | 114,82 | 76 | 134,38 | ||||
| 2025-08-05 | 13F | Bank Of Montreal /can/ | 13 164 | 2,52 | 435 | 9,87 | ||||
| 2025-08-14 | 13F | TT Capital Management LLC | 31 744 | 986 | ||||||
| 2025-07-24 | 13F | Lee Financial Co | 24 681 | 0,96 | 815 | 8,24 | ||||
| 2025-07-31 | 13F | Leavell Investment Management, Inc. | 66 720 | 3,41 | 2 202 | 10,82 | ||||
| 2025-07-31 | 13F | Cambridge Investment Research Advisors, Inc. | 463 904 | 19,60 | 15 | 36,36 | ||||
| 2025-08-06 | 13F | Rialto Wealth Management, LLC | 162 | 0,00 | 5 | 25,00 | ||||
| 2025-08-19 | 13F | Advisory Services Network, LLC | 72 935 | 2 435 | ||||||
| 2025-05-14 | 13F | Truvestments Capital Llc | 0 | −100,00 | 0 | |||||
| 2025-05-14 | 13F | Quartz Partners, LLC | 0 | −100,00 | 0 | |||||
| 2025-07-18 | 13F | Forza Wealth Management, LLC | 27 714 | 0,00 | 915 | 7,15 | ||||
| 2025-07-23 | 13F | Sax Wealth Advisors, Llc | 189 899 | 36,07 | 6 269 | 45,84 | ||||
| 2025-08-14 | 13F | Warren Averett Asset Management, LLC | 83 188 | −4,83 | 2 746 | 2,01 | ||||
| 2025-08-13 | 13F | Seven Springs Wealth Group, LLC | 395 868 | 10,51 | 13 068 | 18,44 | ||||
| 2025-07-21 | 13F | Synergy Financial Management, LLC | 26 712 | 1,29 | 882 | 8,50 | ||||
| 2025-08-13 | 13F | EverSource Wealth Advisors, LLC | 528 | 0,00 | 17 | 6,25 | ||||
| 2025-08-05 | 13F | Cherry Tree Wealth Management, LLC | 316 | 0,00 | 10 | 11,11 | ||||
| 2025-07-10 | 13F | Global Financial Private Client, LLC | 0 | −100,00 | 0 | |||||
| 2025-04-25 | 13F | MidAtlantic Capital Management, Inc. | 0 | −100,00 | 0 | |||||
| 2025-05-06 | 13F | Venturi Wealth Management, LLC | 0 | −100,00 | 0 | |||||
| 2025-07-22 | 13F | Iron Horse Wealth Management, LLC | 1 051 | 0,00 | 35 | 6,25 | ||||
| 2025-08-06 | 13F | Atlantic Union Bankshares Corp | 366 | 12 | ||||||
| 2025-07-30 | 13F | Mid-American Wealth Advisory Group, Inc. | 22 | 1 | ||||||
| 2025-08-01 | 13F | MorganRosel Wealth Management, LLC | 20 377 | 3,25 | 673 | 10,71 | ||||
| 2025-08-08 | 13F | Pnc Financial Services Group, Inc. | 458 | −37,94 | 15 | −31,82 | ||||
| 2025-08-14 | 13F | Bnp Paribas Arbitrage, Sa | 21 | 1 | ||||||
| 2025-08-13 | 13F | Virtue Capital Management, LLC | 0 | −100,00 | 0 | |||||
| 2025-08-19 | 13F | Asset Dedication, LLC | 210 451 | −0,63 | 6 947 | 6,52 | ||||
| 2025-07-16 | 13F | St Germain D J Co Inc | 0 | −100,00 | 0 | |||||
| 2025-08-14 | 13F | Murphy & Mullick Capital Management Corp | 1 653 | 0,00 | 55 | 10,00 | ||||
| 2025-08-15 | 13F | WFA of San Diego, LLC | 123 | 0,00 | 4 | 33,33 | ||||
| 2025-08-14 | 13F | Mariner, LLC | 105 455 | 0,85 | 3 481 | 8,11 | ||||
| 2025-07-16 | 13F | Townsend Asset Management Corp /nc/ /adv | 3 105 | −5,05 | 103 | 2,00 | ||||
| 2025-07-25 | NP | UCAGX - Cornerstone Aggressive Fund | 332 382 | −17,36 | 10 440 | −14,30 | ||||
| 2025-07-14 | 13F | Occidental Asset Management, LLC | 49 070 | −1,05 | 1 620 | 6,02 | ||||
| 2025-08-14 | 13F | Sunbelt Securities, Inc. | 43 | 95,45 | 1 | |||||
| 2025-07-17 | 13F | First County Bank /CT/ | 10 703 | 0,00 | 353 | 7,29 | ||||
| 2025-08-08 | 13F | Laurel Wealth Planning LLC | 157 414 | 3,03 | 5 196 | 10,44 | ||||
| 2025-07-11 | 13F | Coastwise Capital Group, LLC | 8 774 | −3,21 | 290 | 3,58 | ||||
| 2025-08-07 | 13F | Brio Consultants, LLC | 29 740 | 40,75 | 982 | 50,92 | ||||
| 2025-07-25 | 13F | Hazlett, Burt & Watson, Inc. | 209 | 31,45 | 0 | |||||
| 2025-08-01 | 13F | Oarsman Capital, Inc. | 9 194 | −9,06 | 303 | −2,57 | ||||
| 2025-07-29 | 13F | Financial Synergies Wealth Advisors, Inc. | 7 054 | 6,81 | 233 | 14,29 | ||||
| 2025-08-15 | 13F | Morgan Stanley | 2 497 114 | 6,62 | 82 430 | 14,27 | ||||
| 2025-08-04 | 13F | Savvy Advisors, Inc. | 13 946 | 81,56 | 460 | 94,92 | ||||
| 2025-08-12 | 13F | Coldstream Capital Management Inc | 0 | −100,00 | 0 | |||||
| 2025-08-14 | 13F | Waterford Advisors, LLC | 213 080 | −21,29 | 9 127 | 9,45 | ||||
| 2025-07-09 | 13F | Breakwater Capital Group | 34 192 | 29,04 | 1 129 | 38,24 | ||||
| 2025-05-09 | 13F | NBZ Investment Advisors LLC | 0 | −100,00 | 0 | |||||
| 2025-08-12 | 13F | BlackRock, Inc. | 8 718 | −0,01 | 288 | 7,09 | ||||
| 2025-04-29 | 13F | Lee Danner & Bass Inc | 0 | −100,00 | 0 | |||||
| 2025-08-15 | 13F | Asset Allocation Strategies LLC | 60 088 | 10,28 | 1 984 | 18,18 | ||||
| 2025-07-18 | 13F | Magnolia Private Wealth, LLC | 27 465 | −25,41 | 907 | −20,11 | ||||
| 2025-07-25 | 13F | Concurrent Investment Advisors, LLC | 142 948 | 2,88 | 4 719 | 10,26 | ||||
| 2025-08-14 | 13F | Wells Fargo & Company/mn | 2 388 | −31,32 | 79 | −27,10 | ||||
| 2025-07-24 | 13F | Eastern Bank | 130 | 0,00 | 4 | 0,00 | ||||
| 2025-07-18 | 13F | Access Financial Services, Inc. | 151 920 | −1,05 | 5 015 | 6,05 | ||||
| 2025-06-26 | NP | MSTSX - Morningstar Unconstrained Allocation Fund | 492 685 | −11,70 | 14 830 | −10,12 | ||||
| 2025-07-22 | 13F | Simplicity Wealth,LLC | 133 206 | 1 887,85 | 4 397 | 2 034,47 | ||||
| 2025-08-11 | 13F | Westover Capital Advisors, LLC | 140 391 | 11,24 | 4 634 | 19,22 | ||||
| 2025-07-23 | 13F | Godsey & Gibb Associates | 625 | 0,00 | 21 | 5,26 | ||||
| 2025-08-29 | 13F | Total Investment Management Inc | 95 | 3 | ||||||
| 2025-07-28 | 13F | Harbour Investments, Inc. | 7 070 | 21,02 | 233 | 30,17 | ||||
| 2025-07-16 | 13F | Highline Wealth Partners Llc | 133 | 4 | ||||||
| 2025-08-07 | 13F | Cahill Financial Advisors Inc | 46 252 | 0,26 | 1 527 | 7,46 | ||||
| 2025-07-17 | 13F | Sound Income Strategies, LLC | 0 | −100,00 | 0 | |||||
| 2025-08-26 | NP | EVVLX - The E-Valuator Very Conservative (0%-15%) RMS Fund Service Class Shares | 2 220 | 5,87 | 73 | 14,06 | ||||
| 2025-07-11 | 13F | Bond & Devick Financial Network, Inc. | 15 022 | 13,63 | 496 | 21,62 | ||||
| 2025-07-18 | 13F | Truist Financial Corp | 6 386 | 211 | ||||||
| 2025-08-15 | 13F | WealthCollab, LLC | 65 | 0,00 | 2 | 0,00 | ||||
| 2025-08-06 | 13F | Paladin Advisory Group, LLC | 24 | 1 | ||||||
| 2025-08-07 | 13F | 1620 Investment Advisors, Inc. | 379 | 0,00 | 13 | 9,09 | ||||
| 2025-07-24 | 13F | Etesian Wealth Advisors, Inc. | 87 350 | 44,88 | 2 883 | 55,33 | ||||
| 2025-08-14 | 13F | Operose Advisors LLC | 1 424 | 0,00 | 47 | 9,30 | ||||
| 2025-08-19 | 13F | Cape Investment Advisory, Inc. | 28 545 | −0,19 | 942 | 7,05 | ||||
| 2025-05-15 | 13F | Windsor Advisory Group, LLC | 0 | −100,00 | 0 | |||||
| 2025-07-15 | 13F | MCF Advisors LLC | 1 329 | −21,96 | 44 | −17,31 | ||||
| 2025-08-14 | 13F | Tandem Financial, LLC | 255 799 | 8 444 | ||||||
| 2025-05-15 | 13F | CAPROCK Group, Inc. | 15 585 | 0,95 | 480 | 7,14 | ||||
| 2025-08-12 | 13F | CIBC Private Wealth Group, LLC | 6 751 | −38,93 | 223 | −24,49 | ||||
| 2025-08-15 | 13F | Tower Research Capital LLC (TRC) | 0 | −100,00 | 0 | |||||
| 2025-08-14 | 13F | Main Street Financial Solutions, LLC | 29 195 | −3,89 | 964 | 2,99 | ||||
| 2025-07-07 | 13F | Kings Path Partners LLC | 1 306 | −2,54 | 43 | 4,88 | ||||
| 2025-08-11 | 13F | Traub Capital Management LLC | 17 155 | 566 | ||||||
| 2025-08-08 | 13F | Capital Investment Advisory Services, LLC | 3 108 | 0,00 | 103 | 7,37 | ||||
| 2025-08-14 | 13F | Financial Advisory Service, Inc. | 931 | −15,36 | 31 | −9,09 | ||||
| 2025-08-12 | 13F | Cowa, Llc | 276 879 | 41,84 | 9 145 | 52,10 | ||||
| 2025-08-12 | 13F | McGrath & Associates, Inc. | 41 236 | −13,56 | 1 361 | −7,35 | ||||
| 2025-08-14 | 13F | Jane Street Group, Llc | 0 | −100,00 | 0 | |||||
| 2025-07-22 | 13F | Merit Financial Group, LLC | 47 300 | −11,75 | 1 561 | −5,39 | ||||
| 2025-07-30 | 13F | Fairway Wealth LLC | 1 592 | −1,36 | 53 | 6,12 | ||||
| 2025-08-12 | 13F | Bokf, Na | 0 | −100,00 | 0 | |||||
| 2025-08-04 | 13F | Bristlecone Advisors, LLC | 792 | 0,64 | 26 | 8,33 | ||||
| 2025-08-01 | 13F | First Command Advisory Services, Inc. | 537 | 0,00 | 18 | 6,25 | ||||
| 2025-08-13 | 13F | Jones Financial Companies Lllp | 40 671 | 44,54 | 1 340 | 54,91 | ||||
| 2025-08-13 | 13F | Financial Freedom, LLC | 3 620 | 0,64 | 120 | 8,18 | ||||
| 2025-08-13 | 13F | Baird Financial Group, Inc. | 91 243 | 17,60 | 3 012 | 26,04 | ||||
| 2025-08-13 | 13F | Russell Investments Group, Ltd. | 328 | −10,63 | 11 | −9,09 | ||||
| 2025-08-07 | 13F | New England Private Wealth Advisors LLC | 7 128 | 0,58 | 240 | 10,09 | ||||
| 2025-08-07 | 13F | Parkside Financial Bank & Trust | 456 | 0,00 | 15 | 7,14 | ||||
| 2025-08-14 | 13F | Modern Wealth Management, LLC | 42 509 | −4,52 | 1 403 | 2,33 | ||||
| 2025-08-11 | 13F | Strategic Wealth Partners, Ltd. | 235 | 8 | ||||||
| 2025-08-14 | 13F | Bank Of America Corp /de/ | 2 217 604 | 9,82 | 73 203 | 17,70 | ||||
| 2025-07-07 | 13F | Vishria Bird Financial Group, LLC | 17 172 | 0,00 | 567 | 7,20 | ||||
| 2025-08-26 | NP | EVGLX - The E-Valuator Growth (70%-85%) RMS Fund Service Class Shares | 134 602 | −2,32 | 4 443 | 4,69 | ||||
| 2025-08-11 | 13F | Root Financial Partners, LLC | 7 728 | 255 | ||||||
| 2025-05-05 | 13F | Morningstar Investment Services LLC | 47 833 | −39,74 | 1 | −50,00 | ||||
| 2025-08-14 | 13F | Beaird Harris Wealth Management, LLC | 52 | 0,00 | 2 | 0,00 | ||||
| 2025-08-15 | 13F | CI Private Wealth, LLC | 27 956 | 66,07 | 923 | 77,99 | ||||
| 2025-08-12 | 13F | MAI Capital Management | 117 303 | −1,69 | 3 872 | 5,36 | ||||
| 2025-05-16 | 13F/A | Goldman Sachs Group Inc | 0 | −100,00 | 0 | −100,00 | ||||
| 2025-07-15 | 13F | Fifth Third Bancorp | 139 | 5 | ||||||
| 2025-07-18 | 13F | Bartlett & Co. Wealth Management Llc | 636 | −96,90 | 21 | −96,84 | ||||
| 2025-08-08 | 13F | Crossmark Global Holdings, Inc. | 68 456 | −1,84 | 2 259 | 5,61 | ||||
| 2025-08-01 | 13F | Solstein Capital, LLC | 49 | 2 | ||||||
| 2025-08-13 | 13F | Alerus Financial Na | 74 | 2 | ||||||
| 2025-08-14 | 13F | Fmr Llc | 16 678 878 | −6,56 | 550 570 | 0,14 | ||||
| 2025-08-05 | 13F | Golden Bell Financial Planning LLC | 8 111 | 0,00 | 268 | 7,23 | ||||
| 2025-07-21 | 13F | Warner Financial, Inc | 10 427 | 0,02 | 0 | |||||
| 2025-04-21 | 13F | Ronald Blue Trust, Inc. | 0 | −100,00 | 0 | |||||
| 2025-04-23 | 13F | Legacy Advisors, LLC | 0 | −100,00 | 0 | |||||
| 2025-05-15 | 13F/A | Orion Portfolio Solutions, LLC | 145 571 | −7,93 | 4 484 | −2,39 | ||||
| 2025-07-31 | 13F | Glass Jacobson Investment Advisors llc | 166 | 5 | ||||||
| 2025-08-06 | 13F | Legacy Wealth Managment, LLC/ID | 0 | −100,00 | 0 | |||||
| 2025-08-14 | 13F | CoreCap Advisors, LLC | 11 603 | 121,01 | 383 | 137,89 | ||||
| 2025-08-26 | NP | EVMLX - The E-Valuator Moderate (50%-70%) RMS Fund Service Class Shares | 59 737 | 8,39 | 1 972 | 16,15 | ||||
| 2025-04-30 | 13F | Sofos Investments, Inc. | 37 | 1 | −98,18 | |||||
| 2025-08-12 | 13F | LPL Financial LLC | 269 984 | −1,48 | 8 912 | 5,59 | ||||
| 2025-08-08 | 13F | Glassman Wealth Services | 0 | −100,00 | 0 | |||||
| 2025-07-24 | 13F | Von Berge Wealth Management Group, LLC | 22 055 | 1,96 | 751 | 15,38 | ||||
| 2025-07-09 | 13F | Fragasso Group Inc. | 25 978 | 2,81 | 858 | 10,15 | ||||
| 2025-07-29 | 13F | Foster & Motley Inc | 1 305 819 | −2,56 | 43 | 4,88 | ||||
| 2025-07-31 | 13F | Graybill Bartz & Assoc Ltd | 0 | −100,00 | 0 | |||||
| 2025-07-14 | 13F | Foster Group, Inc. | 16 597 | 0,64 | 548 | 7,89 | ||||
| 2025-08-08 | 13F | IMA Wealth, Inc. | 118 | 4 | ||||||
| 2025-08-11 | 13F | Brown Brothers Harriman & Co | 43 332 | 5 398,98 | 1 430 | 5 858,33 | ||||
| 2025-08-14 | 13F | Susquehanna International Group, Llp | 19 056 | 629 | ||||||
| 2025-08-04 | 13F | Spire Wealth Management | 554 | 18 | ||||||
| 2025-08-29 | NP | GDMA - Gadsden Dynamic Multi-Asset ETF | 152 807 | 2,99 | 5 044 | 10,40 | ||||
| 2025-08-11 | 13F | HHM Wealth Advisors, LLC | 520 697 | 0,82 | 17 188 | 8,06 | ||||
| 2025-08-12 | 13F | Founders Financial Alliance, LLC | 95 | −94,50 | 3 | −94,34 | ||||
| 2025-04-24 | 13F | ZynergyRetirementPlanningLLC | 0 | −100,00 | 0 | |||||
| 2025-07-09 | 13F | Intelligence Driven Advisers, LLC | 6 392 | 211 | ||||||
| 2025-07-25 | NP | USBSX - Cornerstone Moderate Fund | 607 668 | −23,25 | 19 087 | −20,41 | ||||
| 2025-08-07 | 13F | Wealth Forward, LLC | 186 813 | −0,21 | 6 167 | 6,96 | ||||
| 2025-04-28 | 13F | American Capital Advisory, LLC | 0 | −100,00 | 0 | |||||
| 2025-08-27 | NP | RMEAX - Aspiriant Risk-Managed Equity Allocation Fund Advisor Shares | 2 560 111 | 0,00 | 84 509 | 7,18 | ||||
| 2025-08-08 | 13F | D'Orazio & Associates, Inc. | 7 431 | 0,62 | 245 | 7,93 | ||||
| 2025-08-12 | 13F | Howe & Rusling Inc | 3 558 | 3 105,41 | 117 | 3 800,00 | ||||
| 2025-07-31 | 13F | Cabot Wealth Management Inc | 324 582 | 30,81 | 10 714 | 40,20 | ||||
| 2025-08-13 | 13F | SCS Capital Management LLC | 32 985 | −12,37 | 1 089 | −6,13 | ||||
| 2025-08-14 | 13F | Mml Investors Services, Llc | 220 196 | 43,52 | 7 | 75,00 | ||||
| 2025-08-12 | 13F | Tumwater Wealth Management, LLC | 15 233 | 0,00 | 503 | 7,04 | ||||
| 2025-07-15 | 13F | Maseco Llp | 1 721 | 57 | ||||||
| 2025-07-17 | 13F | Johnson & White Wealth Management, LLC | 44 607 | 1 | ||||||
| 2025-08-08 | 13F | Hartland & Co., LLC | 3 607 | 0,00 | 119 | 7,21 | ||||
| 2025-07-07 | 13F | Bangor Savings Bank | 11 904 | 11,58 | 393 | 19,51 | ||||
| 2025-05-14 | 13F | Van Hulzen Asset Management, LLC | 0 | −100,00 | 0 | |||||
| 2025-08-08 | 13F | WASHINGTON TRUST Co | 0 | −100,00 | 0 | |||||
| 2025-04-15 | 13F | GPS Wealth Strategies Group, LLC | 0 | −100,00 | 0 | |||||
| 2025-07-15 | 13F | Mather Group, Llc. | 0 | −100,00 | 0 | |||||
| 2025-07-24 | 13F | Us Bancorp \de\ | 6 932 | 5,01 | 229 | 12,32 | ||||
| 2025-08-14 | 13F | Colony Group, LLC | 86 439 | 17,97 | 2 853 | 26,46 | ||||
| 2025-08-15 | 13F | Kestra Advisory Services, LLC | 15 595 | 16,92 | 515 | 25,37 | ||||
| 2025-07-17 | 13F | CWA Asset Management Group, LLC | 6 349 | 210 | ||||||
| 2025-08-14 | 13F | Graney & King, LLC | 71 | 1,43 | 2 | 0,00 | ||||
| 2025-08-06 | 13F | Nicholas Hoffman & Company, LLC. | 262 753 | 8,20 | 8 673 | 15,96 | ||||
| 2025-07-08 | 13F | Goldstone Financial Group, LLC | 58 239 | 11,26 | 1 955 | 21,22 | ||||
| 2025-07-23 | 13F | Litman Gregory Asset Management LLC | 22 240 | 7,11 | 734 | 14,87 | ||||
| 2025-07-25 | NP | UCMCX - Cornerstone Moderately Conservative Fund | 72 547 | −20,76 | 2 279 | −17,85 | ||||
| 2025-08-12 | 13F | Jpmorgan Chase & Co | 202 997 | −9,73 | 6 701 | −3,26 | ||||
| 2025-07-29 | 13F | Harbor Asset Planning, Inc. | 651 | 21 | ||||||
| 2025-07-14 | 13F | Hoey Investments, Inc | 1 422 | 47 | ||||||
| 2025-07-23 | 13F | Abel Hall, LLC | 14 341 | −4,12 | 473 | 2,83 | ||||
| 2025-07-23 | 13F | Kingswood Wealth Advisors, Llc | 12 010 | 8,58 | 396 | 16,47 | ||||
| 2025-08-13 | 13F | Quadrant Capital Group Llc | 6 241 | 0,00 | 206 | 7,29 | ||||
| 2025-07-08 | 13F/A | Salem Investment Counselors Inc | 72 | −84,42 | 2 | −85,71 | ||||
| 2025-08-13 | 13F | Summit Financial, LLC | 23 922 | 75,63 | 790 | 88,31 | ||||
| 2025-07-22 | 13F | Valley National Advisers Inc | 841 | 0,00 | 0 | |||||
| 2025-08-01 | 13F | Motco | 25 | 1 | ||||||
| 2025-07-18 | 13F | Dogwood Wealth Management LLC | 48 | 2 | ||||||
| 2025-08-13 | 13F | IAG Wealth Partners, LLC | 43 | 0,00 | 1 | 0,00 | ||||
| 2025-07-25 | 13F | Apollon Wealth Management, LLC | 128 414 | 4,96 | 4 239 | 12,47 | ||||
| 2025-08-11 | 13F | Citigroup Inc | 73 109 | 25 462,59 | 2 413 | 30 062,50 | ||||
| 2025-08-13 | 13F | Congress Wealth Management LLC / DE / | 55 282 | −3,22 | 1 825 | 3,58 | ||||
| 2025-07-17 | 13F | Johnson Bixby & Associates, LLC | 419 921 | 5,09 | 13 862 | 12,64 | ||||
| 2025-08-06 | 13F | Walkner Condon Financial Advisors LLC | 8 918 | 36,61 | 294 | 46,27 | ||||
| 2025-08-01 | 13F | Rossby Financial, LCC | 1 789 | −6,48 | 59 | 3,51 | ||||
| 2025-07-25 | 13F | RHS Financial, LLC | 229 703 | −10,73 | 7 582 | −4,33 | ||||
| 2025-07-21 | 13F | Pflug Koory, LLC | 1 236 | 41 | ||||||
| 2025-07-25 | 13F | Envestnet Portfolio Solutions, Inc. | 7 914 | −35,25 | 261 | −30,59 | ||||
| 2025-04-14 | 13F | Bruce G. Allen Investments, LLC | 0 | −100,00 | 0 | |||||
| 2025-08-05 | 13F | Freestone Capital Holdings, LLC | 8 271 | 0,00 | 273 | 7,48 | ||||
| 2025-07-17 | 13F | Janney Montgomery Scott LLC | 78 590 | 0,47 | 3 | 0,00 | ||||
| 2025-07-25 | 13F | PrairieView Partners, LLC | 6 367 | 0,00 | 0 | |||||
| 2025-08-14 | 13F | Ancora Advisors, LLC | 385 | −23,76 | 13 | −20,00 | ||||
| 2025-05-16 | 13F | Coppell Advisory Solutions LLC | 0 | −100,00 | 0 | |||||
| 2025-07-07 | 13F | Thurston, Springer, Miller, Herd & Titak, Inc. | 38 546 | 682,98 | 1 272 | 742,38 | ||||
| 2025-05-02 | 13F | Armor Investment Advisors, LLC | 0 | −100,00 | 0 | |||||
| 2025-07-25 | 13F | NorthRock Partners, LLC | 3 293 | −2,66 | 109 | 3,85 | ||||
| 2025-07-16 | 13F | Brown, Lisle/cummings, Inc. | 50 | 0,00 | 2 | 0,00 | ||||
| 2025-07-16 | 13F | Signaturefd, Llc | 3 273 | −2,85 | 108 | 4,85 | ||||
| 2025-08-05 | 13F | Key FInancial Inc | 397 | 0,00 | 13 | 8,33 | ||||
| 2025-08-12 | 13F | Archer Investment Corp | 378 | 0,27 | 12 | 9,09 | ||||
| 2025-08-18 | 13F/A | National Bank Of Canada /fi/ | 1 156 592 | 28,47 | 38 175 | 37,71 | ||||
| 2025-08-14 | 13F | EP Wealth Advisors, Inc. | 306 241 | 371,43 | 10 109 | 405,45 | ||||
| 2025-08-14 | 13F | Clarity Capital Advisors, LLC | 17 293 | 0,64 | 571 | 7,75 | ||||
| 2025-07-29 | 13F | Salomon & Ludwin, LLC | 312 | 0,00 | 10 | 11,11 | ||||
| 2025-04-29 | 13F | Rice Partnership, LLC | 0 | −100,00 | 0 | |||||
| 2025-07-24 | 13F | JNBA Financial Advisors | 20 | 1 | ||||||
| 2025-07-09 | 13F | Lbmc Investment Advisors, Llc | 8 735 | 0,00 | 288 | 7,06 | ||||
| 2025-07-22 | 13F | Red Tortoise LLC | 60 901 | 0,34 | 2 010 | 7,54 | ||||
| 2025-08-01 | 13F | Austin Private Wealth, LLC | 32 405 | −3,09 | 1 070 | 3,89 | ||||
| 2025-05-15 | 13F | Glenmede Trust Co Na | 5 490 | 53,44 | 169 | 64,08 | ||||
| 2025-05-12 | 13F | Sandy Spring Bank | 402 | 1 016,67 | 12 | 1 100,00 | ||||
| 2025-08-06 | 13F | Golden State Wealth Management, LLC | 159 | 0,00 | 5 | 25,00 | ||||
| 2025-07-02 | 13F | Central Pacific Bank - Trust Division | 3 | 0,00 | 0 | |||||
| 2025-08-08 | 13F | Avantax Advisory Services, Inc. | 8 883 | 2,20 | 293 | 9,74 | ||||
| 2025-08-11 | 13F | Avantax Planning Partners, Inc. | 6 840 | 2,36 | 226 | 9,76 | ||||
| 2025-07-17 | 13F | Halbert Hargrove Global Advisors, Llc | 0 | −100,00 | 0 | |||||
| 2025-08-13 | 13F | SageView Advisory Group, LLC | 9 688 | 0,53 | 329 | 10,81 | ||||
| 2025-07-16 | 13F/A | CX Institutional | 334 | 0,00 | 0 | |||||
| 2025-07-25 | 13F | Sequoia Financial Advisors, LLC | 15 488 | −22,96 | 511 | −17,45 | ||||
| 2025-07-17 | 13F | Saxon Interests, Inc. | 13 680 | 0,00 | 421 | 0,00 | ||||
| 2025-07-10 | 13F | Wedmont Private Capital | 13 331 | 2,26 | 442 | 17,29 | ||||
| 2025-08-14 | 13F | Qube Research & Technologies Ltd | 115 424 | 81,38 | 3 810 | 94,39 | ||||
| 2025-07-18 | 13F | Parsons Capital Management Inc/ri | 9 900 | 0,00 | 327 | 7,24 | ||||
| 2025-07-28 | 13F | Morris Financial Concepts, Inc. | 2 831 | −2,04 | 93 | 4,49 | ||||
| 2025-07-21 | 13F | Ameriflex Group, Inc. | 37 | −2,63 | 1 | 0,00 | ||||
| 2025-07-29 | 13F | Angeles Wealth Management, Llc | 2 800 | 0,00 | 92 | 6,98 | ||||
| 2025-07-14 | 13F | Abound Wealth Management | 5 178 | 324,43 | 171 | 359,46 | ||||
| 2025-05-13 | 13F | Northern Trust Corp | 0 | −100,00 | 0 | |||||
| 2025-07-31 | 13F | Whipplewood Advisors, LLC | 41 818 | 418 080,00 | 1 380 | 5,34 | ||||
| 2025-07-21 | 13F | DHJJ Financial Advisors, Ltd. | 590 | 0,00 | 19 | 5,56 | ||||
| 2025-07-24 | 13F | Riverchase Wealth Management, Llc | 17 286 | −5,73 | 571 | 1,06 | ||||
| 2025-08-05 | 13F | Huntington National Bank | 58 | −14,71 | ||||||
| 2025-08-08 | 13F | Creative Planning | 153 890 | 0,69 | 5 080 | 7,90 | ||||
| 2025-08-11 | 13F | Principal Securities, Inc. | 468 365 | 32,25 | 15 461 | 50,29 | ||||
| 2025-07-25 | 13F | Johnson Investment Counsel Inc | 83 283 | −4,68 | 2 749 | 2,16 | ||||
| 2025-07-21 | 13F | Ashton Thomas Securities, Llc | 3 198 | −2,50 | 106 | 3,96 | ||||
| 2025-07-31 | 13F | Strata Wealth Advisors, LLC | 9 508 | 314 | ||||||
| 2025-07-11 | 13F | Farther Finance Advisors, LLC | 12 178 | 11,37 | 402 | 19,29 | ||||
| 2025-08-01 | 13F | Chilton Capital Management Llc | 314 379 | −1,49 | 10 378 | 5,58 | ||||
| 2025-05-13 | 13F | Cresset Asset Management, LLC | 0 | −100,00 | 0 |