Grunnleggende statistikk
| Institusjonelle eiere | 235 total, 231 long only, 0 short only, 4 long/short - change of 5,38% MRQ |
| Gjennomsnittlig porteføljeallokering | 0.1604 % - change of 14,63% MRQ |
| Institusjonelle aksjer (Long) | 56 008 368 (ex 13D/G) - change of 1,02MM shares 1,86% MRQ |
| Institusjonell verdi (Long) | $ 1 534 222 USD ($1000) |
Institusjonelt eierskap og aksjonærer
Fresenius Medical Care AG - Depositary Receipt (Common Stock) (US:FMS) har 235 institusjonelle eiere og aksjonærer som har sendt inn 13D/G- eller 13F-skjemaer til Securities Exchange Commission (SEC). Disse institusjonene eier til sammen 56,008,368 aksjer. De største aksjonærene inkluderer Pzena Investment Management Llc, VWNDX - Vanguard Windsor Fund Investor Shares, Fiduciary Management Inc /wi/, Dodge & Cox, DODBX - Dodge & Cox Balanced Fund, VASVX - Vanguard Selected Value Fund Investor Shares, Morgan Stanley, FMIHX - Large Cap Fund Investor Class, Todd Asset Management Llc, and Liberty All Star Equity Fund .
Fresenius Medical Care AG - Depositary Receipt (Common Stock) (NYSE:FMS) institusjonell eierstruktur viser nåværende posisjoner i selskapet fordelt på institusjoner og fond, samt de siste endringene i posisjonsstørrelse. De største aksjonærene kan være individuelle investorer, verdipapirfond, hedgefond eller institusjoner. Schedule 13D indikerer at investoren eier (eller har eid) mer enn 5 % av selskapet og har til hensikt (eller hadde til hensikt) å aktivt forfølge en endring i forretningsstrategien. Schedule 13G indikerer en passiv investering på over 5 %.
The share price as of September 10, 2025 is 24,86 / share. Previously, on September 11, 2024, the share price was 20,54 / share. This represents an increase of 21,03% over that period.

Fondssentiment-score
Fondssentiment Score (også kjent som akkumulering av eierskap poengsum) viser hvilke aksjer som er mest kjøpt av fond. Den er resultatet av en sofistikert, kvantitativ flerfaktormodell som identifiserer selskaper med de høyeste nivåene av institusjonell akkumulering. Beregningsmodellen for poeng bruker en kombinasjon av den totale økningen i antall offentliggjorte eiere, endringer i porteføljeallokeringen til disse eierne og andre beregninger. Tallet går fra 0 til 100, der høyere tall indikerer en høyere grad av akkumulering i forhold til sammenlignbare selskaper, der 50 er gjennomsnittet.
Oppdateringsfrekvens: Daglig
Sjekk ut Ownership Explorer, som inneholder en liste over de høyest rangerte selskapene.
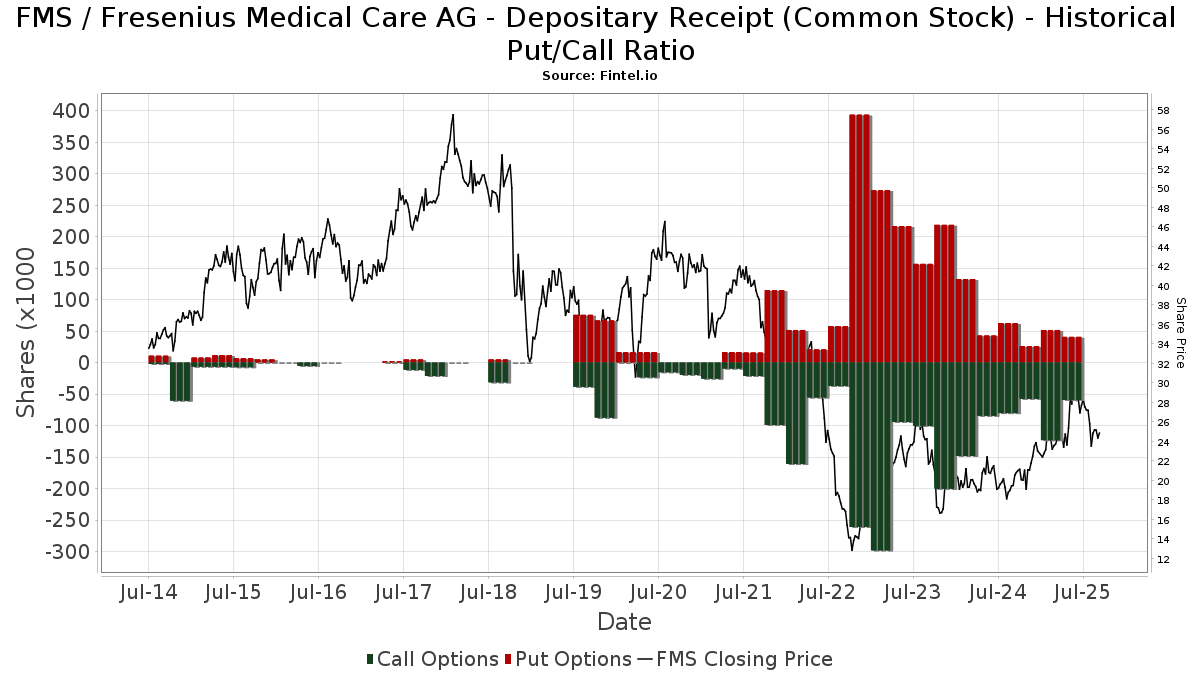
Institusjonell Put/Call-forhold
I tillegg til å rapportere standard aksje- og gjeldsemisjoner må institusjoner med mer enn 100 millioner kroner i forvaltningskapital også oppgi beholdningen av put- og callopsjoner. Siden put-opsjoner generelt indikerer et negativt sentiment, og call-opsjoner indikerer et positivt sentiment, kan vi få et inntrykk av det generelle institusjonelle sentimentet ved å plotte forholdet mellom put- og call-opsjoner. Diagrammet til høyre viser det historiske forholdet mellom put- og call-opsjoner for dette instrumentet.
Ved å bruke Put/Call-forholdet som en indikator på investorsentimentet kan man overvinne en av de viktigste svakhetene ved å bruke totalt institusjonelt eierskap, nemlig at en betydelig andel av forvaltningskapitalen investeres passivt for å følge indekser. Passivt forvaltede fond kjøper vanligvis ikke opsjoner, slik at indikatoren for put/call-forhold i større grad gjenspeiler stemningen i aktivt forvaltede fond.
13D/G-arkiveringer
Vi presenterer 13D/G-arkiveringene separat fra 13F-arkiveringene fordi de behandles forskjellig av SEC. 13D/G-arkiveringene kan sendes inn av grupper av investorer (med én leder), mens 13D/G-arkiveringene ikke kan sendes inn. Dette fører til situasjoner der en investor kan sende inn en 13D/G-rapport med én verdi for alle aksjene (som representerer alle aksjene som eies av investorgruppen), men deretter sende inn en 13F-melding med en annen verdi for alle aksjene (som kun representerer deres eget eierskap). Dette betyr at aksjeeierskap i 13D/G-arkiveringene og 13F-arkiveringene ofte ikke er direkte sammenlignbare, og vi presenterer dem derfor separat.
Merk: Fra og med 16. mai 2021 viser vi ikke lenger eiere som ikke har sendt inn en 13D/G i løpet av det siste året. Tidligere viste vi hele historikken for 13D/G-arkiveringer. Generelt må enheter som er pålagt å sende inn 13D/G-arkiveringer, sende inn minst én gang i året før de sender inn en avsluttende rapport. Det hender imidlertid at fond trekker seg ut av posisjoner uten å sende inn en avsluttende innlevering (dvs. at de avvikler), slik at visning av hele historikken av og til fører til forvirring om det nåværende eierskapet. For å unngå forvirring viser vi nå bare "nåværende" eiere, det vil si eiere som har sendt inn informasjon i løpet av det siste året.
Upgrade to unlock premium data.
| Fildato | Skjema | Investor | Tidligere aksjer |
Siste aksjer |
Δ Aksjer (prosent) |
Eierandel (prosent) |
Δ Eierandel (prosent) |
|
|---|---|---|---|---|---|---|---|---|
| 2025-03-10 | Fresenius SE & Co. KGaA | 94,380,382 | 83,780,382 | -11.23 | 28.60 | -11.18 | ||
| 2025-02-14 | HARRIS ASSOCIATES L P | 15,173,585 | 11,717,575 | -22.78 | 3.90 | -24.56 |
13F- og NPORT-arkiveringer
Detaljer om 13F-arkiveringer er gratis. Detaljer om NP-arkiveringer krever et premium-medlemskap. Grønne rader indikerer nye posisjoner. Røde rader indikerer lukkede posisjoner. Klikk på lenke ikonet for å se hele transaksjonshistorikken.
Oppgrader
for å låse opp premiedata og eksportere til Excel. ![]() .
.
| Fildato | Kilde | Investor | Type | Gjennomsnittlig pris (estimert) |
Aksjer | Δ Aksjer (%) |
Rapportert verdi ($1000) | Verdi (%) | Portallokering (%) | |
|---|---|---|---|---|---|---|---|---|---|---|
| 2025-07-24 | 13F | Us Bancorp \de\ | 75 660 | 225,53 | 2 162 | 273,88 | ||||
| 2025-06-26 | NP | Elevation Series Trust - The Opal International Dividend Income ETF | 0 | −100,00 | 0 | −100,00 | ||||
| 2025-08-11 | 13F | Hexagon Capital Partners LLC | 0 | −100,00 | 0 | |||||
| 2025-07-24 | 13F | IFP Advisors, Inc | 464 | 0,00 | 13 | 18,18 | ||||
| 2025-07-30 | 13F | Loring Wolcott & Coolidge Fiduciary Advisors Llp/ma | 926 | 0,00 | 26 | 23,81 | ||||
| 2025-08-11 | 13F | HighTower Advisors, LLC | 16 640 | −4,14 | 475 | 9,95 | ||||
| 2025-08-05 | 13F | NewSquare Capital LLC | 151 | 788,24 | 4 | |||||
| 2025-08-14 | 13F | Mml Investors Services, Llc | 22 911 | 26,92 | 1 | |||||
| 2025-05-15 | 13F | Virtus Investment Advisers, Inc. | 0 | −100,00 | 0 | |||||
| 2025-07-16 | 13F | Signaturefd, Llc | 7 423 | 3,25 | 212 | 18,44 | ||||
| 2025-08-05 | 13F | Huntington National Bank | 2 355 | 219,54 | 67 | 272,22 | ||||
| 2025-08-14 | 13F | Engineers Gate Manager LP | 25 874 | 739 | ||||||
| 2025-08-07 | 13F | Zions Bancorporation, National Association /ut/ | 17 | 0,00 | 0 | |||||
| 2025-08-13 | 13F | Northern Trust Corp | 422 727 | 11,17 | 12 077 | 27,56 | ||||
| 2025-04-28 | 13F | DAVENPORT & Co LLC | 0 | −100,00 | 0 | |||||
| 2025-07-09 | 13F | Veracity Capital LLC | 14 684 | −59,31 | 420 | −53,34 | ||||
| 2025-08-12 | 13F | Clearbridge Investments, LLC | 9 624 | −1,06 | 275 | 13,22 | ||||
| 2025-07-15 | 13F | Signet Financial Management, Llc | 30 261 | 3,39 | 865 | 18,68 | ||||
| 2025-08-08 | 13F | SG Americas Securities, LLC | 10 150 | −0,02 | 0 | |||||
| 2025-08-12 | 13F | MAI Capital Management | 152 | 4 | ||||||
| 2025-07-11 | 13F | Farther Finance Advisors, LLC | 768 | 0,39 | 22 | 16,67 | ||||
| 2025-08-13 | 13F | New York State Common Retirement Fund | 6 573 | 0,00 | 0 | |||||
| 2025-08-14 | 13F | UBS Group AG | 79 151 | 13,73 | 2 261 | 30,54 | ||||
| 2025-08-14 | 13F | Raymond James Financial Inc | 277 995 | −3,39 | 7 942 | 10,86 | ||||
| 2025-07-08 | 13F | Parallel Advisors, LLC | 3 838 | 2,13 | 110 | 17,20 | ||||
| 2025-04-22 | 13F | Mendota Financial Group, LLC | 0 | −100,00 | 0 | |||||
| 2025-08-13 | 13F | Todd Asset Management Llc | 1 239 113 | 156,92 | 35 402 | 194,79 | ||||
| 2025-08-14 | 13F | Bank Of America Corp /de/ | 337 316 | 279,69 | 9 637 | 335,67 | ||||
| 2025-05-14 | 13F | Colonial Trust Advisors | 0 | −100,00 | 0 | −100,00 | ||||
| 2025-08-12 | 13F | Atlas Capital Advisors Llc | 22 604 | 1,60 | 646 | 16,43 | ||||
| 2025-07-30 | 13F | Forum Financial Management, LP | 8 946 | −17,86 | 256 | −5,90 | ||||
| 2025-07-30 | 13F | Arbor Investment Advisors, LLC | 8 850 | 0,00 | 253 | 14,55 | ||||
| 2025-08-14 | 13F | Susquehanna International Group, Llp | Put | 22 700 | 47,40 | 649 | 69,19 | |||
| 2025-08-04 | 13F | Assetmark, Inc | 31 148 | 248,65 | 890 | 300,45 | ||||
| 2025-08-14 | 13F | Susquehanna International Group, Llp | Call | 56 000 | 400,00 | 1 600 | 475,18 | |||
| 2025-07-29 | NP | NIAGX - Nia Impact Solutions Fund | 44 380 | 1 260 | ||||||
| 2025-07-22 | 13F | Valley National Advisers Inc | 3 066 | −6,38 | 0 | |||||
| 2025-08-14 | 13F | Wetherby Asset Management Inc | 9 134 | −8,03 | 261 | 16,07 | ||||
| 2025-07-14 | 13F | UMA Financial Services, Inc. | 194 | −16,38 | 6 | 0,00 | ||||
| 2025-08-12 | 13F | American Century Companies Inc | 29 173 | 21,32 | 833 | 39,30 | ||||
| 2025-08-14 | 13F | Two Sigma Investments, Lp | 20 642 | −16,81 | 590 | −4,54 | ||||
| 2025-07-16 | 13F | Arlington Capital Management, Inc. | 89 930 | 2 569 | ||||||
| 2025-07-28 | NP | AVSD - Avantis Responsible International Equity ETF | 2 751 | 0,00 | 78 | 18,18 | ||||
| 2025-04-29 | 13F | Callan Capital, LLC | 13 974 | 6,64 | 348 | 17,23 | ||||
| 2025-07-17 | 13F | Uncommon Cents Investing LLC | 40 065 | −1,46 | 1 145 | 13,04 | ||||
| 2025-06-30 | NP | VASVX - Vanguard Selected Value Fund Investor Shares | 2 975 541 | −9,44 | 75 519 | −7,59 | ||||
| 2025-08-11 | 13F | GW&K Investment Management, LLC | 70 | 0,00 | 0 | |||||
| 2025-05-06 | 13F | Venturi Wealth Management, LLC | 0 | −100,00 | 0 | |||||
| 2025-07-29 | NP | SGLIX - SGI Global Equity Fund Class I Shares | 29 748 | 845 | ||||||
| 2025-08-12 | 13F | Charles Schwab Investment Management Inc | 41 618 | 16,59 | 1 189 | 33,90 | ||||
| 2025-06-26 | NP | DFIEX - International Core Equity Portfolio - Institutional Class This fund is a listed as child fund of Dimensional Fund Advisors Lp and if that institution has disclosed ownership in this security, then these positions will not be double counted when calculating total shares and total value | 1 074 | 0,00 | 27 | 3,85 | ||||
| 2025-08-11 | 13F | Cornerstone Planning Group LLC | 82 | 17,14 | 2 | 100,00 | ||||
| 2025-08-12 | 13F | Summit Global Investments | 7 675 | −86,76 | 0 | −100,00 | ||||
| 2025-08-11 | 13F | TD Waterhouse Canada Inc. | 1 256 | 36 | ||||||
| 2025-07-29 | NP | GINX - SGI Enhanced Global Income ETF | 17 644 | 501 | ||||||
| 2025-08-14 | 13F | Wells Fargo & Company/mn | 54 555 | −16,93 | 1 559 | −4,71 | ||||
| 2025-08-13 | 13F/A | StoneX Group Inc. | 0 | −100,00 | 0 | −100,00 | ||||
| 2025-08-13 | 13F | Russell Investments Group, Ltd. | 5 096 | 21,33 | 146 | 39,42 | ||||
| 2025-07-31 | 13F | Hartford Financial Management Inc. | 1 837 | −10,83 | 52 | 1,96 | ||||
| 2025-08-06 | 13F | First Horizon Advisors, Inc. | 176 | 417,65 | 5 | |||||
| 2025-08-13 | 13F | First Trust Advisors Lp | 18 873 | 0,40 | 539 | 15,17 | ||||
| 2025-08-13 | 13F | Quadrant Capital Group Llc | 17 952 | −0,99 | 513 | 13,53 | ||||
| 2025-07-25 | 13F | Yousif Capital Management, Llc | 9 804 | 6,81 | 280 | 22,81 | ||||
| 2025-05-14 | 13F/A | Group One Trading, L.p. | Call | 0 | −100,00 | 0 | ||||
| 2025-07-25 | 13F | Lodestar Private Asset Management Llc | 13 932 | 0,00 | 398 | 15,03 | ||||
| 2025-07-16 | 13F | Brown, Lisle/cummings, Inc. | 419 | 0,00 | 12 | 10,00 | ||||
| 2025-07-23 | 13F | BankPlus Trust Department | 154 | 0,00 | 4 | 33,33 | ||||
| 2025-08-12 | 13F | Kimelman & Baird, LLC | 9 734 | 0,00 | 278 | 14,88 | ||||
| 2025-08-14 | 13F | Ameriprise Financial Inc | 67 703 | 10,54 | 1 934 | 27,24 | ||||
| 2025-08-05 | 13F | Simplex Trading, Llc | Put | 3 900 | 50,00 | 0 | ||||
| 2025-08-05 | 13F | Simplex Trading, Llc | Call | 3 400 | −88,36 | 0 | ||||
| 2025-07-21 | 13F | Credential Qtrade Securities Inc. | 0 | −100,00 | 0 | −100,00 | ||||
| 2025-08-12 | 13F | Wayfinding Financial, LLC | 0 | −100,00 | 0 | |||||
| 2025-04-22 | 13F | Castleview Partners, Llc | 0 | −100,00 | 0 | |||||
| 2025-08-26 | NP | AZBAX - AllianzGI Small-Cap Fund Class A | 11 033 | 0,00 | 315 | 14,96 | ||||
| 2025-08-13 | 13F | Cresset Asset Management, LLC | 11 706 | −24,15 | 334 | −13,02 | ||||
| 2025-08-14 | 13F | Harris Associates L P | 9 750 | −8,84 | 279 | 4,51 | ||||
| 2025-08-14 | 13F | Quantinno Capital Management LP | 182 222 | 2,87 | 5 206 | 18,05 | ||||
| 2025-08-14 | 13F | Fiduciary Management Inc /wi/ | 5 656 372 | −4,94 | 161 603 | 9,08 | ||||
| 2025-07-08 | 13F | Atwood & Palmer Inc | 100 | 0,00 | 3 | 0,00 | ||||
| 2025-08-08 | 13F | Crossmark Global Holdings, Inc. | 64 829 | −0,06 | 1 852 | 14,67 | ||||
| 2025-05-15 | 13F | Glenmede Trust Co Na | 20 864 | 5,30 | 520 | 15,85 | ||||
| 2025-07-11 | 13F | Pinnacle Bancorp, Inc. | 418 | 12 | ||||||
| 2025-07-16 | 13F | Meyer Handelman Co | 16 000 | 0,00 | 457 | 14,82 | ||||
| 2025-08-14 | 13F | Goldman Sachs Group Inc | 796 804 | 9,29 | 22 765 | 25,39 | ||||
| 2025-07-25 | 13F | Pzena Investment Management Llc | 14 662 982 | −4,64 | 418 921 | 9,41 | ||||
| 2025-07-07 | 13F | Northwest & Ethical Investments L.P. | 0 | −100,00 | 0 | −100,00 | ||||
| 2025-07-15 | 13F | Fifth Third Bancorp | 19 654 | 156,58 | 562 | 195,26 | ||||
| 2025-08-12 | 13F | Advisors Asset Management, Inc. | 18 528 | 137,02 | 529 | 172,68 | ||||
| 2025-08-13 | 13F | Natixis Advisors, L.p. | 72 124 | 462,33 | 2 | |||||
| 2025-08-14 | 13F | Syon Capital Llc | 12 360 | −9,44 | 353 | 4,13 | ||||
| 2025-07-24 | 13F | JNBA Financial Advisors | 301 | 0,00 | 9 | 14,29 | ||||
| 2025-08-08 | 13F | Creative Planning | 53 073 | 6,08 | 1 516 | 21,77 | ||||
| 2025-07-01 | 13F | Cacti Asset Management Llc | 6 000 | 0,00 | 169 | 14,19 | ||||
| 2025-07-29 | 13F | Mb, Levis & Associates, Llc | 478 | 0,00 | 14 | 18,18 | ||||
| 2025-07-17 | 13F | Halbert Hargrove Global Advisors, Llc | 0 | −100,00 | 0 | |||||
| 2025-08-12 | 13F | Proequities, Inc. | Put | 0 | 0 | |||||
| 2025-08-12 | 13F | Proequities, Inc. | Call | 0 | 0 | |||||
| 2025-08-12 | 13F | Proequities, Inc. | 0 | 0 | ||||||
| 2025-08-12 | 13F | Global Retirement Partners, LLC | 3 293 | 94 | ||||||
| 2025-08-01 | 13F | Koss-Olinger Consulting, LLC | 14 509 | −3,27 | 415 | 10,70 | ||||
| 2025-08-04 | 13F | Spire Wealth Management | 0 | −100,00 | 0 | |||||
| 2025-08-13 | 13F | Townsquare Capital Llc | 0 | −100,00 | 0 | |||||
| 2025-06-09 | NP | Bmc Fund Inc | 8 420 | −49,88 | 214 | −48,92 | ||||
| 2025-08-12 | 13F | Clear Street Markets Llc | 0 | −100,00 | 0 | |||||
| 2025-08-11 | 13F | Citigroup Inc | 93 747 | 7 824,51 | 2 678 | 9 134,48 | ||||
| 2025-08-12 | 13F | Dimensional Fund Advisors Lp | 23 861 | 1,18 | 682 | 16,01 | ||||
| 2025-08-13 | 13F | Twin Peaks Wealth Advisors, LLC | 148 | 4 | ||||||
| 2025-06-30 | NP | VWNDX - Vanguard Windsor Fund Investor Shares | 8 204 589 | 0,00 | 208 232 | 2,05 | ||||
| 2025-08-14 | 13F | Two Sigma Advisers, Lp | 20 600 | −49,01 | 589 | −41,49 | ||||
| 2025-08-06 | 13F | True Wealth Design, LLC | 35 | 0,00 | 1 | |||||
| 2025-08-13 | 13F | Northwestern Mutual Wealth Management Co | 1 661 | −21,61 | 47 | −9,62 | ||||
| 2025-07-07 | 13F | Investors Research Corp | 21 | 0,00 | 1 | |||||
| 2025-08-12 | 13F | O'shaughnessy Asset Management, Llc | 35 524 | 10,12 | 1 015 | 26,28 | ||||
| 2025-06-26 | NP | PZFVX - Classic Value Fund Class A | 1 016 962 | −12,57 | 25 810 | −10,78 | ||||
| 2025-08-13 | 13F | Bare Financial Services, Inc | 34 | 0,00 | 1 | |||||
| 2025-08-12 | 13F | BlackRock, Inc. | 445 366 | 6,39 | 12 724 | 22,08 | ||||
| 2025-08-14 | 13F | CoreCap Advisors, LLC | 0 | −100,00 | 0 | |||||
| 2025-08-19 | 13F | Cape Investment Advisory, Inc. | 328 | 37,82 | 9 | 80,00 | ||||
| 2025-08-14 | 13F | Millennium Management Llc | 308 390 | −71,54 | 8 811 | −67,35 | ||||
| 2025-08-12 | 13F | Franklin Resources Inc | 75 034 | 3,82 | 2 144 | 19,12 | ||||
| 2025-08-14 | 13F | Mariner, LLC | 48 010 | 2,27 | 1 372 | 17,38 | ||||
| 2025-07-09 | 13F | Bruce G. Allen Investments, LLC | 1 583 | 2,06 | 45 | 18,42 | ||||
| 2025-08-14 | 13F | Old Mission Capital Llc | 0 | −100,00 | 0 | |||||
| 2025-08-11 | 13F | One Capital Management, LLC | 10 482 | 0,00 | 299 | 14,56 | ||||
| 2025-08-25 | 13F/A | Neuberger Berman Group LLC | 9 809 | 2,76 | 280 | 18,14 | ||||
| 2025-04-09 | 13F | Legacy Wealth Asset Management, LLC | 0 | −100,00 | 0 | |||||
| 2025-07-16 | 13F | ORG Wealth Partners, LLC | 1 676 | −56,02 | 48 | −48,94 | ||||
| 2025-07-24 | 13F | Callan Family Office, LLC | 29 877 | 50,15 | 854 | 72,32 | ||||
| 2025-08-07 | 13F | Kestra Private Wealth Services, Llc | 11 685 | 1,74 | 334 | 16,84 | ||||
| 2025-08-08 | 13F | Pnc Financial Services Group, Inc. | 10 161 | 11,75 | 290 | 28,32 | ||||
| 2025-06-26 | NP | CVAR - Cultivar ETF | 16 505 | 0,73 | 419 | 2,70 | ||||
| 2025-08-14 | 13F | Nia Impact Advisors, Llc | 122 198 | −0,10 | 3 491 | 14,65 | ||||
| 2025-07-29 | 13F | Salomon & Ludwin, LLC | 5 | 0 | ||||||
| 2025-08-12 | 13F | Rhumbline Advisers | 16 233 | −0,73 | 464 | 13,76 | ||||
| 2025-08-08 | 13F | SBI Securities Co., Ltd. | 317 | 4 428,57 | 9 | |||||
| 2025-08-13 | 13F | Trustmark National Bank Trust Department | 35 963 | 1 027 | ||||||
| 2025-08-06 | 13F | Paradigm Asset Management Co Llc | 1 800 | 0,00 | 51 | 15,91 | ||||
| 2025-08-11 | 13F | Principal Securities, Inc. | 2 267 | 105,34 | 65 | 166,67 | ||||
| 2025-07-25 | 13F | PrairieView Partners, LLC | 418 | 0,00 | 0 | |||||
| 2025-08-12 | 13F | Manchester Capital Management LLC | 18 | 1 | ||||||
| 2025-08-06 | 13F | SOUTH STATE Corp | 31 | 1 | ||||||
| 2025-08-14 | 13F | GWM Advisors LLC | 206 | 1,98 | 6 | 0,00 | ||||
| 2025-07-28 | 13F | Moran Wealth Management, LLC | 149 551 | 1,38 | 4 273 | 16,31 | ||||
| 2025-08-14 | 13F | Citadel Advisors Llc | Call | 0 | −100,00 | 0 | ||||
| 2025-07-11 | 13F/A | Umb Bank N A/mo | 150 | 0,00 | 4 | 33,33 | ||||
| 2025-06-26 | NP | HFCGX - Hennessy Cornerstone Growth Fund Investor Class | 300 400 | 7 624 | ||||||
| 2025-08-04 | 13F | Hantz Financial Services, Inc. | 2 079 | 568,49 | 0 | |||||
| 2025-08-15 | 13F | Tower Research Capital LLC (TRC) | 62 815 | 616,49 | 1 795 | 722,94 | ||||
| 2025-08-07 | 13F | Sierra Ocean, Llc | 312 | 2,30 | 9 | 14,29 | ||||
| 2025-08-14 | 13F | Lazard Asset Management Llc | 0 | −100,00 | 0 | |||||
| 2025-08-14 | 13F | Glen Eagle Advisors, LLC | 109 | 1,87 | 3 | 50,00 | ||||
| 2025-08-06 | 13F | Commonwealth Equity Services, Llc | 12 364 | −7,46 | 0 | |||||
| 2025-08-27 | NP | Liberty All Star Equity Fund | 1 139 792 | −0,74 | 32 564 | 13,89 | ||||
| 2025-08-08 | 13F | Everett Harris & Co /ca/ | 13 259 | 0,00 | 379 | 14,55 | ||||
| 2025-07-25 | 13F | Stephens Consulting, LLC | 31 | 1 | ||||||
| 2025-07-30 | 13F | Bogart Wealth, LLC | 1 | 0,00 | 0 | |||||
| 2025-08-14 | 13F | Barometer Capital Management Inc. | 18 300 | 523 | ||||||
| 2025-08-12 | 13F | Nuveen, LLC | 38 564 | −31,12 | 1 102 | −21,02 | ||||
| 2025-08-14 | 13F | Toroso Investments, LLC | 11 078 | −32,94 | 316 | −23,11 | ||||
| 2025-08-14 | 13F | Evergreen Capital Management Llc | 8 151 | −4,73 | 233 | 8,92 | ||||
| 2025-09-04 | 13F/A | Advisor Group Holdings, Inc. | 14 351 | 635,95 | 410 | 752,08 | ||||
| 2025-08-14 | 13F | Fmr Llc | 143 412 | 1,94 | 4 097 | 16,96 | ||||
| 2025-07-28 | NP | AVDEX - Avantis International Equity Fund Institutional Class This fund is a listed as child fund of American Century Companies Inc and if that institution has disclosed ownership in this security, then these positions will not be double counted when calculating total shares and total value | 1 743 | 0,00 | 50 | 16,67 | ||||
| 2025-08-11 | 13F | Dorsey & Whitney Trust CO LLC | 7 789 | 223 | ||||||
| 2025-08-14 | 13F | Broyhill Asset Management | 60 952 | −58,69 | 1 741 | −52,60 | ||||
| 2025-08-14 | 13F | Jane Street Group, Llc | 18 362 | 525 | ||||||
| 2025-08-14 | 13F | Point72 Asset Management, L.P. | 0 | −100,00 | 0 | |||||
| 2025-07-21 | 13F | Franklin Street Advisors Inc /nc | 8 896 | 0,00 | 0 | |||||
| 2025-08-12 | 13F | Wulff, Hansen & Co. | 0 | −100,00 | 0 | |||||
| 2025-08-13 | 13F | Jones Financial Companies Lllp | 9 958 | 3,00 | 281 | 17,15 | ||||
| 2025-08-14 | 13F | Summit Trail Advisors, Llc | 12 468 | 356 | ||||||
| 2025-08-14 | 13F | Sei Investments Co | 12 592 | 26,91 | 360 | 45,34 | ||||
| 2025-08-14 | 13F | Mercer Global Advisors Inc /adv | 21 156 | 47,93 | 604 | 69,66 | ||||
| 2025-08-06 | 13F | Fox Run Management, L.l.c. | 0 | −100,00 | 0 | |||||
| 2025-08-08 | 13F | Larson Financial Group LLC | 31 | 0,00 | 1 | |||||
| 2025-08-13 | 13F | Marshall Wace, Llp | 10 074 | −50,57 | 288 | −43,39 | ||||
| 2025-08-12 | 13F | AlphaCore Capital LLC | 2 544 | 73 | ||||||
| 2025-08-13 | 13F | Cerity Partners LLC | 41 126 | 3,06 | 1 175 | 18,23 | ||||
| 2025-08-07 | 13F | Midwest Trust Co | 9 861 | 282 | ||||||
| 2025-04-28 | 13F | Fedenia Advisers LLC | 0 | −100,00 | 0 | |||||
| 2025-08-12 | 13F | Coldstream Capital Management Inc | 0 | −100,00 | 0 | |||||
| 2025-07-31 | 13F | Glass Jacobson Investment Advisors llc | 0 | −100,00 | 0 | |||||
| 2025-07-21 | 13F | Hennessy Advisors Inc | 401 800 | 11 479 | ||||||
| 2025-08-14 | 13F | Glenmede Investment Management, LP | 20 811 | 595 | ||||||
| 2025-07-29 | 13F | Commons Capital, Llc | 8 895 | 0,00 | 254 | 14,93 | ||||
| 2025-08-14 | 13F | Vident Advisory, LLC | 34 355 | −36,70 | 982 | −27,39 | ||||
| 2025-07-28 | NP | AVDE - Avantis International Equity ETF This fund is a listed as child fund of American Century Companies Inc and if that institution has disclosed ownership in this security, then these positions will not be double counted when calculating total shares and total value | 24 285 | 26,76 | 690 | 48,81 | ||||
| 2025-07-15 | 13F | Td Private Client Wealth Llc | 4 925 | 6 380,26 | 141 | 13 900,00 | ||||
| 2025-08-11 | 13F | Rothschild Investment Llc | 640 | 4,75 | 18 | 20,00 | ||||
| 2025-08-01 | 13F | Envestnet Asset Management Inc | 373 961 | 26,76 | 10 684 | 45,46 | ||||
| 2025-08-14 | 13F | Bnp Paribas Arbitrage, Sa | 32 117 | 133 720,83 | 918 | |||||
| 2025-08-07 | 13F | Teachers Retirement System Of The State Of Kentucky | 753 500 | 152,85 | 22 | 200,00 | ||||
| 2025-06-26 | NP | FSGEX - Fidelity Series Global ex U.S. Index Fund This fund is a listed as child fund of Fmr Llc and if that institution has disclosed ownership in this security, then these positions will not be double counted when calculating total shares and total value | 73 378 | −19,14 | 1 862 | −17,46 | ||||
| 2025-07-15 | 13F | Mather Group, Llc. | 0 | −100,00 | 0 | |||||
| 2025-08-13 | 13F | Guggenheim Capital Llc | 22 651 | 30,44 | 647 | 49,77 | ||||
| 2025-07-30 | NP | APIE - ActivePassive International Equity ETF | 58 899 | 4,89 | 1 673 | 23,03 | ||||
| 2025-07-21 | 13F | Credential Securities Inc. | 10 456 | −6,94 | 526 | −8,20 | ||||
| 2025-08-14 | 13F | RBF Capital, LLC | 8 100 | 0,00 | 231 | 14,93 | ||||
| 2025-08-14 | 13F | Integral Health Asset Management, LLC | 750 000 | 10,29 | 21 428 | 26,55 | ||||
| 2025-08-07 | 13F | Parkside Financial Bank & Trust | 81 | 22,73 | 2 | 100,00 | ||||
| 2025-07-21 | 13F | Qrg Capital Management, Inc. | 81 574 | 14,42 | 2 331 | 31,27 | ||||
| 2025-07-30 | NP | ENDW - Cambria Endowment Style ETF | 8 | 0 | ||||||
| 2025-08-07 | 13F | Acadian Asset Management Llc | 1 746 | 0 | ||||||
| 2025-08-11 | 13F | Traub Capital Management LLC | 22 | 1 | ||||||
| 2025-07-31 | 13F | CVA Family Office, LLC | 67 | −34,95 | 2 | −50,00 | ||||
| 2025-07-29 | 13F | TrueMark Investments, LLC | 0 | −100,00 | 0 | |||||
| 2025-08-12 | 13F | Steward Partners Investment Advisory, Llc | 222 | −41,27 | 6 | −33,33 | ||||
| 2025-08-12 | 13F | CIBC Private Wealth Group, LLC | 277 | −76,41 | 8 | −73,08 | ||||
| 2025-07-14 | 13F | Park Avenue Securities Llc | 8 976 | 0 | ||||||
| 2025-07-30 | NP | PZVMX - Pzena Mid Cap Value Fund Investor Class | 147 696 | −14,65 | 4 195 | 0,12 | ||||
| 2025-08-11 | 13F | United Capital Financial Advisers, Llc | 8 308 | 237 | ||||||
| 2025-08-04 | 13F | Creative Financial Designs Inc /adv | 28 | −56,25 | 1 | −100,00 | ||||
| 2025-08-14 | 13F/A | Skopos Labs, Inc. | 4 072 | 216,89 | 116 | 274,19 | ||||
| 2025-08-07 | 13F | Searle & Co. | 23 288 | 0,00 | 665 | 14,85 | ||||
| 2025-08-12 | 13F | LPL Financial LLC | 33 780 | 965 | ||||||
| 2025-08-07 | 13F | Allworth Financial LP | 1 498 | 4,61 | 43 | 23,53 | ||||
| 2025-05-14 | 13F | CI Private Wealth, LLC | 0 | −100,00 | 0 | −100,00 | ||||
| 2025-07-22 | 13F | Highland Capital Management, Llc | 39 100 | −2,62 | 1 117 | 11,81 | ||||
| 2025-07-24 | 13F | Eastern Bank | 209 | 0,00 | 6 | 0,00 | ||||
| 2025-08-14 | 13F | Verition Fund Management LLC | 11 927 | 341 | ||||||
| 2025-08-15 | 13F | WealthCollab, LLC | 219 | 0,00 | 6 | 20,00 | ||||
| 2025-08-13 | 13F | Dodge & Cox | 3 826 910 | −8,30 | 109 335 | 5,21 | ||||
| 2025-08-14 | 13F | Citadel Advisors Llc | 62 533 | 1 042 116,67 | 1 787 | |||||
| 2025-08-14 | 13F | Citadel Advisors Llc | Put | 15 000 | −55,88 | 429 | −49,41 | |||
| 2025-05-12 | 13F | Sandy Spring Bank | 1 500 | 0,00 | 37 | 12,12 | ||||
| 2025-08-13 | 13F | Centiva Capital, LP | 0 | −100,00 | 0 | |||||
| 2025-08-13 | 13F | Arrowstreet Capital, Limited Partnership | 0 | −100,00 | 0 | |||||
| 2025-08-01 | 13F | Bessemer Group Inc | 18 | 0,00 | 0 | |||||
| 2025-08-11 | 13F | CBIZ Investment Advisory Services, LLC | 556 | 0,00 | 16 | 15,38 | ||||
| 2025-08-01 | 13F | Centerpoint Advisors, LLC | 944 | 0,00 | 0 | |||||
| 2025-07-16 | 13F | Highline Wealth Partners Llc | 85 | 0,00 | 2 | 0,00 | ||||
| 2025-08-14 | 13F | Principia Wealth Advisory, LLC | 6 | 0 | ||||||
| 2025-08-14 | 13F | Optiver Holding B.V. | 50 045 | −22,61 | 1 430 | −11,24 | ||||
| 2025-08-14 | 13F | Optiver Holding B.V. | Call | 100 | −99,12 | 3 | −99,29 | |||
| 2025-08-14 | 13F | Optiver Holding B.V. | Put | 100 | 3 | |||||
| 2025-07-24 | 13F | Jfs Wealth Advisors, Llc | 188 | 0,00 | 5 | 25,00 | ||||
| 2025-08-14 | 13F | Corient IA LLC | 25 000 | 0,00 | 714 | 14,79 | ||||
| 2025-05-12 | 13F | Simplex Trading, Llc | 0 | −100,00 | 0 | |||||
| 2025-07-29 | 13F | Private Trust Co Na | 328 | 290,48 | 9 | 350,00 | ||||
| 2025-08-01 | 13F | Riverwater Partners LLC | 15 306 | 0,00 | 437 | 14,70 | ||||
| 2025-08-15 | NP | FMIHX - Large Cap Fund Investor Class | 1 475 000 | −3,28 | 42 141 | 10,98 | ||||
| 2025-08-05 | 13F | Bank of New York Mellon Corp | 21 567 | −2,28 | 616 | 12,20 | ||||
| 2025-07-28 | 13F | Ritholtz Wealth Management | 18 941 | 1,27 | 541 | 16,34 | ||||
| 2025-08-13 | 13F | Barclays Plc | 0 | −100,00 | 0 | |||||
| 2025-08-14 | 13F | Aqr Capital Management Llc | 27 024 | 89,02 | 772 | 116,85 | ||||
| 2025-05-05 | 13F | Lindbrook Capital, Llc | 1 114 | −2,45 | 28 | 8,00 | ||||
| 2025-08-12 | 13F | Jpmorgan Chase & Co | 37 610 | 160,33 | 1 075 | 199,16 | ||||
| 2025-05-15 | 13F | Mork Capital Management, LLC | 0 | −100,00 | 0 | |||||
| 2025-07-28 | 13F | BRYN MAWR TRUST Co | 2 097 | 0,00 | 60 | 13,46 | ||||
| 2025-08-11 | 13F | Bell Investment Advisors, Inc | 30 | 0,00 | 1 | |||||
| 2025-08-05 | 13F | GHP Investment Advisors, Inc. | 2 140 | 0,00 | 61 | 15,09 | ||||
| 2025-08-14 | 13F | Qube Research & Technologies Ltd | 199 563 | 175,30 | 5 702 | 215,84 | ||||
| 2025-07-14 | 13F | GAMMA Investing LLC | 9 852 | 2,59 | 281 | 17,57 | ||||
| 2025-07-22 | 13F | Autumn Glory Partners, LLC | 11 198 | 21,74 | 591 | 157,64 | ||||
| 2025-08-11 | 13F | Annis Gardner Whiting Capital Advisors, LLC | 64 | 2 | ||||||
| 2025-08-14 | 13F | Susquehanna International Group, Llp | 0 | −100,00 | 0 | |||||
| 2025-07-30 | 13F | Ethic Inc. | 52 497 | 2,77 | 1 481 | 17,18 | ||||
| 2025-06-26 | NP | SNTKX - Steward International Enhanced Index Fund Class A | 36 535 | 0,00 | 927 | 2,09 | ||||
| 2025-08-06 | 13F | Atlantic Union Bankshares Corp | 1 500 | 43 | ||||||
| 2025-07-14 | 13F | Abound Wealth Management | 6 | −14,29 | 0 | |||||
| 2025-05-15 | 13F | Squarepoint Ops LLC | 0 | −100,00 | 0 | |||||
| 2025-07-25 | 13F | Cwm, Llc | 1 184 | −9,96 | 0 | |||||
| 2025-08-15 | 13F | Morgan Stanley | 2 369 089 | 125,48 | 67 685 | 158,71 | ||||
| 2025-08-28 | NP | DODBX - Dodge & Cox Balanced Fund | 3 826 910 | −8,30 | 109 335 | 5,21 | ||||
| 2025-07-24 | 13F | Ronald Blue Trust, Inc. | 6 185 | 55,83 | 177 | 79,59 | ||||
| 2025-08-07 | 13F | Campbell & CO Investment Adviser LLC | 0 | −100,00 | 0 | |||||
| 2025-08-12 | 13F | Pathstone Holdings, LLC | 66 204 | −0,61 | 1 891 | 14,05 | ||||
| 2025-08-08 | 13F | Abc Arbitrage Sa | 229 375 | 18,20 | 6 553 | 35,62 | ||||
| 2025-08-18 | 13F/A | National Bank Of Canada /fi/ | 34 954 | 12,29 | 999 | 28,94 | ||||
| 2025-08-13 | 13F | EverSource Wealth Advisors, LLC | 2 906 | 141,76 | 83 | 186,21 | ||||
| 2025-07-18 | 13F | Truist Financial Corp | 7 501 | 214 | ||||||
| 2025-08-08 | 13F | Geode Capital Management, Llc | 57 905 | −21,09 | 1 654 | −9,47 | ||||
| 2025-07-21 | 13F | Cromwell Holdings LLC | 2 275 | 0,00 | 65 | 14,29 | ||||
| 2025-07-09 | 13F | VisionPoint Advisory Group, LLC | 52 578 | −54,72 | 1 502 | −48,05 | ||||
| 2025-08-12 | 13F | XTX Topco Ltd | 20 563 | 587 | ||||||
| 2025-07-07 | 13F | Versant Capital Management, Inc | 8 951 | 34,64 | 256 | 54,55 | ||||
| 2025-07-25 | 13F | JustInvest LLC | 38 942 | 14,07 | 1 113 | 30,82 | ||||
| 2025-08-14 | 13F | Smartleaf Asset Management LLC | 1 074 | −9,67 | 30 | 3,45 | ||||
| 2025-08-18 | 13F | Geneos Wealth Management Inc. | 345 | −7,01 | 10 | 0,00 | ||||
| 2025-08-14 | 13F | Royal Bank Of Canada | 55 671 | 94,25 | 1 590 | 122,69 |
Other Listings
| DE:FMEA | € 21,00 |