Grunnleggende statistikk
| Institusjonelle eiere | 338 total, 338 long only, 0 short only, 0 long/short - change of −2,58% MRQ |
| Gjennomsnittlig porteføljeallokering | 0.1838 % - change of −24,03% MRQ |
| Institusjonelle aksjer (Long) | 14 602 967 (ex 13D/G) - change of −0,73MM shares −4,74% MRQ |
| Institusjonell verdi (Long) | $ 882 493 USD ($1000) |
Institusjonelt eierskap og aksjonærer
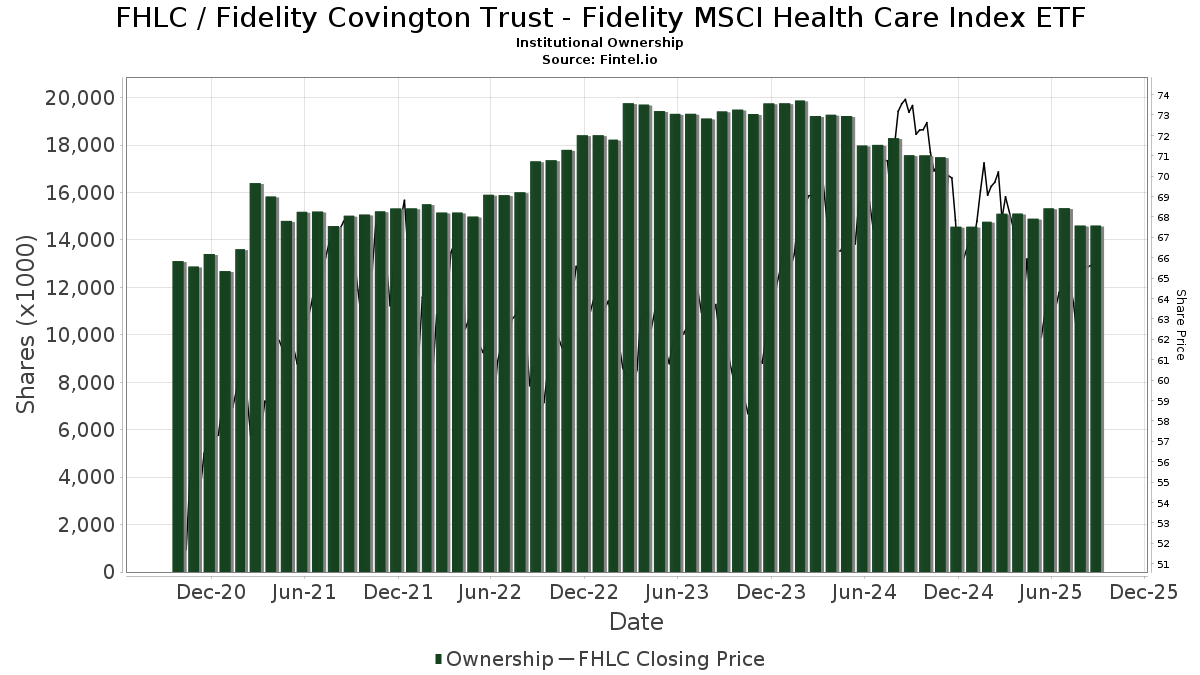
Fidelity Covington Trust - Fidelity MSCI Health Care Index ETF (US:FHLC) har 338 institusjonelle eiere og aksjonærer som har sendt inn 13D/G- eller 13F-skjemaer til Securities Exchange Commission (SEC). Disse institusjonene eier til sammen 14,602,967 aksjer. De største aksjonærene inkluderer Lido Advisors, LLC, Charles Schwab Investment Management Inc, Agf Management Ltd, LPL Financial LLC, Commonwealth Equity Services, Llc, Morgan Stanley, Raymond James Financial Inc, Kestra Advisory Services, LLC, Weatherly Asset Management L. P., and McGlone Suttner Wealth Management, Inc. .
Fidelity Covington Trust - Fidelity MSCI Health Care Index ETF (ARCA:FHLC) institusjonell eierstruktur viser nåværende posisjoner i selskapet fordelt på institusjoner og fond, samt de siste endringene i posisjonsstørrelse. De største aksjonærene kan være individuelle investorer, verdipapirfond, hedgefond eller institusjoner. Schedule 13D indikerer at investoren eier (eller har eid) mer enn 5 % av selskapet og har til hensikt (eller hadde til hensikt) å aktivt forfølge en endring i forretningsstrategien. Schedule 13G indikerer en passiv investering på over 5 %.
The share price as of September 9, 2025 is 66,50 / share. Previously, on September 10, 2024, the share price was 73,36 / share. This represents a decline of 9,35% over that period.
Fondssentiment-score
Fondssentiment Score (også kjent som akkumulering av eierskap poengsum) viser hvilke aksjer som er mest kjøpt av fond. Den er resultatet av en sofistikert, kvantitativ flerfaktormodell som identifiserer selskaper med de høyeste nivåene av institusjonell akkumulering. Beregningsmodellen for poeng bruker en kombinasjon av den totale økningen i antall offentliggjorte eiere, endringer i porteføljeallokeringen til disse eierne og andre beregninger. Tallet går fra 0 til 100, der høyere tall indikerer en høyere grad av akkumulering i forhold til sammenlignbare selskaper, der 50 er gjennomsnittet.
Oppdateringsfrekvens: Daglig
Sjekk ut Ownership Explorer, som inneholder en liste over de høyest rangerte selskapene.
Institusjonell Put/Call-forhold
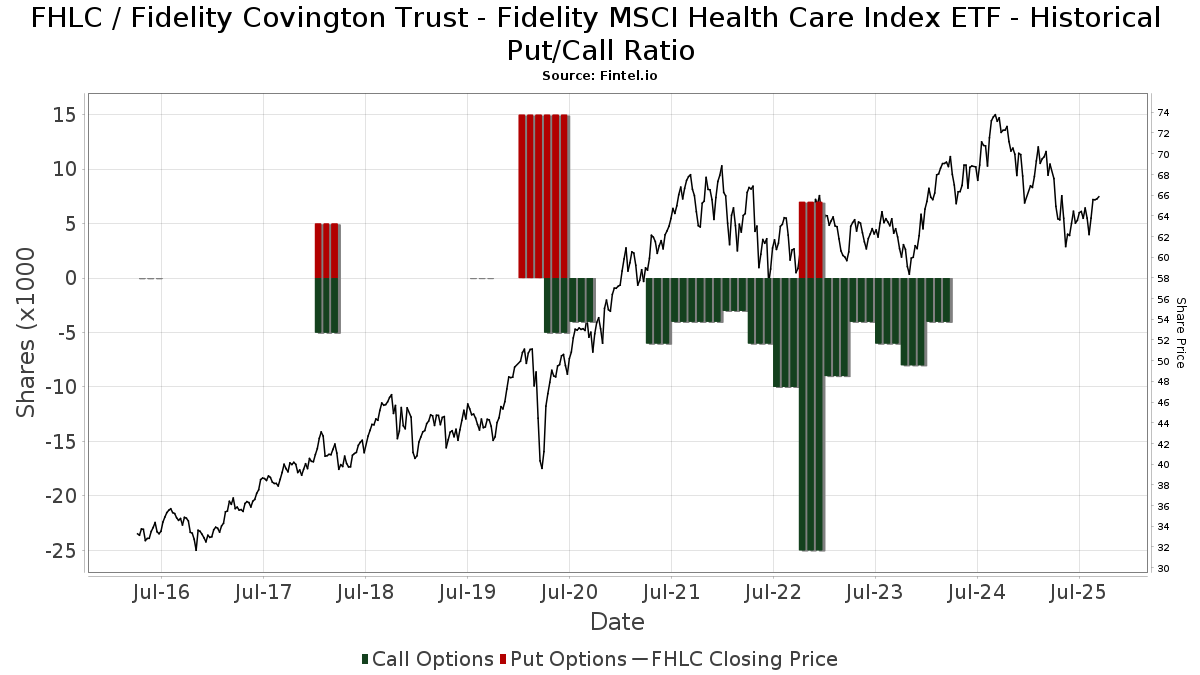
I tillegg til å rapportere standard aksje- og gjeldsemisjoner må institusjoner med mer enn 100 millioner kroner i forvaltningskapital også oppgi beholdningen av put- og callopsjoner. Siden put-opsjoner generelt indikerer et negativt sentiment, og call-opsjoner indikerer et positivt sentiment, kan vi få et inntrykk av det generelle institusjonelle sentimentet ved å plotte forholdet mellom put- og call-opsjoner. Diagrammet til høyre viser det historiske forholdet mellom put- og call-opsjoner for dette instrumentet.
Ved å bruke Put/Call-forholdet som en indikator på investorsentimentet kan man overvinne en av de viktigste svakhetene ved å bruke totalt institusjonelt eierskap, nemlig at en betydelig andel av forvaltningskapitalen investeres passivt for å følge indekser. Passivt forvaltede fond kjøper vanligvis ikke opsjoner, slik at indikatoren for put/call-forhold i større grad gjenspeiler stemningen i aktivt forvaltede fond.
13F- og NPORT-arkiveringer
Detaljer om 13F-arkiveringer er gratis. Detaljer om NP-arkiveringer krever et premium-medlemskap. Grønne rader indikerer nye posisjoner. Røde rader indikerer lukkede posisjoner. Klikk på lenke ikonet for å se hele transaksjonshistorikken.
Oppgrader
for å låse opp premiedata og eksportere til Excel. ![]() .
.
| Fildato | Kilde | Investor | Type | Gjennomsnittlig pris (estimert) |
Aksjer | Δ Aksjer (%) |
Rapportert verdi ($1000) | Verdi (%) | Portallokering (%) | |
|---|---|---|---|---|---|---|---|---|---|---|
| 2025-07-22 | 13F | Partners Wealth Management, Llc | 14 869 | 0,00 | 997 | −1,77 | ||||
| 2025-08-14 | 13F | Full Sail Capital, LLC | 231 789 | 0,94 | 14 823 | −5,52 | ||||
| 2025-08-06 | 13F | Founders Financial Securities Llc | 4 904 | −8,01 | 314 | −9,54 | ||||
| 2025-08-29 | 13F | Centaurus Financial, Inc. | 2 024 | 20,98 | 0 | |||||
| 2025-08-14 | 13F | Cubist Systematic Strategies, LLC | 3 444 | 220 | ||||||
| 2025-08-04 | 13F | Creative Financial Designs Inc /adv | 600 | 0,00 | 38 | −5,00 | ||||
| 2025-08-13 | 13F | Continuum Advisory, LLC | 0 | −100,00 | 0 | |||||
| 2025-08-12 | 13F | Integrated Advisors Network LLC | 23 753 | −14,37 | 1 519 | −19,84 | ||||
| 2025-07-07 | 13F | Investors Research Corp | 194 871 | 9,69 | 12 462 | 2,68 | ||||
| 2025-08-08 | 13F | Capital Investment Advisory Services, LLC | 419 | 0,00 | 27 | −7,14 | ||||
| 2025-08-07 | 13F | Kestra Private Wealth Services, Llc | 27 445 | 2,18 | 1 755 | −4,36 | ||||
| 2025-08-14 | 13F | Two Sigma Securities, Llc | 0 | −100,00 | 0 | |||||
| 2025-08-14 | 13F | Stifel Financial Corp | 92 210 | −2,69 | 5 897 | −8,91 | ||||
| 2025-07-10 | 13F | Capital Advisory Group Advisory Services, LLC | 51 021 | 0,27 | 3 263 | −6,16 | ||||
| 2025-08-01 | 13F | Envestnet Asset Management Inc | 114 849 | −29,69 | 7 345 | −34,19 | ||||
| 2025-08-04 | 13F | Spinnaker Trust | 86 059 | 5,82 | 5 503 | −0,95 | ||||
| 2025-08-14 | 13F | Fmr Llc | 92 240 | −5,61 | 5 899 | −11,65 | ||||
| 2025-04-23 | 13F | Mascagni Wealth Management, Inc. | 0 | −100,00 | 0 | −100,00 | ||||
| 2025-07-21 | 13F | Ameritas Advisory Services, LLC | 26 168 | −8,28 | 1 673 | −10,49 | ||||
| 2025-07-16 | 13F | West Branch Capital LLC | 1 | 0,00 | 0 | |||||
| 2025-08-14 | 13F | Susquehanna International Group, Llp | 10 602 | 11,35 | 678 | 4,15 | ||||
| 2025-07-02 | 13F | Crumly & Associates Inc. | 10 087 | 10,06 | 645 | 3,04 | ||||
| 2025-08-15 | 13F | Captrust Financial Advisors | 3 943 | 252 | ||||||
| 2025-08-07 | 13F | Panoramic Investment Advisors, Llc | 3 314 | −9,72 | 212 | −15,60 | ||||
| 2025-08-18 | 13F | Geneos Wealth Management Inc. | 4 022 | −1,73 | 257 | −7,89 | ||||
| 2025-08-11 | 13F | Regal Investment Advisors LLC | 4 150 | 0,00 | 265 | −6,36 | ||||
| 2025-07-21 | 13F | Quent Capital, LLC | 0 | −100,00 | 0 | |||||
| 2025-08-12 | 13F | Proequities, Inc. | 0 | 0 | ||||||
| 2025-08-12 | 13F | Global Retirement Partners, LLC | 912 | 43,85 | 58 | 41,46 | ||||
| 2025-08-13 | 13F | Per Stirling Capital Management, LLC. | 4 320 | −3,33 | 276 | −9,51 | ||||
| 2025-07-16 | 13F | Fischer Financial Services, Inc. | 167 265 | 0,74 | 10 696 | −5,70 | ||||
| 2025-07-18 | 13F | Founders Capital Management | 5 | 0,00 | 0 | |||||
| 2025-08-06 | 13F | Aspetuck Financial Management LLC | 26 434 | 3,54 | 1 690 | −3,10 | ||||
| 2025-07-21 | 13F | Stock Yards Bank & Trust Co | 21 351 | 1 365 | ||||||
| 2025-08-14 | 13F | EP Wealth Advisors, Inc. | 3 555 | 25,18 | 227 | 17,01 | ||||
| 2025-07-24 | 13F | Ronald Blue Trust, Inc. | 200 | 0,00 | 13 | −7,69 | ||||
| 2025-08-11 | 13F | Greykasell Wealth Strategies, Inc. | 1 004 | 64 | ||||||
| 2025-07-30 | 13F | Rehmann Capital Advisory Group | 0 | −100,00 | 0 | |||||
| 2025-07-17 | 13F | Montis Financial, LLC | 0 | −100,00 | 0 | |||||
| 2025-08-04 | 13F | Mesirow Financial Investment Management, Inc. | 3 133 | −34,29 | 200 | −38,46 | ||||
| 2025-05-05 | 13F | Lindbrook Capital, Llc | 20 | 0,00 | 1 | 0,00 | ||||
| 2025-04-10 | 13F | Sugar Maple Asset Management, LLC | 0 | −100,00 | 0 | |||||
| 2025-07-16 | 13F | Southern Capital Advisors, Llc | 8 958 | 0,40 | 573 | −6,08 | ||||
| 2025-08-12 | 13F | Steward Partners Investment Advisory, Llc | 75 591 | 6,65 | 4 834 | −0,17 | ||||
| 2025-07-30 | 13F | Brookstone Capital Management | 3 616 | 5,24 | 231 | −1,28 | ||||
| 2025-08-06 | 13F | Soltis Investment Advisors LLC | 4 407 | −4,55 | 282 | −10,79 | ||||
| 2025-08-14 | 13F | GWM Advisors LLC | 102 371 | 7,03 | 6 547 | 0,18 | ||||
| 2025-07-22 | 13F | Signature Wealth Management Partners, LLC | 14 357 | −8,66 | 918 | −14,45 | ||||
| 2025-07-31 | 13F | Moser Wealth Advisors, LLC | 77 | 5 | ||||||
| 2025-07-24 | 13F | Tandem Capital Management Corp /adv | 12 532 | 0,00 | 801 | −6,43 | ||||
| 2025-07-16 | 13F | Signature Resources Capital Management, LLC | 642 | 41 | ||||||
| 2025-07-30 | 13F | Gables Capital Management Inc. | 465 | 0,00 | 30 | −6,45 | ||||
| 2025-08-11 | 13F | FSA Wealth Management LLC | 530 | 0,38 | 34 | −8,33 | ||||
| 2025-08-13 | 13F | River Wealth Advisors LLC | 4 617 | −3,81 | 295 | −9,79 | ||||
| 2025-07-08 | 13F | Arlington Trust Co LLC | 1 400 | 0,00 | 90 | −6,32 | ||||
| 2025-08-11 | 13F | Western Wealth Management, LLC | 4 889 | 0,18 | 313 | −6,31 | ||||
| 2025-08-06 | 13F | Agf Management Ltd | 756 389 | 28,54 | 48 371 | 20,32 | ||||
| 2025-08-08 | 13F | Cetera Investment Advisers | 170 524 | −8,61 | 10 905 | −14,47 | ||||
| 2025-07-29 | 13F | Harbor Asset Planning, Inc. | 523 | 33 | ||||||
| 2025-07-25 | 13F | Asset Planning,Inc | 406 | 0,00 | 26 | −7,41 | ||||
| 2025-07-16 | 13F/A | CX Institutional | 29 559 | 1 675,32 | 2 | |||||
| 2025-08-13 | 13F | Jones Financial Companies Lllp | 20 911 | 65,27 | 1 332 | 55,43 | ||||
| 2025-07-30 | 13F | Evermay Wealth Management Llc | 17 | 0,00 | 1 | 0,00 | ||||
| 2025-08-11 | 13F | Brown Brothers Harriman & Co | 2 894 | 1 191,96 | 185 | 1 133,33 | ||||
| 2025-08-12 | 13F | O'shaughnessy Asset Management, Llc | 5 860 | −16,95 | 375 | −22,41 | ||||
| 2025-08-14 | 13F | Dagco, Inc. | 55 | 4 | ||||||
| 2025-05-02 | 13F | Capital A Wealth Management, LLC | 72 | 5 | ||||||
| 2025-08-13 | 13F | Colonial Trust Advisors | 50 | 0,00 | 3 | 0,00 | ||||
| 2025-08-15 | 13F | Tower Research Capital LLC (TRC) | 12 505 | −0,11 | 800 | −6,55 | ||||
| 2025-08-07 | 13F | Allworth Financial LP | 1 976 | −4,68 | 126 | −5,26 | ||||
| 2025-05-02 | 13F | Wealthfront Advisers Llc | 0 | −100,00 | 0 | −100,00 | ||||
| 2025-08-04 | 13F | Spire Wealth Management | 10 345 | −5,30 | 662 | −11,39 | ||||
| 2025-08-12 | 13F | Franklin Resources Inc | 124 | −95,39 | 8 | −96,17 | ||||
| 2025-08-08 | 13F | Crossmark Global Holdings, Inc. | 5 018 | 0,00 | 320 | −6,71 | ||||
| 2025-07-23 | 13F | REAP Financial Group, LLC | 8 | 0,00 | 1 | |||||
| 2025-07-29 | 13F | Chicago Partners Investment Group LLC | 7 486 | −4,65 | 485 | −3,20 | ||||
| 2025-08-06 | 13F | Golden State Wealth Management, LLC | 682 | 44 | ||||||
| 2025-08-08 | 13F | Altfest L J & Co Inc | 0 | −100,00 | 0 | |||||
| 2025-07-30 | 13F | Retirement Planning Group | 12 959 | 0,10 | 829 | −6,33 | ||||
| 2025-07-31 | 13F | CVA Family Office, LLC | 31 | 0,00 | 2 | −50,00 | ||||
| 2025-08-04 | 13F | Creekmur Asset Management LLC | 2 454 | −2,77 | 157 | −9,30 | ||||
| 2025-03-21 | 13F | Prostatis Group LLC | 0 | −100,00 | 0 | |||||
| 2025-08-14 | 13F | CoreCap Advisors, LLC | 1 437 | −0,07 | 92 | −7,14 | ||||
| 2025-07-21 | 13F | Patriot Financial Group Insurance Agency, LLC | 41 179 | 0,63 | 2 633 | −5,80 | ||||
| 2025-08-19 | 13F | Cape Investment Advisory, Inc. | 142 | 61,36 | 9 | 50,00 | ||||
| 2025-08-05 | 13F | Dunhill Financial, LLC | 108 | −0,92 | 7 | −14,29 | ||||
| 2025-08-07 | 13F | Montag A & Associates Inc | 11 292 | −4,06 | 722 | −10,20 | ||||
| 2025-08-12 | 13F | CIBC Private Wealth Group, LLC | 1 118 | −44,98 | 72 | −43,20 | ||||
| 2025-07-23 | 13F | Monte Financial Group, LLC | 4 511 | 13,77 | 288 | 14,74 | ||||
| 2025-07-25 | 13F | Envestnet Portfolio Solutions, Inc. | 9 662 | −30,51 | 618 | −35,05 | ||||
| 2025-07-17 | 13F | Smith Chas P & Associates Pa Cpas | 7 259 | −15,10 | 464 | −20,55 | ||||
| 2025-07-25 | 13F | Johnson Investment Counsel Inc | 0 | −100,00 | 0 | |||||
| 2025-08-14 | 13F | Wells Fargo & Company/mn | 178 101 | −8,32 | 11 390 | −14,19 | ||||
| 2025-07-28 | 13F | Rosenberg Matthew Hamilton | 2 208 | 0,00 | 141 | −6,00 | ||||
| 2025-08-14 | 13F | Boston Private Wealth Llc | 4 797 | 307 | ||||||
| 2025-07-23 | 13F | LifeSteps Financial, Inc. | 7 536 | −2,60 | 482 | −8,90 | ||||
| 2025-07-10 | 13F | Atticus Wealth Management, Llc | 640 | 0,00 | 41 | −6,98 | ||||
| 2025-07-18 | 13F | Truist Financial Corp | 33 574 | −3,93 | 2 147 | −10,05 | ||||
| 2025-09-04 | 13F/A | Advisor Group Holdings, Inc. | 207 447 | −5,37 | 13 286 | −11,40 | ||||
| 2025-07-22 | 13F | Iron Horse Wealth Management, LLC | 6 | 0,00 | 0 | |||||
| 2025-08-14 | 13F | Federation des caisses Desjardins du Quebec | 25 | 2 | ||||||
| 2025-08-07 | 13F | PFG Advisors | 0 | −100,00 | 0 | |||||
| 2025-08-14 | 13F | Certified Advisory Corp | 5 076 | 35,18 | 325 | 26,56 | ||||
| 2025-08-14 | 13F | Mml Investors Services, Llc | 16 416 | −13,00 | 1 | 0,00 | ||||
| 2025-08-01 | 13F | Solstein Capital, LLC | 518 | 0,00 | 33 | −5,71 | ||||
| 2025-08-08 | 13F | Flaharty Asset Management, LLC | 15 | 0,00 | 1 | −100,00 | ||||
| 2025-07-24 | 13F | Bernard Wealth Management Corp. | 0 | −100,00 | 0 | |||||
| 2025-07-24 | 13F | Court Place Advisors, LLC | 10 155 | −4,23 | 649 | −10,36 | ||||
| 2025-07-15 | 13F | Eaton Financial Holdings Company, LLC | 3 217 | 0,41 | 206 | −5,96 | ||||
| 2025-08-13 | 13F | Renaissance Technologies Llc | 19 300 | 1 234 | ||||||
| 2025-08-11 | 13F | Aptus Capital Advisors, LLC | 303 | 0,33 | 19 | −5,00 | ||||
| 2025-08-05 | 13F | Bank of New York Mellon Corp | 7 320 | −29,62 | 468 | −34,08 | ||||
| 2025-05-16 | 13F | Coordinated Financial Services, Inc./CO | 3 908 | 19,00 | 267 | 18,67 | ||||
| 2025-07-25 | 13F | Valley Brook Capital Group, Inc. | 4 354 | 0,69 | 278 | −5,76 | ||||
| 2025-08-15 | 13F | Equitable Holdings, Inc. | 47 324 | −1,86 | 3 026 | −8,14 | ||||
| 2025-07-15 | 13F | Lynch & Associates/in | 33 706 | 3,12 | 2 155 | −3,49 | ||||
| 2025-08-14 | 13F | Atomi Financial Group, Inc. | 7 869 | 0,05 | 503 | −6,33 | ||||
| 2025-07-09 | 13F | WealthCare Investment Partners, LLC | 4 832 | −1,51 | 311 | 1,97 | ||||
| 2025-08-27 | 13F/A | Brinker Capital Investments, LLC | 20 999 | 1,20 | 1 343 | −5,29 | ||||
| 2025-07-22 | 13F | PUREfi Wealth, LLC | 5 599 | 0,00 | 358 | −6,28 | ||||
| 2025-07-31 | 13F | Sage Mountain Advisors LLC | 1 280 | 0,00 | 82 | −6,90 | ||||
| 2025-08-14 | 13F | Qube Research & Technologies Ltd | 3 438 | −38,00 | 220 | −42,06 | ||||
| 2025-07-09 | 13F | Bank of New Hampshire | 165 | 0,00 | 11 | −9,09 | ||||
| 2025-08-11 | 13F | HighTower Advisors, LLC | 25 202 | −72,06 | 1 612 | −73,86 | ||||
| 2025-05-01 | 13F | Grant/GrossMendelsohn, LLC | 45 502 | 1 132,78 | 2 960 | 1 127,80 | ||||
| 2025-07-17 | 13F | Beacon Capital Management, LLC | 0 | −100,00 | 0 | |||||
| 2025-07-31 | 13F | United Community Bank | 1 013 | 0,00 | 65 | −7,25 | ||||
| 2025-08-05 | 13F | EPG Wealth Management LLC | 200 | 0,50 | 13 | −7,69 | ||||
| 2025-07-15 | 13F | Main Street Group, LTD | 60 | 0,00 | 4 | −25,00 | ||||
| 2025-08-01 | 13F | SYM FINANCIAL Corp | 468 | 30 | ||||||
| 2025-08-12 | 13F | J.w. Cole Advisors, Inc. | 27 878 | 155,20 | 1 783 | 138,87 | ||||
| 2025-05-15 | 13F | Gts Securities Llc | 0 | −100,00 | 0 | |||||
| 2025-08-14 | 13F | Modern Wealth Management, LLC | 134 650 | 372,03 | 8 611 | 341,99 | ||||
| 2025-07-16 | 13F | Essex Financial Services, Inc. | 7 847 | −9,68 | 502 | −15,51 | ||||
| 2025-08-07 | 13F | Traynor Capital Management, Inc. | 124 050 | −11,06 | 8 029 | −15,74 | ||||
| 2025-05-14 | 13F | Capital Analysts, Inc. | 0 | −100,00 | 0 | |||||
| 2025-07-30 | 13F | Eqis Capital Management, Inc. | 25 127 | −40,85 | 1 607 | −44,66 | ||||
| 2025-08-25 | 13F/A | Promus Capital, LLC | 140 | −33,33 | 9 | −42,86 | ||||
| 2025-08-08 | 13F | Advisors Capital Management, LLC | 0 | −100,00 | 0 | |||||
| 2025-08-05 | 13F | GHP Investment Advisors, Inc. | 450 | 0,00 | 29 | −6,67 | ||||
| 2025-08-11 | 13F | Bell Investment Advisors, Inc | 400 | 26 | ||||||
| 2025-07-23 | 13F | Elm3 Financial Group, LLC | 0 | −100,00 | 0 | |||||
| 2025-08-14 | 13F | Ancora Advisors, LLC | 771 | 0,26 | 49 | −5,77 | ||||
| 2025-08-15 | 13F | Morgan Stanley | 452 493 | 5,01 | 28 937 | −1,71 | ||||
| 2025-08-08 | 13F | Creative Planning | 47 493 | −50,04 | 3 037 | −53,23 | ||||
| 2025-07-30 | 13F | Demars Financial Group, LLC | 8 036 | −98,58 | 514 | 6 312,50 | ||||
| 2025-08-01 | 13F | Bessemer Group Inc | 0 | −100,00 | 0 | |||||
| 2025-07-17 | 13F | Hanson & Doremus Investment Management | 711 | 0,00 | 0 | |||||
| 2025-07-08 | 13F | Silverleafe Capital Partners, LLC | 3 895 | −25,91 | 249 | −30,64 | ||||
| 2025-08-04 | 13F | Arkadios Wealth Advisors | 7 982 | −4,11 | 510 | −10,21 | ||||
| 2025-07-14 | 13F | McGlone Suttner Wealth Management, Inc. | 270 741 | 4,35 | 17 314 | −2,32 | ||||
| 2025-08-12 | 13F | PKS Advisory Services, LLC | 4 989 | −7,27 | 319 | −13,08 | ||||
| 2025-07-25 | 13F | Cwm, Llc | 5 250 | −40,79 | 0 | |||||
| 2025-08-13 | 13F | Colonial Trust Co / SC | 1 040 | 0,00 | 67 | −7,04 | ||||
| 2025-07-30 | 13F | Roman Butler Fullerton & Co | 7 364 | 0,00 | 477 | 0,85 | ||||
| 2025-07-07 | 13F | Roxbury Financial LLC | 26 919 | 1,58 | 1 722 | −7,27 | ||||
| 2025-07-08 | 13F | Atlas Brown,Inc. | 21 572 | −0,13 | 1 380 | −6,51 | ||||
| 2025-07-16 | 13F | American National Bank | 10 410 | −1,81 | 666 | −8,15 | ||||
| 2025-08-26 | 13F | Claris Financial LLC | 7 609 | −11,62 | 487 | −13,52 | ||||
| 2025-07-14 | 13F | Abound Wealth Management | 675 | 209,63 | 43 | 207,14 | ||||
| 2025-07-08 | 13F | Parallel Advisors, LLC | 600 | 0,00 | 38 | −5,00 | ||||
| 2025-07-08 | 13F/A | Salem Investment Counselors Inc | 500 | 0,00 | 32 | −8,82 | ||||
| 2025-07-15 | 13F | Financial Partners Group, Inc | 71 816 | 3,63 | 4 593 | −3,00 | ||||
| 2025-07-16 | 13F | Beaumont Financial Advisors, LLC | 0 | −100,00 | 0 | |||||
| 2025-08-13 | 13F | Northwestern Mutual Wealth Management Co | 131 076 | −41,54 | 8 382 | −45,28 | ||||
| 2025-08-14 | 13F | Comerica Bank | 3 406 | −30,28 | 218 | −34,83 | ||||
| 2025-07-21 | 13F | HighMark Wealth Management LLC | 18 | 20,00 | 1 | 0,00 | ||||
| 2025-07-30 | 13F | IMG Wealth Management, Inc. | 413 | 26 | ||||||
| 2025-08-14 | 13F | Goldman Sachs Group Inc | 155 764 | 40,57 | 9 961 | 31,59 | ||||
| 2025-08-01 | 13F | Schmidt P J Investment Management Inc | 6 463 | 11,70 | 413 | 4,56 | ||||
| 2025-08-12 | 13F | Pathstone Holdings, LLC | 15 852 | −40,27 | 1 014 | −44,64 | ||||
| 2025-07-29 | 13F | Calamos Wealth Management LLC | 4 486 | −4,90 | 287 | −11,18 | ||||
| 2025-08-07 | 13F | Birchcreek Wealth Management, LLC | 19 051 | 26,32 | 1 218 | 18,25 | ||||
| 2025-07-16 | 13F | Signaturefd, Llc | 0 | −100,00 | 0 | −100,00 | ||||
| 2025-07-30 | 13F | Wbh Advisory Inc | 0 | −100,00 | 0 | |||||
| 2025-04-24 | 13F | CNB Bank | 0 | −100,00 | 0 | |||||
| 2025-08-13 | 13F | Lido Advisors, LLC | 1 895 162 | 3,72 | 121 196 | −2,91 | ||||
| 2025-08-12 | 13F | SRS Capital Advisors, Inc. | 35 216 | 20,93 | 2 284 | 14,83 | ||||
| 2025-08-08 | 13F | Apex Wealth Management, LLC | 4 089 | 0,42 | 261 | −6,12 | ||||
| 2025-04-28 | 13F | Mainstream Capital Management LLC | 0 | −100,00 | 0 | |||||
| 2025-08-11 | 13F | HHM Wealth Advisors, LLC | 700 | 0,00 | 45 | −6,38 | ||||
| 2025-05-12 | 13F | Ameritas Investment Partners, Inc. | 0 | −100,00 | 0 | |||||
| 2025-07-17 | 13F | Halbert Hargrove Global Advisors, Llc | 0 | −100,00 | 0 | |||||
| 2025-07-15 | 13F | Elevated Capital Advisors, LLC | 3 685 | 0,00 | 252 | 0,00 | ||||
| 2025-08-13 | 13F | Congress Wealth Management LLC / DE / | 20 777 | 58,66 | 1 329 | 48,38 | ||||
| 2025-08-06 | 13F | Mcrae Capital Management Inc | 6 954 | 445 | ||||||
| 2025-08-14 | 13F | Aprio Wealth Management, LLC | 69 157 | −17,73 | 4 423 | −23,00 | ||||
| 2025-08-08 | 13F | Atlantic Trust, LLC | 52 | 0,00 | 3 | 0,00 | ||||
| 2025-07-28 | 13F | RFG Advisory, LLC | 10 990 | 0,00 | 703 | −6,40 | ||||
| 2025-07-14 | 13F | UMA Financial Services, Inc. | 61 | 0,00 | 4 | −25,00 | ||||
| 2025-08-12 | 13F | OneAscent Financial Services LLC | 5 278 | 0 | ||||||
| 2025-05-08 | 13F | Waterway Wealth Management, LLC | 0 | −100,00 | 0 | |||||
| 2025-07-17 | 13F | Smith, Salley & Associates | 44 177 | 0,69 | 2 825 | −5,74 | ||||
| 2025-07-23 | 13F | Valmark Advisers, Inc. | 49 361 | 1,92 | 3 157 | −4,59 | ||||
| 2025-07-30 | 13F | VCI Wealth Management LLC | 24 829 | 10,47 | 1 588 | 3,39 | ||||
| 2025-08-12 | 13F | Eley Financial Management, Inc | 9 946 | −84,73 | 636 | −85,44 | ||||
| 2025-07-21 | 13F | Exchange Capital Management, Inc. | 49 599 | −2,93 | 3 172 | −9,14 | ||||
| 2025-08-12 | 13F | Coston, McIsaac & Partners | 331 | 0,30 | 0 | |||||
| 2025-08-04 | 13F | Prairie Wealth Advisors, Inc. | 5 952 | −0,42 | 381 | −6,86 | ||||
| 2025-08-19 | 13F | Anchor Investment Management, LLC | 1 000 | 0,00 | 64 | −7,35 | ||||
| 2025-07-30 | 13F | Mid-American Wealth Advisory Group, Inc. | 54 | 3 | ||||||
| 2025-08-06 | 13F | Maltin Wealth Management, Inc. | 56 256 | 3,89 | 3 598 | −2,76 | ||||
| 2025-08-08 | 13F | Larson Financial Group LLC | 97 311 | 0,83 | 6 223 | −5,61 | ||||
| 2025-08-29 | 13F | Evolution Wealth Management Inc. | 1 213 | 78 | ||||||
| 2025-08-11 | 13F | Citigroup Inc | 35 264 | 3,80 | 2 255 | −2,80 | ||||
| 2025-07-21 | 13F | Ameriflex Group, Inc. | 381 | −47,01 | 24 | −51,02 | ||||
| 2025-08-13 | 13F | Flow Traders U.s. Llc | 3 734 | 0 | ||||||
| 2025-08-14 | 13F | Royal Bank Of Canada | 64 034 | 11,15 | 4 095 | 4,04 | ||||
| 2025-07-31 | 13F | Glass Jacobson Investment Advisors llc | 12 529 | 3,76 | 801 | 1,52 | ||||
| 2025-07-22 | 13F | Mascoma Wealth Management LLC | 6 970 | −22,85 | 446 | −27,88 | ||||
| 2025-07-17 | 13F | LexAurum Advisors, LLC | 8 179 | 8,09 | 523 | 1,16 | ||||
| 2025-07-17 | 13F | Janney Montgomery Scott LLC | 14 056 | −3,82 | 1 | |||||
| 2025-07-14 | 13F | Sweeney & Michel, Llc | 3 488 | 224 | ||||||
| 2025-08-07 | 13F | Richard C. Young & CO., LTD. | 5 824 | 0,88 | 372 | −5,58 | ||||
| 2025-08-04 | 13F | Wealth Management Associates, Inc. | 5 942 | 0,05 | 380 | −6,42 | ||||
| 2025-08-15 | 13F | Kestra Advisory Services, LLC | 280 190 | 24,84 | 17 918 | 16,86 | ||||
| 2025-07-25 | 13F | Commonwealth Financial Services, LLC | 3 156 | 0,00 | 202 | −6,51 | ||||
| 2025-07-15 | 13F | Mather Group, Llc. | 0 | −100,00 | 0 | |||||
| 2025-07-14 | 13F | S.A. Mason LLC | 679 | 0,00 | 43 | −6,52 | ||||
| 2025-08-14 | 13F | Visionary Wealth Advisors | 0 | −100,00 | 0 | |||||
| 2025-08-05 | 13F | C2P Capital Advisory Group, LLC d.b.a. Prosperity Capital Advisors | 4 109 | 13,23 | 263 | 7,82 | ||||
| 2025-08-12 | 13F | Eldridge Investment Advisors, Inc. | 8 940 | 0,00 | 572 | −6,39 | ||||
| 2025-08-14 | 13F | Hrt Financial Lp | 0 | −100,00 | 0 | |||||
| 2025-08-14 | 13F | Mercer Global Advisors Inc /adv | 4 799 | −2,38 | 307 | −8,66 | ||||
| 2025-08-05 | 13F | Artemis Wealth Advisors, LLC | 3 910 | 0,36 | 250 | −6,02 | ||||
| 2025-08-05 | 13F | Plante Moran Financial Advisors, LLC | 0 | −100,00 | 0 | |||||
| 2025-07-14 | 13F | Sowell Financial Services LLC | 3 474 | 10,01 | 222 | 3,26 | ||||
| 2025-08-12 | 13F | Charles Schwab Investment Management Inc | 1 773 868 | 5,78 | 113 439 | −0,98 | ||||
| 2025-07-15 | 13F | Fifth Third Bancorp | 1 691 | 0,00 | 108 | −6,09 | ||||
| 2025-07-24 | 13F | Jfs Wealth Advisors, Llc | 0 | −100,00 | 0 | |||||
| 2025-08-14 | 13F | Snowden Capital Advisors LLC | 36 568 | −11,14 | 2 339 | −16,83 | ||||
| 2025-08-08 | 13F | Arcadia Investment Management Corp/mi | 20 | 0,00 | 1 | 0,00 | ||||
| 2025-08-14 | 13F | Quantinno Capital Management LP | 5 641 | 361 | ||||||
| 2025-08-11 | 13F | Wealthspire Advisors, LLC | 7 557 | 0,39 | 483 | −6,03 | ||||
| 2025-07-16 | 13F | Dakota Wealth Management | 3 260 | −58,81 | 209 | −61,48 | ||||
| 2025-08-12 | 13F | Atlas Capital Advisors Llc | 24 028 | −33,16 | 1 537 | −37,46 | ||||
| 2025-07-17 | 13F | Nelson, Van Denburg & Campbell Wealth Management Group, LLC | 6 480 | −2,34 | 414 | −8,61 | ||||
| 2025-07-17 | 13F | Wolff Wiese Magana Llc | 49 | 0,00 | 3 | 0,00 | ||||
| 2025-07-25 | 13F | Almanack Investment Partners, LLC. | 0 | −100,00 | 0 | |||||
| 2025-08-05 | 13F | Sigma Planning Corp | 78 617 | −4,79 | 5 028 | −10,88 | ||||
| 2025-07-31 | 13F | WFA Asset Management Corp | 580 | 0,35 | 40 | −2,50 | ||||
| 2025-08-08 | 13F/A | Prospect Financial Services LLC | 20 654 | −35,15 | 1 321 | −39,34 | ||||
| 2025-07-23 | 13F | Pillar Financial Advisors, LLC | 128 | 0,00 | 8 | 0,00 | ||||
| 2025-08-14 | 13F | Sunbelt Securities, Inc. | 16 212 | 0,20 | 1 059 | −4,16 | ||||
| 2025-05-15 | 13F/A | Orion Portfolio Solutions, LLC | 20 749 | −3,72 | 1 418 | 0,64 | ||||
| 2025-07-16 | 13F | Brown, Lisle/cummings, Inc. | 82 | 0,00 | 5 | 0,00 | ||||
| 2025-04-22 | 13F | Canton Hathaway, LLC | 0 | −100,00 | 0 | |||||
| 2025-08-04 | 13F | Pensionmark Financial Group, Llc | 8 377 | 6,55 | 536 | −0,37 | ||||
| 2025-08-08 | 13F | Pnc Financial Services Group, Inc. | 3 099 | −2,97 | 198 | −9,17 | ||||
| 2025-07-30 | 13F | Financial Perspectives, Inc | 1 752 | 0,34 | 112 | −5,88 | ||||
| 2025-07-07 | 13F | First Community Trust Na | 637 | 0,00 | 41 | −6,98 | ||||
| 2025-08-05 | 13F | Mountain Hill Investment Partners Corp. | 20 | 0,00 | 1 | 0,00 | ||||
| 2025-08-13 | 13F | Northern Trust Corp | 0 | −100,00 | 0 | |||||
| 2025-08-14 | 13F/A | Skopos Labs, Inc. | 360 | −4,76 | 23 | −8,00 | ||||
| 2025-08-12 | 13F | Jpmorgan Chase & Co | 89 429 | −23,22 | 5 719 | −28,13 | ||||
| 2025-07-22 | 13F | Yoder Wealth Management, Inc. | 80 327 | 5,08 | 5 137 | −1,65 | ||||
| 2025-07-23 | 13F | Beaumont Asset Management, L.L.C. | 0 | −100,00 | 0 | |||||
| 2025-07-21 | 13F | Cornell Pochily Investment Advisors, Inc. | 3 391 | 0,30 | 217 | −6,09 | ||||
| 2025-07-23 | 13F | High Note Wealth, LLC | 704 | 0,00 | 45 | −6,25 | ||||
| 2025-08-13 | 13F | Fisher Asset Management, LLC | 10 235 | 5,21 | 655 | −1,51 | ||||
| 2025-07-24 | 13F | Coordinated Financial Services, Inc. | 4 495 | 34,82 | 287 | 32,26 | ||||
| 2025-07-15 | 13F | Xcel Wealth Management, LLC | 5 000 | 0,00 | 320 | −6,45 | ||||
| 2025-08-13 | 13F | KDK Private Wealth Management, LLC | 26 568 | −2,39 | 1 699 | −8,56 | ||||
| 2025-07-15 | 13F | Buttonwood Financial Advisors Inc. | 189 730 | 4,35 | 12 133 | −2,33 | ||||
| 2025-07-10 | 13F | Legacy Financial Strategies, LLC | 8 470 | −0,36 | 542 | −6,72 | ||||
| 2025-08-06 | 13F | Ipsen Advisor Group LLC | 5 377 | 0,66 | 344 | −5,77 | ||||
| 2025-08-14 | 13F | Jane Street Group, Llc | 4 570 | −85,71 | 292 | −86,63 | ||||
| 2025-07-31 | 13F | Cambridge Investment Research Advisors, Inc. | 127 939 | −10,30 | 8 | −11,11 | ||||
| 2025-08-12 | 13F | Centric Wealth Management | 15 307 | 951 | ||||||
| 2025-05-07 | 13F | Spectrum Wealth Counsel, LLC | 3 645 | 0,00 | 249 | 4,62 | ||||
| 2025-05-16 | 13F/A | Kestra Investment Management, LLC | 0 | −100,00 | 0 | |||||
| 2025-07-29 | 13F | Swmg, Llc | 3 348 | 215 | ||||||
| 2025-08-14 | 13F | Sentinus, LLC | 5 441 | −7,01 | 348 | −13,03 | ||||
| 2025-08-05 | 13F | Beckerman Institutional, LLC | 32 844 | 0,83 | 2 | 0,00 | ||||
| 2025-08-05 | 13F | Astra Wealth Partners LLC | 4 359 | 279 | ||||||
| 2025-07-14 | 13F | Hoey Investments, Inc | 107 | 0,00 | 7 | −14,29 | ||||
| 2025-04-29 | 13F | Lee Danner & Bass Inc | 0 | −100,00 | 0 | |||||
| 2025-08-08 | 13F | Meridian Wealth Management, LLC | 14 182 | 11,32 | 907 | 4,14 | ||||
| 2025-08-12 | 13F | Armor Investment Advisors, LLC | 85 160 | −0,45 | 5 446 | −6,83 | ||||
| 2025-07-11 | 13F | Weatherly Asset Management L. P. | 272 095 | 4,99 | 17 400 | −1,72 | ||||
| 2025-07-25 | 13F | Apollon Wealth Management, LLC | 170 376 | 9,51 | 10 896 | 2,51 | ||||
| 2025-08-08 | 13F | D'Orazio & Associates, Inc. | 3 176 | 0,00 | 203 | −6,02 | ||||
| 2025-07-22 | 13F | Miracle Mile Advisors, LLC | 0 | −100,00 | 0 | |||||
| 2025-05-13 | 13F | Measured Risk Portfolios, Inc. | 0 | −100,00 | 0 | |||||
| 2025-07-28 | 13F | Mutual Advisors, LLC | 0 | −100,00 | 0 | |||||
| 2025-07-29 | 13F | AssuredPartners Investment Advisors, LLC | 0 | −100,00 | 0 | |||||
| 2025-07-02 | 13F | HBW Advisory Services LLC | 6 252 | 9,88 | 400 | 2,84 | ||||
| 2025-07-24 | 13F | Wealthstar Advisors, Llc | 10 896 | 4,46 | 697 | −2,25 | ||||
| 2025-08-14 | 13F | UBS Group AG | 66 105 | −0,55 | 4 227 | −6,91 | ||||
| 2025-07-08 | 13F | Nbc Securities, Inc. | 6 431 | −18,40 | 0 | |||||
| 2025-07-30 | 13F | Pacific Sun Financial Corp | 6 501 | −5,82 | 416 | −11,89 | ||||
| 2025-07-22 | 13F | Valley National Advisers Inc | 132 | −48,64 | 0 | |||||
| 2025-07-15 | 13F | Carr Financial Group Corp | 5 580 | 9,07 | 357 | 2,01 | ||||
| 2025-07-28 | 13F | Harbour Investments, Inc. | 31 358 | 1,72 | 2 005 | −4,80 | ||||
| 2025-07-10 | 13F | Charter Oak Capital Management, LLC | 16 949 | 4,22 | 1 084 | −2,52 | ||||
| 2025-08-04 | 13F | Center for Financial Planning, Inc. | 300 | 0,00 | 19 | −5,00 | ||||
| 2025-08-06 | 13F | First Horizon Advisors, Inc. | 300 | 0,00 | 19 | −5,00 | ||||
| 2025-08-06 | 13F | Kcm Investment Advisors Llc | 0 | −100,00 | 0 | |||||
| 2025-05-05 | 13F | Morningstar Investment Services LLC | 37 214 | 3 | ||||||
| 2025-08-14 | 13F | Kovitz Investment Group Partners, LLC | 137 665 | 37,97 | 8 804 | 29,13 | ||||
| 2025-08-19 | 13F | Advisory Services Network, LLC | 13 306 | 8,26 | 827 | −1,43 | ||||
| 2025-08-01 | 13F | Chilton Capital Management Llc | 152 | 0,00 | 10 | −10,00 | ||||
| 2025-08-14 | 13F | Citadel Advisors Llc | 79 230 | 335,93 | 5 067 | 308,22 | ||||
| 2025-08-12 | 13F | Minot DeBlois Advisors LLC | 47 | 0,00 | 3 | 0,00 | ||||
| 2025-08-19 | 13F | Newbridge Financial Services Group, Inc. | 325 | 0,00 | 21 | −9,09 | ||||
| 2025-04-16 | 13F | Hilltop Wealth Advisors, Llc | 0 | −100,00 | 0 | |||||
| 2025-08-14 | 13F | Raymond James Financial Inc | 291 535 | 3,92 | 18 644 | −2,73 | ||||
| 2025-07-24 | 13F | Strengthening Families & Communities, LLC | 8 774 | 47,96 | 599 | 47,54 | ||||
| 2025-08-18 | 13F/A | National Bank Of Canada /fi/ | 200 | 0,00 | 13 | −7,69 | ||||
| 2025-07-21 | 13F | Warner Financial, Inc | 5 390 | 0,00 | 0 | |||||
| 2025-07-24 | 13F | IFP Advisors, Inc | 2 864 | −20,84 | 183 | −25,91 | ||||
| 2025-07-17 | 13F | Barry Investment Advisors, LLC | 56 851 | −1,71 | 3 636 | −8,00 | ||||
| 2025-07-29 | 13F | Private Trust Co Na | 464 | 7,66 | 30 | 0,00 | ||||
| 2025-07-25 | 13F | Ellis Investment Partners, LLC | 4 481 | −14,22 | 287 | −19,66 | ||||
| 2025-07-29 | NP | EBI - Longview Advantage ETF | 0 | −100,00 | 0 | −100,00 | ||||
| 2025-08-05 | 13F | Lifeworks Advisors, LLC | 143 971 | −15,24 | 9 207 | −20,67 | ||||
| 2025-08-26 | 13F/A | Thrivent Financial For Lutherans | 4 375 | −49,59 | 0 | |||||
| 2025-07-17 | 13F | Fifth Third Securities, Inc. | 24 363 | 0,70 | 1 558 | −5,69 | ||||
| 2025-07-25 | 13F | Atria Wealth Solutions, Inc. | 26 020 | −65,40 | 1 671 | −67,48 | ||||
| 2025-07-16 | 13F | Maridea Wealth Management LLC | 0 | −100,00 | 0 | |||||
| 2025-08-06 | 13F | Valued Wealth Advisors LLC | 0 | −100,00 | 0 | |||||
| 2025-07-24 | 13F | Blair William & Co/il | 1 883 | 17,17 | 120 | 10,09 | ||||
| 2025-08-11 | 13F | Wbi Investments, Inc. | 30 089 | −9,85 | 1 924 | −15,61 | ||||
| 2025-07-15 | 13F | Centerline Wealth Advisors, LLC | 132 612 | 4,28 | 8 481 | −2,39 | ||||
| 2025-07-14 | 13F | Buska Wealth Management, LLC | 15 412 | −11,81 | 986 | −17,44 | ||||
| 2025-08-05 | 13F | Mission Wealth Management, Lp | 28 708 | 241,60 | 1 836 | 219,69 | ||||
| 2025-07-15 | 13F | Define Financial, Llc | 5 598 | 0,39 | 358 | 0,56 | ||||
| 2025-08-08 | 13F | Hartland & Co., LLC | 600 | 38 | ||||||
| 2025-07-07 | 13F | Nova Wealth Management, Inc. | 2 441 | 176,13 | 156 | 160,00 | ||||
| 2025-07-22 | 13F | Merit Financial Group, LLC | 5 531 | 354 | ||||||
| 2025-07-11 | 13F | Farther Finance Advisors, LLC | 229 | −5,76 | 15 | −12,50 | ||||
| 2025-07-30 | 13F | Bogart Wealth, LLC | 10 | 0,00 | 1 | |||||
| 2025-08-08 | 13F | Avantax Advisory Services, Inc. | 11 126 | −21,06 | 712 | −26,09 | ||||
| 2025-07-23 | 13F | Heck Capital Advisors, LLC | 45 514 | 1,41 | 2 911 | −5,09 | ||||
| 2025-04-23 | 13F | PMV Capital Advisers, LLC | 0 | −100,00 | 0 | |||||
| 2025-05-15 | 13F | Fiduciary Trust Co | 0 | −100,00 | 0 | |||||
| 2025-08-12 | 13F | Jaffetilchin Investment Partners, LLC | 13 241 | −0,14 | 847 | −6,52 | ||||
| 2025-07-24 | 13F | Us Bancorp \de\ | 2 186 | 8,00 | 140 | 0,72 | ||||
| 2025-08-13 | 13F | Whalerock Point Partners, Llc | 7 360 | 0,01 | 471 | −6,37 | ||||
| 2025-08-07 | 13F | Resources Investment Advisors, LLC. | 80 112 | −1,07 | 5 123 | −7,39 | ||||
| 2025-08-12 | 13F | MAI Capital Management | 38 702 | −3,51 | 2 475 | −9,71 | ||||
| 2025-08-14 | 13F | Bank Of America Corp /de/ | 98 275 | −49,15 | 6 285 | −52,40 | ||||
| 2025-08-11 | 13F | Private Advisor Group, LLC | 7 305 | −63,40 | 467 | −65,74 | ||||
| 2025-07-18 | 13F | Eagle Capital Management, LLC | 5 600 | −96,70 | 0 | −100,00 | ||||
| 2025-08-04 | 13F | Assetmark, Inc | 99 441 | 190,17 | 6 359 | 171,64 | ||||
| 2025-08-06 | 13F | Decker Retirement Planning Inc. | 277 | 0,00 | 18 | −5,56 | ||||
| 2025-08-07 | 13F | BOK Financial Private Wealth, Inc. | 798 | 0,00 | 51 | −5,56 | ||||
| 2025-08-14 | 13F | Glen Eagle Advisors, LLC | 2 963 | 0,00 | 189 | −6,44 | ||||
| 2025-08-08 | 13F | Independence Financial Advisors, LLC | 20 684 | −85,30 | 1 323 | −86,24 | ||||
| 2025-08-12 | 13F | Coldstream Capital Management Inc | 0 | −100,00 | 0 | |||||
| 2025-08-06 | 13F | Rialto Wealth Management, LLC | 931 | −69,40 | 60 | −71,50 | ||||
| 2025-07-10 | 13F | Wealth Enhancement Advisory Services, Llc | 26 148 | −10,52 | 1 682 | −15,73 | ||||
| 2025-08-21 | 13F | Pathway Financial Advisers, LLC | 11 764 | −1,95 | 752 | −8,18 | ||||
| 2025-08-15 | 13F | CI Private Wealth, LLC | 3 376 | −17,38 | 216 | −22,94 | ||||
| 2025-08-08 | 13F/A | Sequoia Financial Advisors, LLC | 0 | −100,00 | 0 | |||||
| 2025-07-15 | 13F | Cranbrook Wealth Management, LLC | 0 | −100,00 | 0 | |||||
| 2025-07-11 | 13F | LongView Wealth Management | 8 847 | 52,56 | 566 | 42,68 | ||||
| 2025-08-05 | 13F | Carolinas Wealth Consulting Llc | 0 | −100,00 | 0 | −100,00 | ||||
| 2025-08-13 | 13F | StoneX Group Inc. | 5 988 | −45,23 | 383 | −48,79 | ||||
| 2025-08-13 | 13F | Summit Financial, LLC | 12 105 | −10,57 | 774 | −16,23 | ||||
| 2025-04-29 | 13F | Sequent Asset Management, LLC | 0 | −100,00 | 0 | |||||
| 2025-07-28 | 13F | Frazier Financial Advisors, LLC | 133 | 0,00 | 9 | −11,11 | ||||
| 2025-07-10 | 13F | Oliver Lagore Vanvalin Investment Group | 74 | 0,00 | 5 | 25,00 | ||||
| 2025-08-06 | 13F | AE Wealth Management LLC | 149 717 | 11,54 | 9 575 | 4,41 | ||||
| 2025-08-14 | 13F | Mariner, LLC | 34 115 | 9,58 | 2 182 | 2,54 | ||||
| 2025-08-05 | 13F | Bank Of Montreal /can/ | 1 595 | 0,06 | 102 | −5,56 | ||||
| 2025-08-13 | 13F | Holos Integrated Wealth LLC | 848 | 0,00 | 53 | −8,77 | ||||
| 2025-08-14 | 13F | Integrated Wealth Concepts LLC | 30 574 | 14,29 | 1 955 | 7,01 | ||||
| 2025-08-05 | 13F | Huntington National Bank | 131 | −6,47 | ||||||
| 2025-07-22 | 13F | Hrc Wealth Management, Llc | 7 730 | 0,13 | 494 | −6,26 | ||||
| 2025-05-15 | 13F | D. E. Shaw & Co., Inc. | 0 | −100,00 | 0 | |||||
| 2025-04-29 | 13F | Element Wealth, LLC | 0 | −100,00 | 0 | |||||
| 2025-07-18 | 13F | Vicus Capital | 12 679 | −28,79 | 811 | −33,39 | ||||
| 2025-07-23 | 13F | Traphagen Investment Advisors Llc | 8 066 | −35,47 | 516 | −39,62 | ||||
| 2025-08-07 | 13F | Hughes Financial Services, LLC | 10 | 0,00 | 1 | |||||
| 2025-08-07 | 13F | Summit X, LLC | 0 | −100,00 | 0 | |||||
| 2025-07-08 | 13F | Partnership Wealth Management, LLC | 4 350 | 4,87 | 278 | −1,77 | ||||
| 2025-07-24 | 13F | Comprehensive Money Management Services LLC | 8 822 | −4,96 | 564 | −11,04 | ||||
| 2025-08-19 | 13F | Asset Dedication, LLC | 275 | 18 | ||||||
| 2025-08-06 | 13F | Stone House Investment Management, LLC | 249 | −71,31 | 16 | −74,58 | ||||
| 2025-05-08 | 13F | Gsa Capital Partners Llp | 0 | −100,00 | 0 | |||||
| 2025-08-14 | 13F | Coastal Bridge Advisors, LLC | 39 492 | −0,34 | 2 525 | −6,72 | ||||
| 2025-07-02 | 13F | Marotta Asset Management | 116 482 | 189,87 | 7 449 | 154,67 | ||||
| 2025-08-11 | 13F | Elite Financial, Inc. | 0 | −100,00 | 0 | |||||
| 2025-08-14 | 13F | Price T Rowe Associates Inc /md/ | 19 215 | 0,28 | 1 | 0,00 | ||||
| 2025-08-14 | 13F | Two Sigma Investments, Lp | 152 200 | 3 208,70 | 9 733 | 2 999,68 | ||||
| 2025-08-13 | 13F | Russell Investments Group, Ltd. | 39 | 30,00 | 2 | 0,00 | ||||
| 2025-08-06 | 13F | Adviser Investments LLC | 190 273 | −20,31 | 12 168 | −25,41 | ||||
| 2025-07-24 | 13F | Williams & Novak, LLC | 0 | −100,00 | 0 | |||||
| 2025-08-18 | 13F | N.E.W. Advisory Services LLC | 100 | −56,33 | 6 | −60,00 | ||||
| 2025-08-14 | 13F | Warren Averett Asset Management, LLC | 0 | −100,00 | 0 | |||||
| 2025-07-17 | 13F | Sound Income Strategies, LLC | 539 | 0,00 | 34 | −5,56 | ||||
| 2025-05-09 | 13F | TD Waterhouse Canada Inc. | 0 | −100,00 | 0 | |||||
| 2025-04-29 | 13F | Hm Payson & Co | 0 | −100,00 | 0 | |||||
| 2025-08-14 | 13F | Ameriprise Financial Inc | 45 836 | 3,17 | 2 931 | −3,43 | ||||
| 2025-08-04 | 13F | Atria Investments Llc | 5 480 | 6,00 | 350 | −0,85 | ||||
| 2025-08-04 | 13F | Savvy Advisors, Inc. | 0 | −100,00 | 0 | |||||
| 2025-08-12 | 13F | LPL Financial LLC | 587 436 | 3,53 | 37 567 | −3,09 | ||||
| 2025-08-11 | 13F | Principal Securities, Inc. | 30 724 | 48,75 | 1 965 | 45,59 | ||||
| 2025-07-10 | 13F | Sovran Advisors, LLC | 3 842 | −23,82 | 246 | −22,88 | ||||
| 2025-07-17 | 13F | Avondale Wealth Management | 0 | −100,00 | 0 | |||||
| 2025-08-14 | 13F | Colony Group, LLC | 9 315 | 40,75 | 596 | 31,64 | ||||
| 2025-08-06 | 13F | Commonwealth Equity Services, Llc | 491 535 | −10,84 | 31 | −16,22 | ||||
| 2025-08-01 | 13F | Rossby Financial, LCC | 331 | 0,00 | 21 | 0,00 | ||||
| 2025-08-13 | 13F | Baird Financial Group, Inc. | 4 991 | 319 |