Grunnleggende statistikk
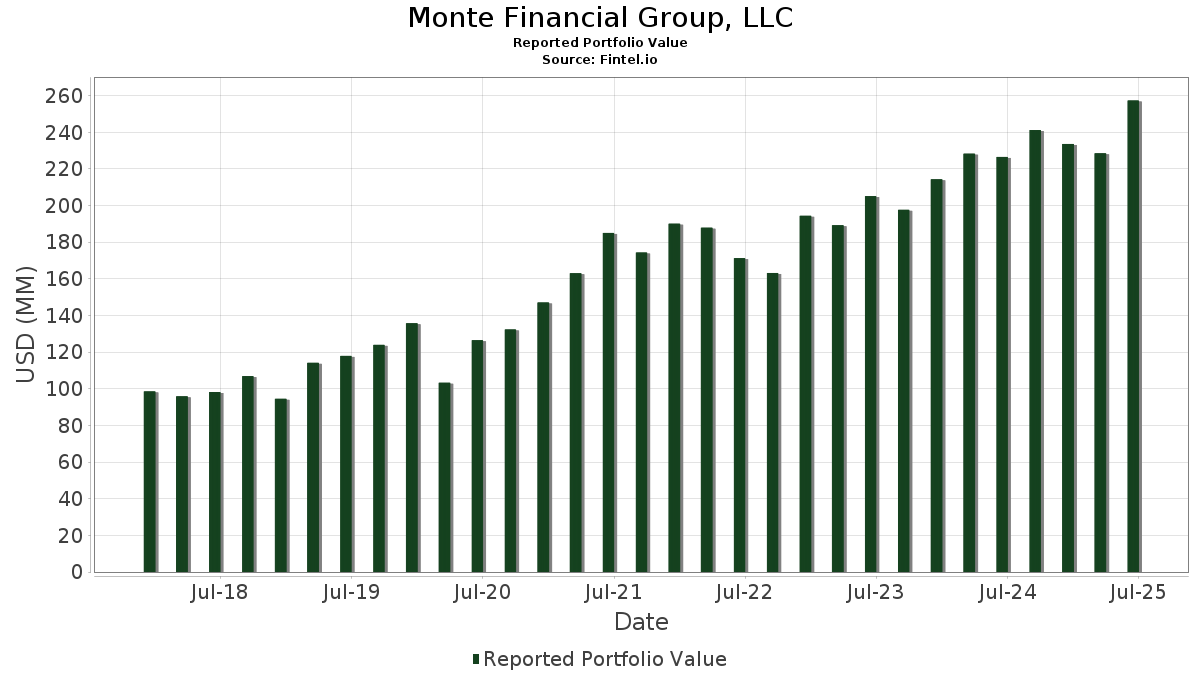
| Porteføljeverdi | $ 257 270 193 |
| Nåværende posisjoner | 90 |
Siste beholdninger, prestasjoner, forvaltet kapital (fra 13F, 13D)
Monte Financial Group, LLC har oppgitt 90 totale beholdninger i sine siste SEC-arkiveringer. Siste porteføljeverdi er beregnet til 257 270 193 USD. Faktisk forvaltet kapital (AUM) er denne verdien pluss kontanter (som ikke er oppgitt). Monte Financial Group, LLCs største beholdninger er Wells Fargo & Company (US:WFC) , Target Corporation (US:TGT) , Abbott Laboratories (US:ABT) , RTX Corporation (US:RTX) , and The Home Depot, Inc. (US:HD) . Monte Financial Group, LLCs nye posisjoner inkluderer The Gap, Inc. (US:GPS) , Taiwan Semiconductor Manufacturing Company Limited - Depositary Receipt (Common Stock) (US:TSM) , Axon Enterprise, Inc. (US:AXON) , Fidelity Covington Trust - Fidelity MSCI Consumer Discretionary Index ETF (US:FDIS) , and .
De største økningene dette kvartalet
Vi bruker endringen i porteføljeallokeringen fordi dette er det mest meningsfulle målet. Endringer kan skyldes handler eller endringer i aksjekursene.
| Verdipapirer | Aksjer (MM) |
Verdi (MM$) |
Portefølje % | ΔPortefølje % |
|---|---|---|---|---|
| 0,03 | 2,80 | 1,0884 | 1,0884 | |
| 0,12 | 2,59 | 1,0079 | 1,0079 | |
| 0,12 | 4,51 | 1,7538 | 0,6132 | |
| 0,01 | 4,46 | 1,7318 | 0,3727 | |
| 0,00 | 0,96 | 0,3717 | 0,3717 | |
| 0,02 | 4,31 | 1,6744 | 0,3367 | |
| 0,11 | 8,66 | 3,3665 | 0,2853 | |
| 0,01 | 1,62 | 0,6304 | 0,2767 | |
| 0,12 | 6,54 | 2,5438 | 0,2608 | |
| 0,06 | 6,88 | 2,6735 | 0,2583 |
De største reduksjonene dette kvartalet
Vi bruker endringen i porteføljeallokeringen fordi dette er det mest meningsfulle målet. Endringer kan skyldes handler eller endringer i aksjekurser.
| Verdipapirer | Aksjer (MM) |
Verdi (MM$) |
Portefølje % | ΔPortefølje % |
|---|---|---|---|---|
| 0,15 | 4,64 | 1,8052 | −0,6489 | |
| 0,05 | 3,89 | 1,5105 | −0,6446 | |
| 0,05 | 7,05 | 2,7399 | −0,6222 | |
| 0,19 | 6,90 | 2,6810 | −0,6200 | |
| 0,01 | 4,45 | 1,7309 | −0,4954 | |
| 0,04 | 5,60 | 2,1785 | −0,3466 | |
| 0,04 | 6,86 | 2,6682 | −0,3296 | |
| 0,00 | 1,43 | 0,5542 | −0,3221 | |
| 0,09 | 5,96 | 2,3181 | −0,3047 | |
| 0,23 | 5,59 | 2,1718 | −0,2709 |
13F- og Fondsarkiveringer
Dette skjemaet ble sendt inn den 2025-07-23 for rapporteringsperioden 2025-06-30. Klikk på lenkeikonet for å se hele transaksjonshistorikken.
Oppgradere for å låse opp premiedata og eksportere til Excel![]() .
.
| Verdipapirer | Type | Gjennomsnittlig aksjekurs | Aksjer (MM) |
ΔAksjer (%) |
ΔAksjer (%) |
Verdi ($MM) |
Portefølje (%) |
ΔPortefølje (%) |
|
|---|---|---|---|---|---|---|---|---|---|
| WFC / Wells Fargo & Company | 0,11 | −0,63 | 8,66 | 23,03 | 3,3665 | 0,2853 | |||
| TGT / Target Corporation | 0,07 | 1,82 | 7,16 | 7,88 | 2,7828 | −0,1220 | |||
| ABT / Abbott Laboratories | 0,05 | −11,63 | 7,05 | −8,23 | 2,7399 | −0,6222 | |||
| RTX / RTX Corporation | 0,05 | 0,61 | 6,97 | 13,98 | 2,7092 | 0,0328 | |||
| HD / The Home Depot, Inc. | 0,02 | 0,41 | 6,95 | 3,68 | 2,7024 | −0,2326 | |||
| CMCSA / Comcast Corporation | 0,19 | −12,85 | 6,90 | −8,54 | 2,6810 | −0,6200 | |||
| DELL / Dell Technologies Inc. | 0,06 | −13,78 | 6,88 | 24,67 | 2,6735 | 0,2583 | |||
| HSY / The Hershey Company | 0,04 | 0,61 | 6,86 | 0,22 | 2,6682 | −0,3296 | |||
| GLW / Corning Incorporated | 0,12 | −0,94 | 6,54 | 25,48 | 2,5438 | 0,2608 | |||
| NVS / Novartis AG - Depositary Receipt (Common Stock) | 0,05 | −0,93 | 6,35 | 8,14 | 2,4676 | −0,1019 | |||
| EOG / EOG Resources, Inc. | 0,05 | 1,52 | 6,22 | 9,90 | 2,4175 | −0,0598 | |||
| GRMN / Garmin Ltd. | 0,03 | 0,00 | 6,00 | 9,51 | 2,3326 | −0,0661 | |||
| CSCO / Cisco Systems, Inc. | 0,09 | −20,01 | 5,96 | −0,48 | 2,3181 | −0,3047 | |||
| CME / CME Group Inc. | 0,02 | −1,43 | 5,82 | 3,48 | 2,2636 | −0,1996 | |||
| MTB / M&T Bank Corporation | 0,03 | −0,34 | 5,77 | 20,68 | 2,2432 | 0,1498 | |||
| HIG / The Hartford Insurance Group, Inc. | 0,05 | −1,12 | 5,77 | 6,50 | 2,2409 | −0,1287 | |||
| CVX / Chevron Corporation | 0,04 | 0,21 | 5,70 | 4,07 | 2,2171 | −0,1817 | |||
| RF / Regions Financial Corporation | 0,24 | 0,14 | 5,64 | 21,95 | 2,1926 | 0,1683 | |||
| JNJ / Johnson & Johnson | 0,04 | 0,15 | 5,60 | −2,86 | 2,1785 | −0,3466 | |||
| PFE / Pfizer Inc. | 0,23 | −8,56 | 5,59 | 0,13 | 2,1718 | −0,2709 | |||
| UPS / United Parcel Service, Inc. | 0,05 | 2,34 | 5,43 | 7,14 | 2,1107 | −0,1079 | |||
| ADP / Automatic Data Processing, Inc. | 0,02 | −1,54 | 5,20 | 3,55 | 2,0197 | −0,1770 | |||
| APD / Air Products and Chemicals, Inc. | 0,02 | 0,13 | 5,19 | 7,43 | 2,0170 | −0,0972 | |||
| SWK / Stanley Black & Decker, Inc. | 0,07 | −8,87 | 4,90 | 7,91 | 1,9049 | −0,0828 | |||
| OMC / Omnicom Group Inc. | 0,07 | 1,76 | 4,79 | −0,04 | 1,8627 | −0,2358 | |||
| AVY / Avery Dennison Corporation | 0,03 | 22,73 | 4,79 | 26,06 | 1,8616 | 0,1985 | |||
| SBUX / Starbucks Corporation | 0,05 | 2,44 | 4,71 | 15,17 | 1,8292 | 0,0408 | |||
| CPB / The Campbell's Company | 0,15 | 1,42 | 4,64 | −17,16 | 1,8052 | −0,6489 | |||
| PPG / PPG Industries, Inc. | 0,04 | 0,40 | 4,59 | 14,15 | 1,7846 | 0,0240 | |||
| BKR / Baker Hughes Company | 0,12 | 75,73 | 4,51 | 73,17 | 1,7538 | 0,6132 | |||
| MSFT / Microsoft Corporation | 0,01 | 6,09 | 4,46 | 43,48 | 1,7318 | 0,3727 | |||
| WSO / Watsco, Inc. | 0,01 | 0,44 | 4,45 | −12,45 | 1,7309 | −0,4954 | |||
| TXN / Texas Instruments Incorporated | 0,02 | 0,77 | 4,31 | 40,94 | 1,6744 | 0,3367 | |||
| MRK / Merck & Co., Inc. | 0,05 | −22,23 | 3,89 | −21,08 | 1,5105 | −0,6446 | |||
| MDT / Medtronic plc | 0,03 | 2,80 | 1,0884 | 1,0884 | |||||
| GPS / The Gap, Inc. | 0,12 | 2,59 | 1,0079 | 1,0079 | |||||
| AAPL / Apple Inc. | 0,01 | 17,41 | 2,54 | 22,31 | 0,9868 | 0,0782 | |||
| JPM / JPMorgan Chase & Co. | 0,01 | 0,90 | 2,50 | 26,11 | 0,9727 | 0,1041 | |||
| NVDD / Direxion Shares ETF Trust - Direxion Daily NVDA Bear 1X Shares | 0,01 | 1,82 | 2,16 | 58,52 | 0,8395 | 0,2431 | |||
| V / Visa Inc. | 0,01 | −0,18 | 1,93 | 7,51 | 0,7516 | −0,0355 | |||
| APH / Amphenol Corporation | 0,02 | −1,35 | 1,89 | 49,68 | 0,7346 | 0,1821 | |||
| PH / Parker-Hannifin Corporation | 0,00 | 0,00 | 1,88 | 24,55 | 0,7296 | 0,0698 | |||
| AXP / American Express Company | 0,01 | 1,06 | 1,83 | 28,30 | 0,7103 | 0,0867 | |||
| FTXP / Foothills Exploration, Inc. | 0,00 | 0,10 | 1,75 | 41,31 | 0,6797 | 0,1382 | |||
| SO / The Southern Company | 0,02 | 0,00 | 1,66 | 0,00 | 0,6448 | −0,0811 | |||
| MCO / Moody's Corporation | 0,00 | 0,73 | 1,66 | 18,88 | 0,6440 | 0,0342 | |||
| AMZN / Amazon.com, Inc. | 0,01 | 57,90 | 1,62 | 100,62 | 0,6304 | 0,2767 | |||
| GNRC / Generac Holdings Inc. | 0,01 | −6,71 | 1,61 | 19,57 | 0,6250 | 0,0364 | |||
| AZN / AstraZeneca PLC - Depositary Receipt (Common Stock) | 0,02 | −0,12 | 1,59 | 3,32 | 0,6165 | −0,0558 | |||
| CB / Chubb Limited | 0,01 | 3,42 | 1,56 | 4,91 | 0,6061 | −0,0444 | |||
| TT / Trane Technologies plc | 0,00 | 1,81 | 1,45 | 33,64 | 0,5640 | 0,0889 | |||
| DECK / Deckers Outdoor Corporation | 0,01 | 8,15 | 1,44 | 5,48 | 0,5612 | −0,0378 | |||
| UNH / UnitedHealth Group Incorporated | 0,00 | 3,65 | 1,43 | −28,79 | 0,5542 | −0,3221 | |||
| LULU / lululemon athletica inc. | 0,01 | 13,74 | 1,41 | 7,58 | 0,5465 | −0,0253 | |||
| CDNS / Cadence Design Systems, Inc. | 0,00 | 0,62 | 1,40 | 19,15 | 0,5444 | 0,0299 | |||
| SYK / Stryker Corporation | 0,00 | 1,23 | 1,40 | 15,63 | 0,5436 | 0,0140 | |||
| TREX / Trex Company, Inc. | 0,02 | 5,67 | 1,35 | 3,38 | 0,5233 | −0,0469 | |||
| LIN / Linde plc | 0,00 | 12,05 | 1,31 | 16,36 | 0,5089 | 0,0161 | |||
| IBM / International Business Machines Corporation | 0,00 | −9,54 | 1,26 | 11,63 | 0,4889 | −0,0041 | |||
| GOOGL / Alphabet Inc. | 0,01 | 6,55 | 1,25 | 24,21 | 0,4870 | 0,0455 | |||
| BRO / Brown & Brown, Inc. | 0,01 | 1,34 | 1,17 | −4,17 | 0,4554 | −0,0796 | |||
| TMO / Thermo Fisher Scientific Inc. | 0,00 | 4,63 | 1,16 | −0,77 | 0,4527 | −0,0610 | |||
| ORLY / O'Reilly Automotive, Inc. | 0,01 | 1 425,39 | 1,16 | −1,19 | 0,4505 | −0,0627 | |||
| AME / AMETEK, Inc. | 0,01 | 2,65 | 1,13 | 17,75 | 0,4386 | 0,0190 | |||
| TJX / The TJX Companies, Inc. | 0,01 | 1,53 | 1,11 | −1,78 | 0,4301 | −0,0629 | |||
| GE / General Electric Company | 0,00 | 1,74 | 0,98 | 44,17 | 0,3796 | 0,0829 | |||
| TSM / Taiwan Semiconductor Manufacturing Company Limited - Depositary Receipt (Common Stock) | 0,00 | 0,96 | 0,3717 | 0,3717 | |||||
| META / Meta Platforms, Inc. | 0,00 | 0,00 | 0,93 | 47,31 | 0,3621 | 0,0851 | |||
| ED / Consolidated Edison, Inc. | 0,01 | 0,00 | 0,83 | −10,48 | 0,3225 | −0,0832 | |||
| IT / Gartner, Inc. | 0,00 | 1,91 | 0,80 | 2,57 | 0,3102 | −0,0304 | |||
| RSP / Invesco Exchange-Traded Fund Trust - Invesco S&P 500 Equal Weight ETF | 0,00 | −1,36 | 0,74 | 10,13 | 0,2876 | −0,0062 | |||
| EFA / iShares Trust - iShares MSCI EAFE ETF | 0,01 | 10,19 | 0,61 | 21,56 | 0,2368 | 0,0172 | |||
| IVV / iShares Trust - iShares Core S&P 500 ETF | 0,00 | 5,88 | 0,57 | 24,24 | 0,2216 | 0,0209 | |||
| XOM / Exxon Mobil Corporation | 0,00 | 0,00 | 0,54 | 0,94 | 0,2093 | −0,0245 | |||
| TSLA / Tesla, Inc. | 0,00 | −0,61 | 0,51 | 30,79 | 0,1999 | 0,0278 | |||
| GEV / GE Vernova Inc. | 0,00 | 0,97 | 0,50 | 65,33 | 0,1929 | 0,0614 | |||
| CAT / Caterpillar Inc. | 0,00 | 0,00 | 0,47 | 32,11 | 0,1824 | 0,0267 | |||
| GOOG / Alphabet Inc. | 0,00 | 0,00 | 0,37 | 15,67 | 0,1438 | 0,0038 | |||
| FNCL / Fidelity Covington Trust - Fidelity MSCI Financials Index ETF | 0,00 | 6,16 | 0,31 | 21,24 | 0,1221 | 0,0086 | |||
| UBER / Uber Technologies, Inc. | 0,00 | 0,30 | 0,31 | 24,39 | 0,1193 | 0,0113 | |||
| DE / Deere & Company | 0,00 | 0,00 | 0,29 | 12,74 | 0,1136 | −0,0001 | |||
| FHLC / Fidelity Covington Trust - Fidelity MSCI Health Care Index ETF | 0,00 | 13,77 | 0,29 | 14,74 | 0,1121 | 0,0020 | |||
| FTEC / Fidelity Covington Trust - Fidelity MSCI Information Technology Index ETF | 0,00 | 2,31 | 0,28 | 34,13 | 0,1088 | 0,0176 | |||
| DIS / The Walt Disney Company | 0,00 | 0,27 | 0,1052 | 0,1052 | |||||
| ETN / Eaton Corporation plc | 0,00 | 0,27 | 0,1043 | 0,1043 | |||||
| FIDU / Fidelity Covington Trust - Fidelity MSCI Industrials Index ETF | 0,00 | −1,71 | 0,27 | 15,65 | 0,1037 | 0,0030 | |||
| AXON / Axon Enterprise, Inc. | 0,00 | 0,26 | 0,0991 | 0,0991 | |||||
| FDIS / Fidelity Covington Trust - Fidelity MSCI Consumer Discretionary Index ETF | 0,00 | 0,24 | 0,0921 | 0,0921 | |||||
| BA / The Boeing Company | 0,00 | 0,23 | 0,0883 | 0,0883 | |||||
| IWR / iShares Trust - iShares Russell Mid-Cap ETF | 0,00 | 0,22 | 0,0866 | 0,0866 | |||||
| ULTA / Ulta Beauty, Inc. | 0,00 | −100,00 | 0,00 | 0,0000 |