Grunnleggende statistikk
| Institusjonelle eiere | 298 total, 298 long only, 0 short only, 0 long/short - change of −1,64% MRQ |
| Gjennomsnittlig porteføljeallokering | 0.1909 % - change of 4,29% MRQ |
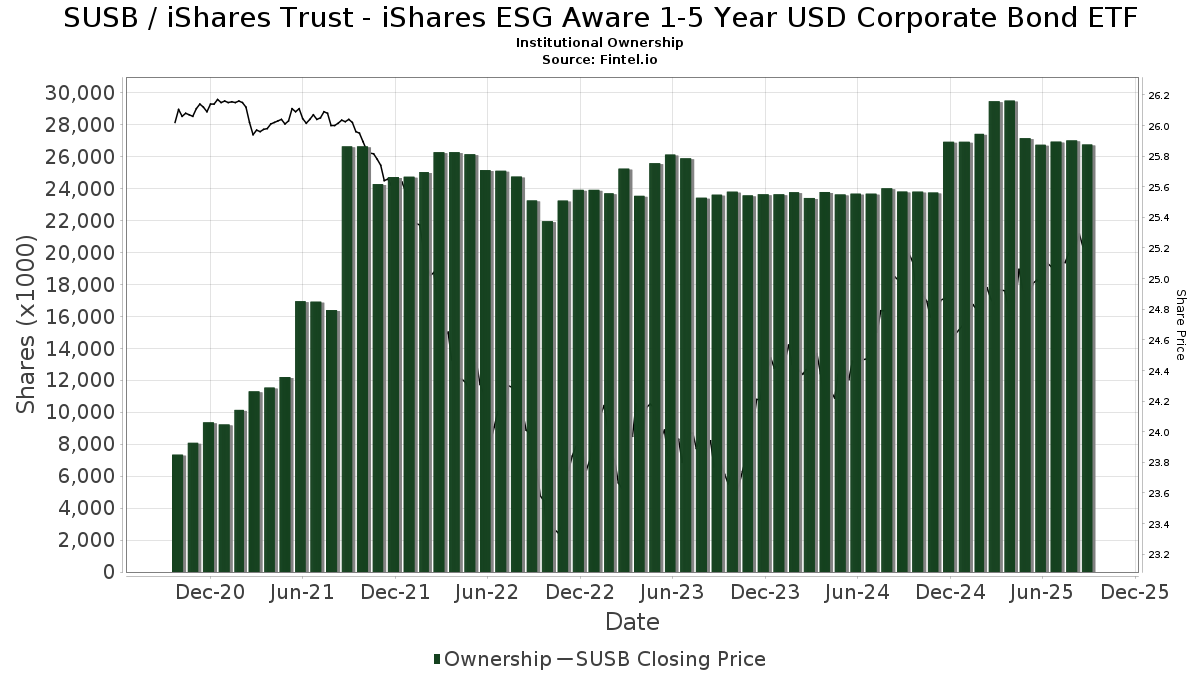
| Institusjonelle aksjer (Long) | 26 748 130 (ex 13D/G) - change of −0,18MM shares −0,66% MRQ |
| Institusjonell verdi (Long) | $ 627 168 USD ($1000) |
Institusjonelt eierskap og aksjonærer
iShares Trust - iShares ESG Aware 1-5 Year USD Corporate Bond ETF (US:SUSB) har 298 institusjonelle eiere og aksjonærer som har sendt inn 13D/G- eller 13F-skjemaer til Securities Exchange Commission (SEC). Disse institusjonene eier til sammen 26,748,130 aksjer. De største aksjonærene inkluderer Goldman Sachs Group Inc, LPL Financial LLC, Morgan Stanley, Royal Bank Of Canada, Ameriprise Financial Inc, Envestnet Asset Management Inc, Acorns Advisers, LLC, Bank of New York Mellon Corp, Wells Fargo & Company/mn, and Modera Wealth Management, LLC .
iShares Trust - iShares ESG Aware 1-5 Year USD Corporate Bond ETF (NasdaqGM:SUSB) institusjonell eierstruktur viser nåværende posisjoner i selskapet fordelt på institusjoner og fond, samt de siste endringene i posisjonsstørrelse. De største aksjonærene kan være individuelle investorer, verdipapirfond, hedgefond eller institusjoner. Schedule 13D indikerer at investoren eier (eller har eid) mer enn 5 % av selskapet og har til hensikt (eller hadde til hensikt) å aktivt forfølge en endring i forretningsstrategien. Schedule 13G indikerer en passiv investering på over 5 %.
The share price as of September 12, 2025 is 25,30 / share. Previously, on September 13, 2024, the share price was 25,13 / share. This represents an increase of 0,68% over that period.
Fondssentiment-score
Fondssentiment Score (også kjent som akkumulering av eierskap poengsum) viser hvilke aksjer som er mest kjøpt av fond. Den er resultatet av en sofistikert, kvantitativ flerfaktormodell som identifiserer selskaper med de høyeste nivåene av institusjonell akkumulering. Beregningsmodellen for poeng bruker en kombinasjon av den totale økningen i antall offentliggjorte eiere, endringer i porteføljeallokeringen til disse eierne og andre beregninger. Tallet går fra 0 til 100, der høyere tall indikerer en høyere grad av akkumulering i forhold til sammenlignbare selskaper, der 50 er gjennomsnittet.
Oppdateringsfrekvens: Daglig
Sjekk ut Ownership Explorer, som inneholder en liste over de høyest rangerte selskapene.
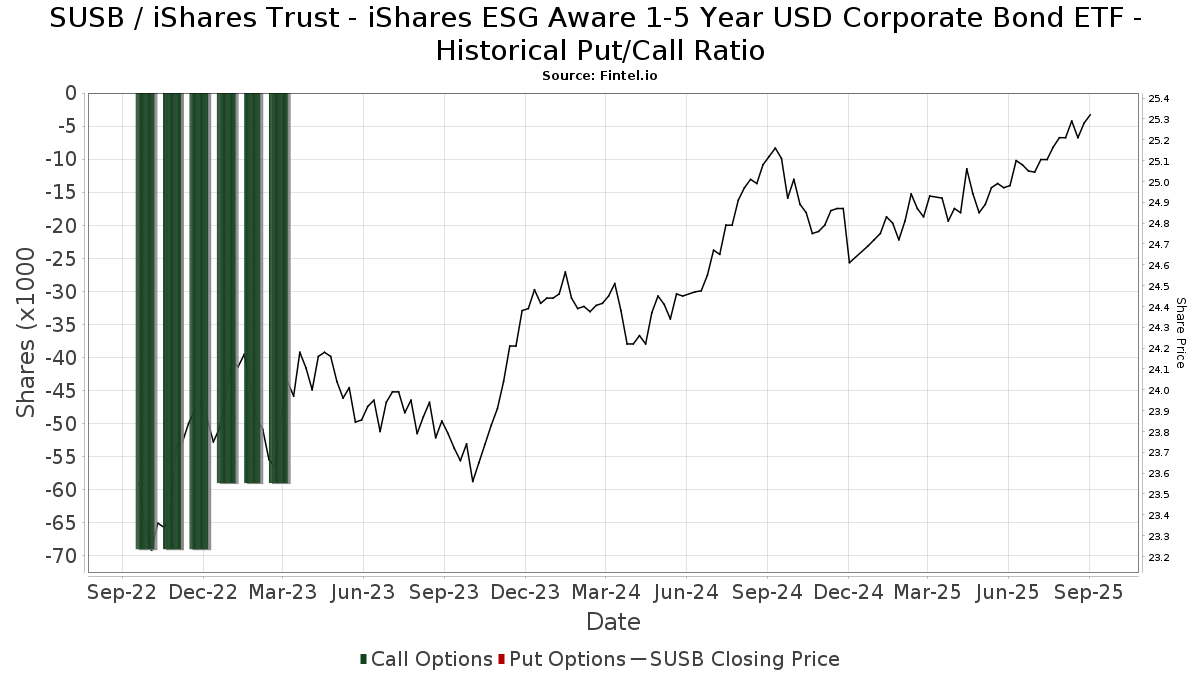
Institusjonell Put/Call-forhold
I tillegg til å rapportere standard aksje- og gjeldsemisjoner må institusjoner med mer enn 100 millioner kroner i forvaltningskapital også oppgi beholdningen av put- og callopsjoner. Siden put-opsjoner generelt indikerer et negativt sentiment, og call-opsjoner indikerer et positivt sentiment, kan vi få et inntrykk av det generelle institusjonelle sentimentet ved å plotte forholdet mellom put- og call-opsjoner. Diagrammet til høyre viser det historiske forholdet mellom put- og call-opsjoner for dette instrumentet.
Ved å bruke Put/Call-forholdet som en indikator på investorsentimentet kan man overvinne en av de viktigste svakhetene ved å bruke totalt institusjonelt eierskap, nemlig at en betydelig andel av forvaltningskapitalen investeres passivt for å følge indekser. Passivt forvaltede fond kjøper vanligvis ikke opsjoner, slik at indikatoren for put/call-forhold i større grad gjenspeiler stemningen i aktivt forvaltede fond.
13F- og NPORT-arkiveringer
Detaljer om 13F-arkiveringer er gratis. Detaljer om NP-arkiveringer krever et premium-medlemskap. Grønne rader indikerer nye posisjoner. Røde rader indikerer lukkede posisjoner. Klikk på lenke ikonet for å se hele transaksjonshistorikken.
Oppgrader
for å låse opp premiedata og eksportere til Excel. ![]() .
.
| Fildato | Kilde | Investor | Type | Gjennomsnittlig pris (estimert) |
Aksjer | Δ Aksjer (%) |
Rapportert verdi ($1000) | Verdi (%) | Portallokering (%) | |
|---|---|---|---|---|---|---|---|---|---|---|
| 2025-07-24 | 13F | Morton Brown Family Wealth, LLC | 4 288 | 4,51 | 108 | 4,90 | ||||
| 2025-04-29 | 13F | Hm Payson & Co | 6 400 | 0,00 | 160 | 0,63 | ||||
| 2025-05-16 | 13F/A | Kestra Investment Management, LLC | 0 | −100,00 | 0 | |||||
| 2025-07-23 | 13F | Sachetta, LLC | 1 744 | 0,00 | 44 | 0,00 | ||||
| 2025-08-12 | 13F | Global Retirement Partners, LLC | 486 | −2,99 | 12 | 0,00 | ||||
| 2025-07-25 | 13F | Community Bank, N.A. | 75 | 0,00 | 2 | 0,00 | ||||
| 2025-07-16 | 13F | Evergreen Private Wealth LLC | 7 026 | 7,93 | 177 | 8,64 | ||||
| 2025-07-15 | 13F | Level Financial Advisors, Inc. | 36 186 | −2,15 | 911 | −1,52 | ||||
| 2025-08-13 | 13F | Parkworth Wealth Management, Inc. | 3 980 | 1,09 | 100 | 2,04 | ||||
| 2025-08-15 | 13F | Truefg, Llc | 14 759 | −1,79 | 371 | −1,07 | ||||
| 2025-07-31 | 13F | Buckingham Strategic Partners | 19 081 | 16,62 | 480 | 17,65 | ||||
| 2025-08-12 | 13F | Coston, McIsaac & Partners | 172 | 0,58 | 0 | |||||
| 2025-08-14 | 13F | Susquehanna International Group, Llp | 61 700 | 387,59 | 1 553 | 391,14 | ||||
| 2025-07-24 | 13F | Grand Wealth Management, Llc | 9 810 | −0,87 | 247 | −0,40 | ||||
| 2025-07-15 | 13F | Td Private Client Wealth Llc | 48 540 | 0,00 | 1 222 | 0,66 | ||||
| 2025-07-22 | 13F | Stanich Group LLC | 0 | −100,00 | 0 | |||||
| 2025-07-29 | 13F | Flagstone Financial Management | 81 593 | 2,59 | 2 054 | 3,32 | ||||
| 2025-08-05 | 13F | Sigma Planning Corp | 11 770 | −4,93 | 296 | −4,21 | ||||
| 2025-08-15 | 13F | Captrust Financial Advisors | 41 358 | 0,07 | 1 041 | 0,78 | ||||
| 2025-07-09 | 13F | Finley Financial, LLC | 6 150 | 0,00 | 155 | 0,00 | ||||
| 2025-07-16 | 13F | Plancorp, LLC | 147 281 | 0,00 | 3 707 | 0,73 | ||||
| 2025-08-19 | 13F | Advisory Services Network, LLC | 47 517 | −59,26 | 1 193 | −59,06 | ||||
| 2025-08-13 | 13F | Transce3nd, LLC | 900 | −3,12 | 23 | −4,35 | ||||
| 2025-07-10 | 13F | CWC Advisors, LLC. | 8 238 | −0,10 | 207 | 0,49 | ||||
| 2025-07-30 | 13F | Ethic Inc. | 28 180 | −63,59 | 708 | −63,30 | ||||
| 2025-05-14 | 13F | Oarsman Capital, Inc. | 0 | −100,00 | 0 | |||||
| 2025-08-14 | 13F | GWM Advisors LLC | 54 241 | 1,09 | 1 365 | 1,87 | ||||
| 2025-08-07 | 13F | Payden & Rygel | 88 579 | 0,00 | 2 | 0,00 | ||||
| 2025-08-12 | 13F | BlackRock, Inc. | 832 | −20,08 | 21 | −23,08 | ||||
| 2025-08-07 | 13F | Brio Consultants, LLC | 109 527 | −5,08 | 2 757 | −4,41 | ||||
| 2025-04-21 | 13F | ORG Partners LLC | 0 | −100,00 | 0 | |||||
| 2025-05-08 | 13F | Endeavor Private Wealth, Inc. | 0 | −100,00 | 0 | |||||
| 2025-08-07 | 13F | Allworth Financial LP | 430 701 | 2,24 | 10 841 | 3,14 | ||||
| 2025-07-31 | 13F | Silver Oak Advisory Group, Inc. | 12 520 | 0,14 | 0 | |||||
| 2025-04-22 | 13F | Veridan Wealth LLC | 13 479 | −25,13 | 337 | −24,49 | ||||
| 2025-08-14 | 13F | Atomi Financial Group, Inc. | 9 565 | 8,20 | 241 | 9,09 | ||||
| 2025-07-14 | 13F | Opal Wealth Advisors, LLC | 39 976 | −5,79 | 1 006 | −5,09 | ||||
| 2025-08-11 | 13F | United Capital Financial Advisers, Llc | 41 615 | −21,69 | 1 047 | −21,16 | ||||
| 2025-05-13 | 13F | LifePlan Investment Advisors, Inc. | 0 | −100,00 | 0 | |||||
| 2025-08-14 | 13F/A | Bank Julius Baer & Co. Ltd, Zurich | 26 000 | 13,02 | 654 | 0,77 | ||||
| 2025-07-31 | 13F | Schneider Downs Wealth Management Advisors, LP | 42 694 | 0,00 | 1 075 | 0,75 | ||||
| 2025-08-14 | 13F | Bnp Paribas Arbitrage, Sa | 88 | 1 000,00 | 2 | |||||
| 2025-08-14 | 13F | Clarity Asset Management, Inc. | 4 951 | −1,35 | 125 | −0,80 | ||||
| 2025-07-17 | 13F | LexAurum Advisors, LLC | 18 812 | 6,19 | 474 | 7,01 | ||||
| 2025-08-13 | 13F | Cerity Partners LLC | 8 013 | 0,00 | 202 | 0,50 | ||||
| 2025-07-28 | 13F | J.Safra Asset Management Corp | 39 506 | 0,00 | 993 | 0,61 | ||||
| 2025-07-11 | 13F | Westfuller Advisors, LLC | 28 382 | 0,83 | 714 | 1,56 | ||||
| 2025-07-29 | 13F | BKD Wealth Advisors, LLC | 21 886 | 0,00 | 551 | 0,73 | ||||
| 2025-07-14 | 13F | Sweeney & Michel, Llc | 8 522 | −0,37 | 213 | 0,95 | ||||
| 2025-08-08 | 13F | Creative Planning | 8 136 | −29,04 | 205 | −28,67 | ||||
| 2025-08-05 | 13F | Scarborough Advisors, LLC | 19 | 0 | ||||||
| 2025-08-08 | 13F | Francis Financial, Inc. | 393 692 | −2,41 | 9 909 | −1,71 | ||||
| 2025-08-06 | 13F | AE Wealth Management LLC | 3 357 | −0,03 | 84 | 1,20 | ||||
| 2025-08-12 | 13F | MAI Capital Management | 8 870 | −0,74 | 223 | 0,00 | ||||
| 2025-07-03 | 13F | Higgins & Schmidt Wealth Strategies LLC | 8 659 | 218 | ||||||
| 2025-07-11 | 13F/A | Umb Bank N A/mo | 56 096 | 12,05 | 1 412 | 12,79 | ||||
| 2025-08-08 | 13F | VERITY Wealth Advisors | 26 322 | 0,00 | 663 | 0,76 | ||||
| 2025-07-09 | 13F | Affinity Capital Advisors, LLC | 10 861 | 0,11 | 273 | 2,25 | ||||
| 2025-08-08 | 13F | Larson Financial Group LLC | 19 321 | 1,63 | 486 | 2,32 | ||||
| 2025-08-08 | 13F | Financial Gravity Companies, Inc. | 4 916 | 0,63 | 124 | 2,50 | ||||
| 2025-08-11 | 13F | Wealthspire Advisors, LLC | 479 307 | 1,93 | 12 064 | 2,66 | ||||
| 2025-05-15 | 13F | Guardian Wealth Advisors, Llc / Nc | 0 | −100,00 | 0 | |||||
| 2025-08-14 | 13F | Mml Investors Services, Llc | 28 452 | −15,86 | 1 | |||||
| 2025-05-06 | 13F | PFG Advisors | 0 | −100,00 | 0 | −100,00 | ||||
| 2025-04-28 | 13F | Financial Advocates Investment Management | 0 | −100,00 | 0 | |||||
| 2025-08-14 | 13F | Mercer Global Advisors Inc /adv | 13 233 | 0,08 | 333 | 0,91 | ||||
| 2025-08-14 | 13F | Fiduciary Trust Co | 111 973 | −5,17 | 2 818 | −4,47 | ||||
| 2025-08-08 | 13F | Your Advocates Ltd., LLP | 471 | 0,00 | 12 | 0,00 | ||||
| 2025-07-25 | 13F | Wells Financial Advisors INC | 10 660 | 0,00 | 268 | 0,75 | ||||
| 2025-08-04 | 13F | One Day In July LLC | 23 310 | −1,39 | 587 | −0,68 | ||||
| 2025-07-29 | 13F | Tradewinds Capital Management, LLC | 227 | 11,82 | 6 | 0,00 | ||||
| 2025-08-05 | 13F | GPS Wealth Strategies Group, LLC | 677 | 0,00 | 17 | 6,25 | ||||
| 2025-08-12 | 13F | Steward Partners Investment Advisory, Llc | 5 929 | −4,05 | 149 | −3,25 | ||||
| 2025-07-17 | 13F | One Wealth Advisors, LLC | 22 449 | −13,17 | 565 | −12,54 | ||||
| 2025-08-14 | 13F | Jane Street Group, Llc | 45 667 | 65,88 | 1 149 | 67,25 | ||||
| 2025-08-14 | 13F | Wells Fargo & Company/mn | 513 122 | 1,95 | 12 915 | 2,69 | ||||
| 2025-08-14 | 13F | Ancora Advisors, LLC | 4 283 | 0,00 | 108 | 0,00 | ||||
| 2025-07-21 | 13F | Impact Investors, Inc | 300 236 | 11,04 | 7 557 | 11,84 | ||||
| 2025-08-01 | 13F | Equita Financial Network, Inc. | 8 558 | 215 | ||||||
| 2025-07-22 | 13F | Valley National Advisers Inc | 10 028 | 1,69 | 0 | |||||
| 2025-08-14 | 13F | Staley Capital Advisers Inc | 70 000 | 40,00 | 1 762 | 40,99 | ||||
| 2025-08-15 | 13F | WFA of San Diego, LLC | 5 501 | 7,32 | 138 | 7,81 | ||||
| 2025-08-07 | 13F | Verus Capital Partners, Llc | 0 | −100,00 | 0 | |||||
| 2025-07-07 | 13F | Shotwell Rutter Baer Inc | 19 598 | −0,47 | 491 | −0,20 | ||||
| 2025-07-22 | 13F | DT Investment Partners, LLC | 910 | 11,11 | 23 | 10,00 | ||||
| 2025-07-30 | 13F | Nottingham Advisors, Inc. | 12 810 | −1,06 | 322 | −0,31 | ||||
| 2025-07-10 | 13F | Marshall Financial Group LLC | 13 831 | −2,90 | 346 | −2,54 | ||||
| 2025-05-12 | 13F | Austin Private Wealth, LLC | 0 | −100,00 | 0 | |||||
| 2025-08-14 | 13F | Wiley Bros.-aintree Capital, Llc | 0 | −100,00 | 0 | |||||
| 2025-08-12 | 13F | Seeds Investor Llc | 155 199 | −5,08 | 3 906 | −4,41 | ||||
| 2025-08-26 | 13F/A | Thrivent Financial For Lutherans | 21 177 | −74,19 | 1 | −100,00 | ||||
| 2025-08-05 | 13F | American Capital Advisory, LLC | 5 890 | 0,00 | 148 | 0,68 | ||||
| 2025-08-12 | 13F | Franklin Resources Inc | 34 041 | 1,09 | 857 | 1,78 | ||||
| 2025-05-06 | 13F | Kelman-Lazarov, Inc. | 0 | −100,00 | 0 | |||||
| 2025-08-11 | 13F | HighTower Advisors, LLC | 98 097 | −3,87 | 2 469 | −3,18 | ||||
| 2025-08-14 | 13F | Royal Bank Of Canada | 943 705 | 1,61 | 23 752 | 2,34 | ||||
| 2025-07-31 | 13F | Cambridge Investment Research Advisors, Inc. | 67 984 | −7,24 | 2 | 0,00 | ||||
| 2025-08-05 | 13F | Gould Asset Management Llc /ca/ | 23 055 | 11,38 | 580 | 12,19 | ||||
| 2025-07-23 | 13F | Integris Wealth Management, LLC | 267 597 | −4,97 | 6 735 | −4,28 | ||||
| 2025-08-11 | 13F | Birchbrook, Inc. | 38 488 | 21,43 | 969 | 22,22 | ||||
| 2025-05-09 | 13F | Deutsche Bank Ag\ | 0 | −100,00 | 0 | −100,00 | ||||
| 2025-07-09 | 13F | Dynamic Advisor Solutions LLC | 140 343 | −7,58 | 3 532 | −6,91 | ||||
| 2025-05-15 | 13F/A | Orion Portfolio Solutions, LLC | 8 365 | −40,84 | 209 | −40,11 | ||||
| 2025-07-10 | 13F | IMPACTfolio, LLC | 233 048 | 81,65 | 5 866 | 82,94 | ||||
| 2025-07-21 | 13F | Empirical Financial Services, LLC d.b.a. Empirical Wealth Management | 81 727 | 3,61 | 2 057 | 4,36 | ||||
| 2025-08-05 | 13F | Bank Of Montreal /can/ | 22 121 | 79,00 | 557 | 80,52 | ||||
| 2025-08-08 | 13F | Omega Financial Group, LLC | 72 898 | 0,58 | 1 835 | 1,27 | ||||
| 2025-04-29 | 13F | Pensionmark Financial Group, Llc | 0 | −100,00 | 0 | |||||
| 2025-08-01 | 13F | Rossby Financial, LCC | 0 | −100,00 | 0 | |||||
| 2025-08-12 | 13F | Ameritas Investment Partners, Inc. | 24 737 | −1,93 | 623 | −1,27 | ||||
| 2025-04-22 | 13F/A | NorthRock Partners, LLC | 0 | −100,00 | 0 | −100,00 | ||||
| 2025-08-11 | 13F | FSC Wealth Advisors, LLC | 1 169 | 0,00 | 29 | 0,00 | ||||
| 2025-08-14 | 13F | Comerica Bank | 10 628 | 39,62 | 268 | 40,53 | ||||
| 2025-08-13 | 13F | Trustmark National Bank Trust Department | 10 168 | 0,00 | 256 | 0,39 | ||||
| 2025-08-13 | 13F | Baird Financial Group, Inc. | 416 825 | 0,12 | 10 491 | 0,84 | ||||
| 2025-08-08 | 13F | Emerald Investment Partners, Llc | 799 | 0,00 | 20 | 5,26 | ||||
| 2025-08-14 | 13F | Two Sigma Securities, Llc | 14 538 | 366 | ||||||
| 2025-08-13 | 13F | Johnson Financial Group, Inc. | 2 953 | 0,00 | 74 | 1,37 | ||||
| 2025-08-14 | 13F | Gen-Wealth Partners Inc | 289 | −18,59 | 7 | −12,50 | ||||
| 2025-08-11 | 13F | Amara Financial, Llc. | 9 667 | 15,98 | 243 | 16,83 | ||||
| 2025-04-15 | 13F | McKinley Carter Wealth Services, Inc. | 0 | −100,00 | 0 | |||||
| 2025-08-08 | 13F | Pnc Financial Services Group, Inc. | 974 | −0,41 | 25 | 0,00 | ||||
| 2025-07-21 | 13F | Ameritas Advisory Services, LLC | 6 925 | −53,65 | 174 | −53,35 | ||||
| 2025-07-10 | 13F | Oliver Lagore Vanvalin Investment Group | 0 | −100,00 | 0 | |||||
| 2025-08-05 | 13F | Hills Bank & Trust Co | 5 577 | 13,52 | 140 | 14,75 | ||||
| 2025-07-18 | 13F | First Pacific Financial | 8 224 | 1,09 | 207 | 1,48 | ||||
| 2025-08-14 | 13F | Ameriprise Financial Inc | 779 912 | 3,82 | 20 292 | 8,07 | ||||
| 2025-07-21 | 13F | Ameriflex Group, Inc. | 1 448 | 1,12 | 36 | 2,86 | ||||
| 2025-07-17 | 13F | Albion Financial Group /ut | 48 563 | 6,50 | 1 222 | 7,29 | ||||
| 2025-07-21 | 13F | Creative Capital Management Investments LLC | 2 991 | −80,28 | 75 | −80,16 | ||||
| 2025-07-29 | 13F | Kondo Wealth Advisors, Inc. | 106 300 | −20,26 | 2 664 | −20,05 | ||||
| 2025-08-11 | 13F | VSM Wealth Advisory, LLC | 3 918 | 9,78 | 99 | 10,11 | ||||
| 2025-08-11 | 13F | Aptus Capital Advisors, LLC | 23 337 | 0,21 | 587 | 1,03 | ||||
| 2025-07-24 | 13F | Eastern Bank | 15 132 | −86,76 | 381 | −86,69 | ||||
| 2025-07-22 | 13F | Wealthcare Advisory Partners LLC | 15 429 | 388 | ||||||
| 2025-08-13 | 13F | VestGen Advisors, LLC | 23 988 | −1,63 | 604 | −0,99 | ||||
| 2025-05-08 | 13F | Us Financial Advisors, Llc | 11 546 | 11,79 | 289 | 12,94 | ||||
| 2025-04-09 | 13F | RFG Advisory, LLC | 0 | −100,00 | 0 | |||||
| 2025-07-18 | 13F | PFG Investments, LLC | 8 988 | −17,60 | 226 | −16,91 | ||||
| 2025-05-13 | 13F | EverSource Wealth Advisors, LLC | 0 | −100,00 | 0 | |||||
| 2025-08-13 | 13F | Congress Wealth Management LLC / DE / | 15 982 | 0,01 | 402 | 0,75 | ||||
| 2025-07-17 | 13F | Symmetry Partners, LLC | 14 608 | −0,04 | 368 | 0,55 | ||||
| 2025-07-24 | 13F | Us Bancorp \de\ | 3 640 | −85,87 | 92 | −85,85 | ||||
| 2025-07-14 | 13F | Leonard Rickey Investment Advisors P.L.L.C. | 46 170 | −7,44 | 1 162 | −5,91 | ||||
| 2025-08-08 | 13F | Atlantic Trust, LLC | 3 144 | 79 | ||||||
| 2025-08-14 | 13F | Colony Group, LLC | 56 038 | −8,63 | 1 410 | −7,96 | ||||
| 2025-04-30 | 13F | Horst & Graben Wealth Management LLC | 0 | −100,00 | 0 | |||||
| 2025-07-17 | 13F | Janney Montgomery Scott LLC | 13 927 | 0 | ||||||
| 2025-07-23 | 13F | Dohj, Llc | 0 | −100,00 | 0 | |||||
| 2025-08-14 | 13F | Raymond James Financial Inc | 42 752 | 5,05 | 1 076 | 5,80 | ||||
| 2025-07-25 | 13F | Atria Wealth Solutions, Inc. | 8 681 | −4,46 | 217 | −4,41 | ||||
| 2025-07-25 | 13F | LRI Investments, LLC | 9 326 | 0,00 | 235 | 0,43 | ||||
| 2025-07-07 | 13F | Bangor Savings Bank | 1 680 | 0,00 | 42 | 2,44 | ||||
| 2025-07-08 | 13F | Apella Capital, LLC | 226 647 | 3,12 | 5 671 | 3,98 | ||||
| 2025-07-16 | 13F | Traveka Wealth, LLC | 17 828 | 0,12 | 449 | 0,90 | ||||
| 2025-08-06 | 13F | Decker Retirement Planning Inc. | 39 453 | 57 078,26 | 993 | 99 200,00 | ||||
| 2025-08-04 | 13F | Spire Wealth Management | 299 | 0,00 | 8 | 0,00 | ||||
| 2025-04-22 | 13F | Jfs Wealth Advisors, Llc | 0 | −100,00 | 0 | |||||
| 2025-05-12 | 13F | Townsquare Capital Llc | 0 | −100,00 | 0 | |||||
| 2025-08-08 | 13F | Cetera Investment Advisers | 89 674 | −2,38 | 2 257 | −1,66 | ||||
| 2025-07-10 | 13F | Charter Oak Capital Management, LLC | 133 360 | 2,85 | 3 357 | 3,58 | ||||
| 2025-07-22 | 13F | Clarius Group, LLC | 57 435 | −1,39 | 1 446 | −0,69 | ||||
| 2025-07-11 | 13F | Farther Finance Advisors, LLC | 5 260 | 32,26 | 132 | 33,33 | ||||
| 2025-07-28 | 13F | Arlington Financial Advisors, LLC | 163 051 | −4,57 | 4 104 | −3,89 | ||||
| 2025-07-31 | 13F | Orion Capital Management LLC | 8 901 | −0,18 | 224 | 0,90 | ||||
| 2025-08-12 | 13F | Armor Investment Advisors, LLC | 6 913 | 0,00 | 174 | 1,16 | ||||
| 2025-08-12 | 13F | LPL Financial LLC | 1 117 604 | 3,03 | 28 130 | 3,77 | ||||
| 2025-07-09 | 13F | Alesco Advisors Llc | 9 994 | 0,39 | 252 | 1,21 | ||||
| 2025-08-14 | 13F | Stifel Financial Corp | 85 993 | 7,89 | 2 164 | 8,69 | ||||
| 2025-07-25 | 13F | Wealth Advisory Team LLC | 22 151 | 558 | ||||||
| 2025-08-12 | 13F | Running Point Capital Advisors, LLC | 4 078 | 0,00 | 103 | 0,99 | ||||
| 2025-08-07 | 13F | CENTRAL TRUST Co | 22 276 | −34,89 | 561 | −34,50 | ||||
| 2025-08-14 | 13F | Diversify Advisory Services, LLC | 0 | −100,00 | 0 | |||||
| 2025-08-13 | 13F | Flow Traders U.s. Llc | 68 743 | 2 | ||||||
| 2025-07-02 | 13F | Central Pacific Bank - Trust Division | 23 898 | 81,96 | 602 | 83,23 | ||||
| 2025-07-16 | 13F | Diversified Enterprises, LLC | 22 959 | 37,80 | 578 | 38,70 | ||||
| 2025-04-28 | 13F | First Horizon Advisors, Inc. | 0 | −100,00 | 0 | |||||
| 2025-07-14 | 13F | AdvisorNet Financial, Inc | 8 970 | 175,75 | 226 | 177,78 | ||||
| 2025-07-30 | 13F | Rehmann Capital Advisory Group | 14 446 | 0,89 | 364 | 1,68 | ||||
| 2025-08-14 | 13F | Mariner, LLC | 382 178 | 0,20 | 9 619 | 0,92 | ||||
| 2025-05-14 | 13F | Van Hulzen Asset Management, LLC | 0 | −100,00 | 0 | −100,00 | ||||
| 2025-07-25 | 13F | Midwest Capital Advisors, LLC | 16 749 | −2,26 | 422 | −1,64 | ||||
| 2025-08-01 | 13F | Redwood Park Advisors LLC | 0 | −100,00 | 0 | |||||
| 2025-08-07 | 13F | LFA - Lugano Financial Advisors SA | 457 113 | 91,30 | 11 421 | 91,27 | ||||
| 2025-04-09 | 13F | SigFig Wealth Management, LLC | 0 | −100,00 | 0 | |||||
| 2025-08-14 | 13F | Financial Engines Advisors L.L.C. | 281 233 | −7,59 | 7 079 | −6,93 | ||||
| 2025-08-12 | 13F | Fortis Capital Management LLC | 0 | −100,00 | 0 | |||||
| 2025-08-15 | 13F | CI Private Wealth, LLC | 148 214 | −0,48 | 3 731 | 0,24 | ||||
| 2025-07-24 | 13F | Blair William & Co/il | 42 163 | 0,73 | 1 061 | 1,43 | ||||
| 2025-08-12 | 13F | Proequities, Inc. | 0 | 0 | ||||||
| 2025-07-22 | 13F | Mascoma Wealth Management LLC | 8 941 | −16,01 | 225 | −15,41 | ||||
| 2025-07-16 | 13F/A | CX Institutional | 33 961 | 0,43 | 1 | |||||
| 2025-08-06 | 13F | Savant Capital, LLC | 445 745 | 3,82 | 11 219 | 4,58 | ||||
| 2025-08-11 | 13F | Wescott Financial Advisory Group, LLC | 204 568 | 4,00 | 5 149 | 4,74 | ||||
| 2025-08-11 | 13F | Arrow Financial Corp | 24 545 | 0,00 | 618 | 0,65 | ||||
| 2025-08-15 | 13F | Kestra Advisory Services, LLC | 20 193 | 18,01 | 508 | 18,97 | ||||
| 2025-08-14 | 13F | Smartleaf Asset Management LLC | 308 | 2 100,00 | 8 | |||||
| 2025-07-09 | 13F | Parkside Advisors LLC | 86 192 | −2,79 | 2 169 | −2,08 | ||||
| 2025-08-01 | 13F | Motco | 4 408 | 31,50 | 111 | 32,53 | ||||
| 2025-08-14 | 13F | Headinvest, Llc | 18 194 | 1,11 | 458 | 1,78 | ||||
| 2025-07-29 | 13F | Novare Capital Management Llc | 27 650 | 8,86 | 696 | 9,62 | ||||
| 2025-08-13 | 13F | Continuum Advisory, LLC | 14 421 | −5,18 | 363 | −4,74 | ||||
| 2025-04-28 | 13F | Fedenia Advisers LLC | 0 | −100,00 | 0 | |||||
| 2025-07-23 | 13F | Litman Gregory Asset Management LLC | 11 606 | 0,00 | 292 | 0,69 | ||||
| 2025-07-28 | 13F | Harbour Investments, Inc. | 177 521 | 2,08 | 4 468 | 2,83 | ||||
| 2025-05-08 | 13F | Essential Planning, LLC. | 0 | −100,00 | 0 | |||||
| 2025-08-13 | 13F | Fisher Asset Management, LLC | 226 945 | 4,48 | 5 712 | 5,23 | ||||
| 2025-08-06 | 13F | Modera Wealth Management, LLC | 497 791 | −0,17 | 12 529 | 0,55 | ||||
| 2025-07-15 | 13F | Mather Group, Llc. | 154 483 | −16,66 | 3 888 | −16,06 | ||||
| 2025-08-01 | 13F | May Hill Capital, LLC | 0 | −100,00 | 0 | |||||
| 2025-08-14 | 13F | Destination Wealth Management | 341 472 | 2,28 | 8 595 | 3,02 | ||||
| 2025-07-16 | 13F | Perigon Wealth Management, LLC | 392 712 | 2,41 | 9 885 | 3,15 | ||||
| 2025-08-01 | 13F | Fort Vancouver Investment Management, LLC | 1 758 | 3,78 | 44 | 4,76 | ||||
| 2025-07-09 | 13F | Exchange Bank | 21 166 | 1,58 | 533 | 2,31 | ||||
| 2025-08-14 | 13F | Hrt Financial Lp | 0 | −100,00 | 0 | |||||
| 2025-07-24 | 13F | JNBA Financial Advisors | 38 563 | 8,27 | 971 | 8,99 | ||||
| 2025-04-16 | 13F | Martel Wealth Advisors Inc | 0 | −100,00 | 0 | |||||
| 2025-07-25 | 13F | PrairieView Partners, LLC | 64 261 | 5,85 | 2 | 0,00 | ||||
| 2025-05-15 | 13F | One Wealth Capital Management, Llc | 0 | −100,00 | 0 | |||||
| 2025-08-13 | 13F | Milestone Investment Advisors LLC | 356 898 | 8,63 | 8 983 | 9,42 | ||||
| 2025-08-13 | 13F | Twin Peaks Wealth Advisors, LLC | 167 | 4 | ||||||
| 2025-07-17 | 13F | Willow Creek Wealth Management Inc. | 44 437 | −1,40 | 1 118 | −0,71 | ||||
| 2025-07-31 | 13F | CVA Family Office, LLC | 781 | 0,00 | 20 | 0,00 | ||||
| 2025-08-12 | 13F | CIBC Private Wealth Group, LLC | 1 470 | 0,00 | 37 | 2,78 | ||||
| 2025-07-22 | 13F | Berger Financial Group, Inc | 12 691 | 14,58 | 319 | 15,58 | ||||
| 2025-08-08 | 13F | Tanglewood Legacy Advisors, LLC | 123 | 0,00 | 3 | 0,00 | ||||
| 2025-07-14 | 13F | Northland Capital Management LLC | 185 722 | −7,85 | 4 675 | −7,19 | ||||
| 2025-08-01 | 13F | Envestnet Asset Management Inc | 685 807 | −9,43 | 17 262 | −8,78 | ||||
| 2025-07-23 | 13F | Hardy Reed LLC | 28 272 | 0,00 | 712 | 0,71 | ||||
| 2025-08-12 | 13F | Putnam Fl Investment Management Co | 370 847 | −3,20 | 9 334 | −2,50 | ||||
| 2025-07-25 | 13F | Keener Financial Planning LLC | 20 048 | 0,00 | 1 | |||||
| 2025-08-08 | 13F | eCIO, Inc. | 42 298 | 41,69 | 1 065 | 42,63 | ||||
| 2025-07-23 | 13F | Prime Capital Investment Advisors, LLC | 0 | −100,00 | 0 | |||||
| 2025-08-14 | 13F | Fmr Llc | 90 | 23,29 | 2 | 100,00 | ||||
| 2025-07-29 | 13F | Private Wealth Management Group, LLC | 17 928 | −1,61 | 451 | −0,88 | ||||
| 2025-08-13 | 13F | SageView Advisory Group, LLC | 28 744 | −7,60 | 721 | −7,21 | ||||
| 2025-07-31 | 13F | Resonant Capital Advisors, LLC | 14 586 | 0,00 | 367 | 0,82 | ||||
| 2025-07-25 | 13F | Strategic Point Investment Advisors, LLC | 74 590 | −6,36 | 1 877 | −5,68 | ||||
| 2025-07-16 | 13F | St Germain D J Co Inc | 361 197 | 4,39 | 9 091 | 5,15 | ||||
| 2025-04-30 | 13F | Sharkey, Howes & Javer | 0 | −100,00 | 0 | |||||
| 2025-07-18 | 13F | Bartlett & Co. Wealth Management Llc | 78 959 | 2,66 | 1 987 | 3,38 | ||||
| 2025-08-11 | 13F | Sofi Wealth, Llc | 1 139 | 84,30 | 29 | 86,67 | ||||
| 2025-07-17 | 13F | Johnson Bixby & Associates, LLC | 19 547 | −12,77 | 492 | −12,32 | ||||
| 2025-07-23 | 13F | Nbt Bank N A /ny | 166 | 0,00 | 4 | 0,00 | ||||
| 2025-08-13 | 13F | Capital Analysts, Inc. | 535 | −19,79 | 0 | |||||
| 2025-07-11 | 13F | Colorado Capital Management, Inc. | 203 488 | 7,32 | 5 | 25,00 | ||||
| 2025-08-12 | 13F | Investor's Fiduciary Advisor Network, LLC | 15 148 | −15,18 | 0 | |||||
| 2025-09-12 | 13F/A | Valeo Financial Advisors, LLC | 45 040 | −5,58 | 1 134 | −4,95 | ||||
| 2025-04-08 | 13F | Global Financial Private Client, LLC | 0 | −100,00 | 0 | |||||
| 2025-08-11 | 13F | Avantax Planning Partners, Inc. | 14 226 | −35,62 | 358 | −35,14 | ||||
| 2025-08-14 | 13F | AllSquare Wealth Management LLC | 3 080 | 0,00 | 78 | 1,32 | ||||
| 2025-08-27 | 13F/A | Brinker Capital Investments, LLC | 8 105 | −3,11 | 204 | −2,39 | ||||
| 2025-07-25 | 13F | Cwm, Llc | 116 674 | 8,09 | 3 | 0,00 | ||||
| 2025-08-05 | 13F | Cherry Tree Wealth Management, LLC | 11 288 | −0,04 | 284 | 0,71 | ||||
| 2025-08-12 | 13F | SRS Capital Advisors, Inc. | 64 | 0,00 | 2 | 0,00 | ||||
| 2025-07-24 | 13F | IFP Advisors, Inc | 218 | −69,17 | 5 | −70,59 | ||||
| 2025-08-14 | 13F | Warren Averett Asset Management, LLC | 13 450 | −4,27 | 339 | −3,70 | ||||
| 2025-08-08 | 13F | Avantax Advisory Services, Inc. | 11 476 | −0,88 | 289 | −0,35 | ||||
| 2025-08-04 | 13F | Assetmark, Inc | 41 985 | 5,63 | 1 057 | 6,34 | ||||
| 2025-07-14 | 13F | Abacus Wealth Partners, LLC | 28 180 | −63,59 | 709 | −63,34 | ||||
| 2025-07-10 | 13F | Wealth Enhancement Advisory Services, Llc | 115 992 | 0,99 | 2 904 | 1,18 | ||||
| 2025-08-13 | 13F | Cresset Asset Management, LLC | 24 671 | −39,45 | 621 | −39,10 | ||||
| 2025-08-14 | 13F | CoreCap Advisors, LLC | 289 | −22,31 | 7 | −22,22 | ||||
| 2025-08-18 | 13F | Front Row Advisors LLC | 5 315 | 0,00 | 134 | 0,76 | ||||
| 2025-08-14 | 13F | Kovitz Investment Group Partners, LLC | 10 106 | −2,59 | 254 | −1,93 | ||||
| 2025-08-11 | 13F | Principal Securities, Inc. | 501 | 17,88 | 13 | 20,00 | ||||
| 2025-08-06 | 13F | Summit Wealth Group, LLC | 41 326 | −3,78 | 1 | 0,00 | ||||
| 2025-09-04 | 13F/A | Advisor Group Holdings, Inc. | 117 111 | 51,21 | 2 948 | 52,30 | ||||
| 2025-08-07 | 13F | Arbor Trust Wealth Advisors, Llc | 0 | −100,00 | 0 | |||||
| 2025-07-15 | 13F | Garrett Investment Advisors LLC | 100 727 | 1,95 | 2 535 | 2,67 | ||||
| 2025-08-11 | 13F | One Capital Management, LLC | 113 713 | −4,32 | 2 862 | −3,64 | ||||
| 2025-07-18 | 13F | Institute for Wealth Management, LLC. | 15 576 | 24,53 | 392 | 25,64 | ||||
| 2025-08-12 | 13F | Coldstream Capital Management Inc | 0 | −100,00 | 0 | |||||
| 2025-08-13 | 13F | Ally Invest Advisors Inc. | 21 265 | −0,39 | 535 | 0,38 | ||||
| 2025-07-16 | 13F | Signature Resources Capital Management, LLC | 11 154 | 0,80 | 281 | 1,45 | ||||
| 2025-08-05 | 13F | Bank of New York Mellon Corp | 544 185 | −7,57 | 13 697 | −6,90 | ||||
| 2025-07-08 | 13F | Canandaigua National Bank & Trust Co | 78 002 | 3,48 | 1 963 | 4,25 | ||||
| 2025-08-11 | 13F | Western Wealth Management, LLC | 10 438 | 0,46 | 263 | 1,16 | ||||
| 2025-07-25 | 13F | RHS Financial, LLC | 16 182 | 34,28 | 407 | 35,22 | ||||
| 2025-08-14 | 13F | UBS Group AG | 448 189 | −0,47 | 11 281 | 0,25 | ||||
| 2025-07-15 | 13F | Regatta Capital Group, Llc | 87 615 | 7,41 | 2 205 | 8,19 | ||||
| 2025-08-04 | 13F | Creative Financial Designs Inc /adv | 1 536 | −8,46 | 39 | −7,32 | ||||
| 2025-08-18 | 13F/A | National Bank Of Canada /fi/ | 200 | 0,00 | 5 | 25,00 | ||||
| 2025-05-08 | 13F | We Are One Seven, LLC | 0 | −100,00 | 0 | |||||
| 2025-07-17 | 13F | Elser Financial Planning, Inc | 266 074 | 6 652 | ||||||
| 2025-05-15 | 13F | Tower Research Capital LLC (TRC) | 0 | −100,00 | 0 | |||||
| 2025-08-12 | 13F | Journey Strategic Wealth Llc | 21 977 | 0,53 | 553 | 1,28 | ||||
| 2025-07-18 | 13F | Cantor Fitzgerald Investment Adviser L.p. | 32 617 | −13,11 | 821 | −12,58 | ||||
| 2025-07-28 | 13F | DORVAL Corp | 9 074 | 0,61 | 228 | 1,33 | ||||
| 2025-08-11 | 13F | Citigroup Inc | 1 000 | 0,00 | 25 | 4,17 | ||||
| 2025-04-18 | 13F | Halbert Hargrove Global Advisors, Llc | 0 | −100,00 | 0 | −100,00 | ||||
| 2025-08-14 | 13F | Fairview Capital Investment Management, Llc | 32 600 | 0,00 | 821 | 0,74 | ||||
| 2025-08-14 | 13F/A | Rockefeller Capital Management L.P. | 27 470 | 0,52 | 691 | 1,32 | ||||
| 2025-08-14 | 13F | Goldman Sachs Group Inc | 3 085 549 | −4,12 | 77 663 | −3,43 | ||||
| 2025-08-07 | 13F | Winthrop Capital Management, LLC | 41 | 0,00 | 0 | |||||
| 2025-08-14 | 13F | EP Wealth Advisors, Inc. | 469 430 | 25,97 | 11 816 | 26,88 | ||||
| 2025-08-15 | 13F | Morgan Stanley | 965 816 | −2,86 | 24 310 | −2,16 | ||||
| 2025-07-22 | 13F | 4Thought Financial Group Inc. | 8 957 | 0,06 | 225 | 0,90 | ||||
| 2025-07-29 | 13F | Private Trust Co Na | 7 260 | 0,00 | 183 | 0,55 | ||||
| 2025-08-11 | 13F | Private Advisor Group, LLC | 19 684 | 12,44 | 495 | 13,27 | ||||
| 2025-08-13 | 13F | Acorns Advisers, LLC | 588 958 | −13,94 | 15 | −17,65 | ||||
| 2025-08-14 | 13F | Betterment LLC | 10 253 | 0,00 | 0 | |||||
| 2025-08-19 | 13F | Cape Investment Advisory, Inc. | 1 081 | 0,00 | 27 | 0,00 | ||||
| 2025-04-30 | 13F | Sofos Investments, Inc. | 4 885 | −51,30 | 122 | −50,20 | ||||
| 2025-07-07 | 13F | Wesbanco Bank Inc | 8 908 | 0,00 | 224 | 0,90 | ||||
| 2025-07-30 | 13F | Whittier Trust Co | 20 261 | 0,00 | 510 | 0,59 | ||||
| 2025-08-05 | 13F | Clarity Wealth Development LLC | 120 767 | 5,99 | 3 040 | 6,44 | ||||
| 2025-08-06 | 13F | Commonwealth Equity Services, Llc | 400 115 | −39,38 | 10 | −37,50 | ||||
| 2025-08-08 | 13F | Better Money Decisions, LLC | 69 075 | 2,49 | 1 739 | 3,21 | ||||
| 2025-08-11 | 13F | Plum Street Advisors, LLC | 53 998 | −3,68 | 1 359 | −3,00 | ||||
| 2025-08-14 | 13F | Citadel Advisors Llc | 0 | −100,00 | 0 | |||||
| 2025-07-08 | 13F | Parallel Advisors, LLC | 16 328 | −21,61 | 411 | −21,15 | ||||
| 2025-08-07 | 13F | Resources Investment Advisors, LLC. | 14 164 | 1,08 | 357 | 1,71 | ||||
| 2025-08-12 | 13F | Tradition Wealth Management, LLC | 16 145 | −0,64 | 406 | 0,00 | ||||
| 2025-08-14 | 13F | Gould Capital, LLC | 2 907 | 0,00 | 73 | 1,39 | ||||
| 2025-08-18 | 13F | Geneos Wealth Management Inc. | 400 | 10 | ||||||
| 2025-08-05 | 13F | McGinn Investment Management, Inc. | 0 | −100,00 | 0 | |||||
| 2025-08-15 | 13F | Equitable Holdings, Inc. | 45 702 | −8,30 | 1 150 | −7,63 | ||||
| 2025-07-17 | 13F | Hanson & Doremus Investment Management | 116 | 0,00 | 0 | |||||
| 2025-07-25 | 13F | Presilium Private Wealth, Llc | 24 484 | 3,44 | 616 | 4,23 | ||||
| 2025-07-23 | 13F | SGL Investment Advisors, Inc. | 12 439 | 8,94 | 311 | 9,89 | ||||
| 2025-08-14 | 13F | Fort Point Capital Partners LLC | 45 519 | −8,82 | 1 146 | −8,18 | ||||
| 2025-07-25 | 13F | Envestnet Portfolio Solutions, Inc. | 54 350 | −32,10 | 1 368 | −31,65 | ||||
| 2025-07-14 | 13F | Park Avenue Securities Llc | 8 545 | −18,72 | 0 | |||||
| 2025-07-24 | 13F | PDS Planning, Inc | 8 669 | −1,76 | 218 | −0,91 | ||||
| 2025-07-31 | 13F | Mason & Associates Inc | 12 302 | 1,05 | 310 | 1,64 | ||||
| 2025-08-05 | 13F | iA Global Asset Management Inc. | 29 000 | 0,00 | 1 | |||||
| 2025-07-25 | 13F | Sequoia Financial Advisors, LLC | 42 837 | −11,83 | 1 078 | −11,20 | ||||
| 2025-07-30 | 13F | Brookstone Capital Management | 75 265 | −5,39 | 1 894 | −4,73 | ||||
| 2025-07-10 | 13F | Klaas Financial Asset Advisors, LLC | 142 972 | 1,48 | 3 599 | 2,22 | ||||
| 2025-07-25 | 13F | Joel Adams & Associates, Inc. | 15 601 | 0,09 | 393 | 0,77 | ||||
| 2025-08-08 | 13F | Accredited Investors Inc. | 162 491 | 11,85 | 4 090 | 12,64 | ||||
| 2025-08-14 | 13F | Bank Of America Corp /de/ | 265 393 | 1,58 | 6 680 | 2,31 | ||||
| 2025-08-12 | 13F | Goepper Burkhardt LLC | 13 594 | −17,61 | 342 | −16,99 | ||||
| 2025-05-15 | 13F | WealthTrak Capital Management LLC | 0 | −100,00 | 0 | |||||
| 2025-07-31 | 13F | Cardinal Point Capital Management, ULC | 73 618 | 35,21 | 1 853 | 36,18 | ||||
| 2025-07-14 | 13F | UMA Financial Services, Inc. | 775 | 1,17 | 20 | 0,00 | ||||
| 2025-07-23 | 13F | Bear Mountain Capital, Inc. | 156 788 | 4,76 | 3 931 | 4,83 | ||||
| 2025-07-30 | 13F | Avidian Wealth Solutions, LLC | 18 647 | −0,21 | 469 | 0,64 | ||||
| 2025-08-13 | 13F | Jones Financial Companies Lllp | 2 341 | 13,97 | 59 | 13,73 | ||||
| 2025-08-01 | 13F | Schmidt P J Investment Management Inc | 20 673 | 0,74 | 520 | 1,56 | ||||
| 2025-08-14 | 13F | Aprio Wealth Management, LLC | 29 794 | −5,18 | 750 | −4,59 | ||||
| 2025-08-14 | 13F | Integrated Wealth Concepts LLC | 16 872 | 13,68 | 425 | 14,59 | ||||
| 2025-07-15 | 13F | Pine Haven Investment Counsel, Inc | 35 322 | 6,90 | 889 | 7,76 | ||||
| 2025-04-01 | 13F | Massmutual Trust Co Fsb/adv | 0 | −100,00 | 0 | |||||
| 2025-08-13 | 13F | GeoWealth Management, LLC | 7 374 | −21,88 | 186 | −21,28 | ||||
| 2025-08-12 | 13F | Jpmorgan Chase & Co | 372 356 | 13,33 | 9 372 | 14,15 | ||||
| 2025-07-22 | 13F | DAVENPORT & Co LLC | 46 641 | 7,04 | 1 174 | 7,81 |