Grunnleggende statistikk
| Institusjonelle eiere | 114 total, 114 long only, 0 short only, 0 long/short - change of −1,71% MRQ |
| Gjennomsnittlig porteføljeallokering | 0.5701 % - change of 10,22% MRQ |
| Institusjonelle aksjer (Long) | 18 683 869 (ex 13D/G) - change of 2,47MM shares 15,26% MRQ |
| Institusjonell verdi (Long) | $ 880 392 USD ($1000) |
Institusjonelt eierskap og aksjonærer
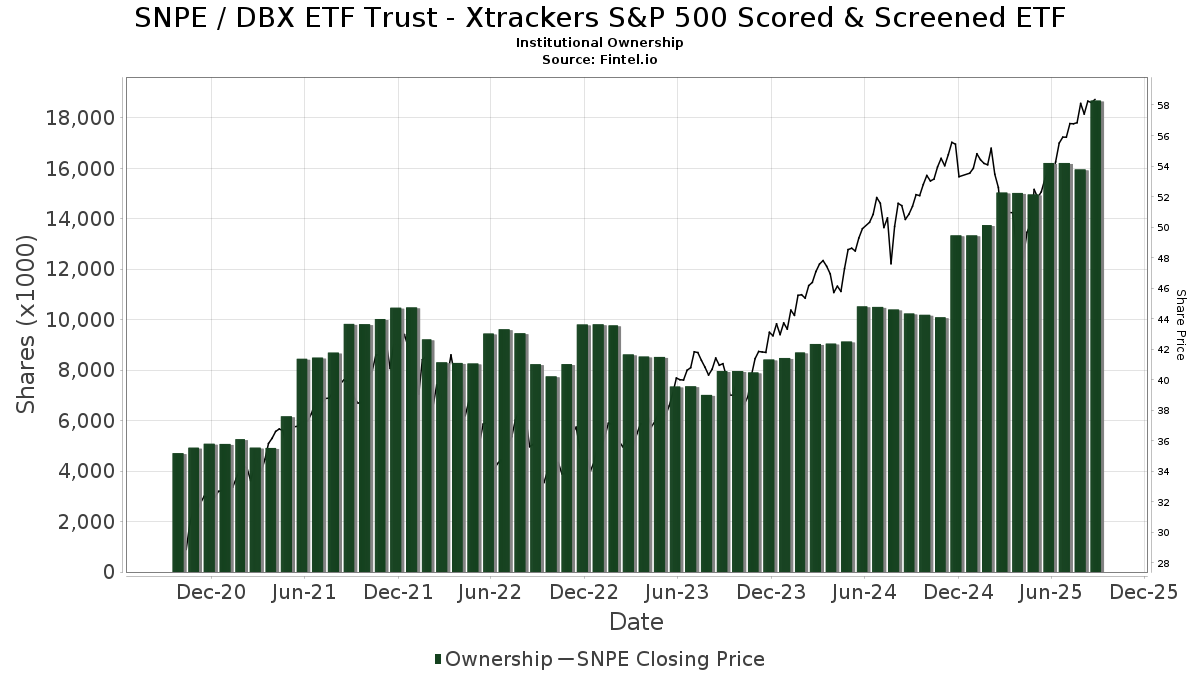
DBX ETF Trust - Xtrackers S&P 500 Scored & Screened ETF (US:SNPE) har 114 institusjonelle eiere og aksjonærer som har sendt inn 13D/G- eller 13F-skjemaer til Securities Exchange Commission (SEC). Disse institusjonene eier til sammen 18,683,869 aksjer. De største aksjonærene inkluderer Jpmorgan Chase & Co, Morgan Stanley, Sun Life Financial Inc, Mirae Asset Global Investments Co., Ltd., WCG Wealth Advisors LLC, LPL Financial LLC, UBS Group AG, Ameriprise Financial Inc, Money Design Co.,Ltd., and Two Sigma Investments, Lp .
DBX ETF Trust - Xtrackers S&P 500 Scored & Screened ETF (ARCA:SNPE) institusjonell eierstruktur viser nåværende posisjoner i selskapet fordelt på institusjoner og fond, samt de siste endringene i posisjonsstørrelse. De største aksjonærene kan være individuelle investorer, verdipapirfond, hedgefond eller institusjoner. Schedule 13D indikerer at investoren eier (eller har eid) mer enn 5 % av selskapet og har til hensikt (eller hadde til hensikt) å aktivt forfølge en endring i forretningsstrategien. Schedule 13G indikerer en passiv investering på over 5 %.
The share price as of September 12, 2025 is 59,01 / share. Previously, on September 13, 2024, the share price was 51,49 / share. This represents an increase of 14,60% over that period.
Fondssentiment-score
Fondssentiment Score (også kjent som akkumulering av eierskap poengsum) viser hvilke aksjer som er mest kjøpt av fond. Den er resultatet av en sofistikert, kvantitativ flerfaktormodell som identifiserer selskaper med de høyeste nivåene av institusjonell akkumulering. Beregningsmodellen for poeng bruker en kombinasjon av den totale økningen i antall offentliggjorte eiere, endringer i porteføljeallokeringen til disse eierne og andre beregninger. Tallet går fra 0 til 100, der høyere tall indikerer en høyere grad av akkumulering i forhold til sammenlignbare selskaper, der 50 er gjennomsnittet.
Oppdateringsfrekvens: Daglig
Sjekk ut Ownership Explorer, som inneholder en liste over de høyest rangerte selskapene.
Institusjonell Put/Call-forhold
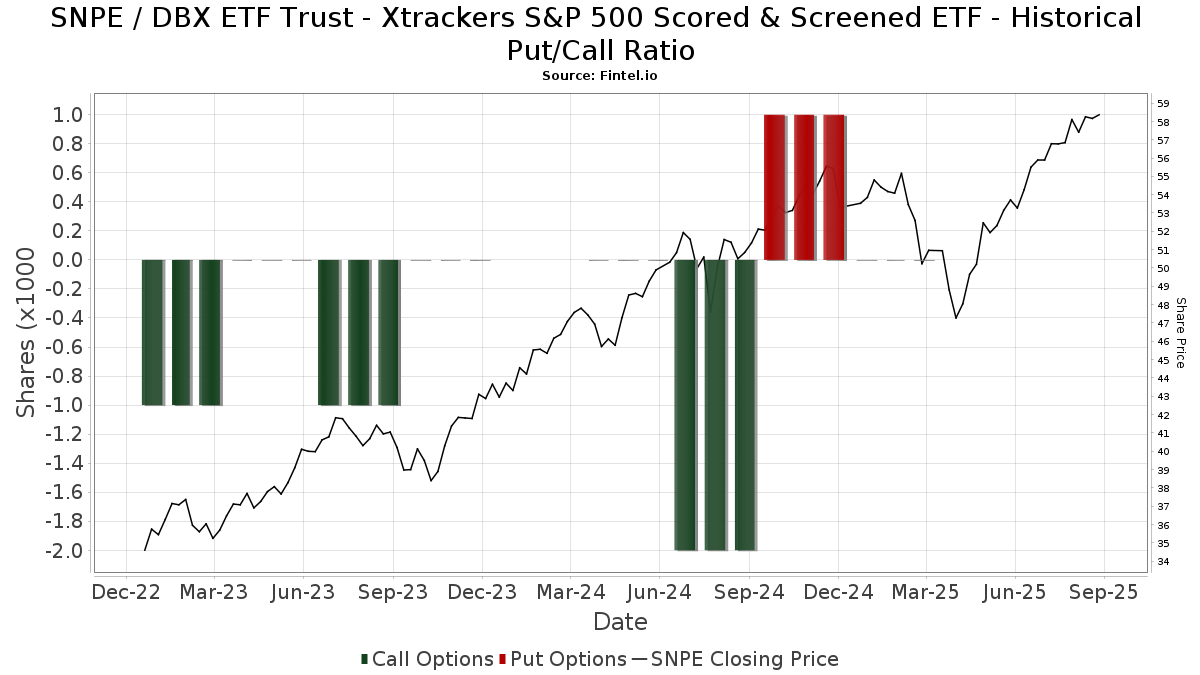
I tillegg til å rapportere standard aksje- og gjeldsemisjoner må institusjoner med mer enn 100 millioner kroner i forvaltningskapital også oppgi beholdningen av put- og callopsjoner. Siden put-opsjoner generelt indikerer et negativt sentiment, og call-opsjoner indikerer et positivt sentiment, kan vi få et inntrykk av det generelle institusjonelle sentimentet ved å plotte forholdet mellom put- og call-opsjoner. Diagrammet til høyre viser det historiske forholdet mellom put- og call-opsjoner for dette instrumentet.
Ved å bruke Put/Call-forholdet som en indikator på investorsentimentet kan man overvinne en av de viktigste svakhetene ved å bruke totalt institusjonelt eierskap, nemlig at en betydelig andel av forvaltningskapitalen investeres passivt for å følge indekser. Passivt forvaltede fond kjøper vanligvis ikke opsjoner, slik at indikatoren for put/call-forhold i større grad gjenspeiler stemningen i aktivt forvaltede fond.
13F- og NPORT-arkiveringer
Detaljer om 13F-arkiveringer er gratis. Detaljer om NP-arkiveringer krever et premium-medlemskap. Grønne rader indikerer nye posisjoner. Røde rader indikerer lukkede posisjoner. Klikk på lenke ikonet for å se hele transaksjonshistorikken.
Oppgrader
for å låse opp premiedata og eksportere til Excel. ![]() .
.
| Fildato | Kilde | Investor | Type | Gjennomsnittlig pris (estimert) |
Aksjer | Δ Aksjer (%) |
Rapportert verdi ($1000) | Verdi (%) | Portallokering (%) | |
|---|---|---|---|---|---|---|---|---|---|---|
| 2025-08-11 | 13F | Nomura Asset Management Co Ltd | 5 780 | 25,65 | 320 | 38,10 | ||||
| 2025-08-13 | 13F | Millstone Evans Group, LLC | 18 | 0,00 | 1 | |||||
| 2025-08-14 | 13F | GWM Advisors LLC | 1 894 | 0,00 | 105 | 9,47 | ||||
| 2025-08-05 | 13F | Bank of New York Mellon Corp | 0 | −100,00 | 0 | |||||
| 2025-08-15 | 13F | Captrust Financial Advisors | 4 471 | 0,18 | 247 | 9,78 | ||||
| 2025-05-30 | NP | ERNZ - TrueShares Active Yield ETF | 5 360 | 270 | ||||||
| 2025-08-12 | 13F | LPL Financial LLC | 529 796 | −6,09 | 29 298 | 2,97 | ||||
| 2025-08-13 | 13F | IAG Wealth Partners, LLC | 252 | 0,00 | 14 | 8,33 | ||||
| 2025-08-13 | 13F | Baird Financial Group, Inc. | 4 917 | 8,40 | 272 | 18,86 | ||||
| 2025-08-14 | 13F | Qube Research & Technologies Ltd | 2 725 | 151 | ||||||
| 2025-07-10 | 13F | Wealth Enhancement Advisory Services, Llc | 16 778 | −5,40 | 939 | 4,92 | ||||
| 2025-07-15 | 13F | Sheets Smith Wealth Management | 55 436 | −33,26 | 3 066 | −26,81 | ||||
| 2025-07-29 | 13F | TrueMark Investments, LLC | 0 | −100,00 | 0 | |||||
| 2025-08-14 | 13F | Jupiter Wealth Management LLC | 3 624 | 73,65 | 211 | 90,91 | ||||
| 2025-08-14 | 13F | Nepc Llc | 9 245 | 0,00 | 511 | 9,66 | ||||
| 2025-08-08 | 13F | Gts Securities Llc | 161 089 | 201,07 | 8 901 | 229,87 | ||||
| 2025-08-14 | 13F | Bank Of America Corp /de/ | 270 882 | −29,99 | 14 980 | −23,23 | ||||
| 2025-08-11 | 13F | Retirement Capital Strategies | 38 540 | −24,55 | 2 131 | −17,34 | ||||
| 2025-07-30 | 13F | Ethic Inc. | 3 694 | 203 | ||||||
| 2025-07-21 | 13F | Mirae Asset Global Investments Co., Ltd. | 1 161 700 | −12,57 | 64 242 | −3,69 | ||||
| 2025-07-29 | 13F | Goldstein Advisors, LLC | 10 823 | −10,10 | 599 | −1,48 | ||||
| 2025-08-14 | 13F | Abound Financial, Llc | 4 494 | 0,02 | 249 | 9,73 | ||||
| 2025-08-14 | 13F | Bnp Paribas Arbitrage, Sa | 19 600 | 489 900,00 | 1 084 | |||||
| 2025-07-25 | NP | SNPD - Xtrackers S&P ESG Dividend Aristocrats ETF | 350 | −6,67 | 18 | −10,00 | ||||
| 2025-04-23 | 13F | White Pine Investment CO | 0 | −100,00 | 0 | |||||
| 2025-07-22 | 13F | Hill Island Financial Llc | 0 | −100,00 | 0 | |||||
| 2025-07-28 | 13F | Harbour Investments, Inc. | 10 | 0,00 | 1 | |||||
| 2025-05-08 | 13F | Plante Moran Financial Advisors, LLC | 0 | −100,00 | 0 | |||||
| 2025-07-31 | 13F | Money Design Co.,Ltd. | 425 847 | 3,76 | 24 | 15,00 | ||||
| 2025-08-14 | 13F | Citadel Advisors Llc | 0 | −100,00 | 0 | |||||
| 2025-04-15 | 13F | Noble Wealth Management PBC | 350 | 0,00 | 18 | −5,56 | ||||
| 2025-08-12 | 13F | Jpmorgan Chase & Co | 5 191 440 | −7,98 | 287 087 | 0,91 | ||||
| 2025-08-14 | 13F | Citadel Advisors Llc | Call | 0 | −100,00 | 0 | ||||
| 2025-05-13 | 13F | Franklin Resources Inc | 0 | −100,00 | 0 | |||||
| 2025-08-13 | 13F | WCG Wealth Advisors LLC | 551 286 | 49,16 | 30 486 | 63,57 | ||||
| 2025-08-12 | 13F | Steward Partners Investment Advisory, Llc | 5 212 | 288 | ||||||
| 2025-09-04 | 13F/A | Advisor Group Holdings, Inc. | 74 111 | 45,15 | 4 099 | 59,15 | ||||
| 2025-05-15 | 13F/A | Orion Portfolio Solutions, LLC | 21 097 | −12,17 | 1 064 | −16,89 | ||||
| 2025-08-14 | 13F | Wells Fargo & Company/mn | 132 360 | 0,69 | 7 319 | 10,43 | ||||
| 2025-08-14 | 13F | Two Sigma Investments, Lp | 307 200 | 178,51 | 16 988 | 205,43 | ||||
| 2025-08-12 | 13F | Proequities, Inc. | 0 | 0 | ||||||
| 2025-05-14 | 13F | Renaissance Technologies Llc | 0 | −100,00 | 0 | |||||
| 2025-07-07 | 13F | Rf&l Wealth Management, Llc | 4 697 | 0,00 | 260 | 9,75 | ||||
| 2025-08-11 | 13F | Advisor Resource Council | 0 | −100,00 | 0 | |||||
| 2025-04-25 | 13F | Tradewinds Capital Management, LLC | 0 | −100,00 | 0 | −100,00 | ||||
| 2025-08-08 | 13F | Pnc Financial Services Group, Inc. | 187 | 0,00 | 10 | 11,11 | ||||
| 2025-08-14 | 13F | Stifel Financial Corp | 0 | −100,00 | 0 | |||||
| 2025-08-13 | 13F | Balance Wealth, LLC | 18 000 | 0,03 | 995 | 9,70 | ||||
| 2025-08-15 | 13F | Tower Research Capital LLC (TRC) | 400 | −94,85 | 22 | −94,37 | ||||
| 2025-08-26 | 13F/A | Thrivent Financial For Lutherans | 0 | −100,00 | 0 | |||||
| 2025-08-14 | 13F | West Coast Financial LLC | 0 | −100,00 | 0 | |||||
| 2025-08-14 | 13F | Susquehanna International Group, Llp | 18 989 | −55,14 | 1 050 | −50,80 | ||||
| 2025-08-14 | 13F | Royal Bank Of Canada | 62 289 | −35,32 | 3 445 | −29,06 | ||||
| 2025-04-22 | 13F | Veridan Wealth LLC | 7 723 | −18,88 | 389 | −23,73 | ||||
| 2025-08-14 | 13F | Goldman Sachs Group Inc | 141 494 | 117,38 | 7 825 | 138,39 | ||||
| 2025-08-15 | 13F | Morgan Stanley | 3 753 403 | 35,44 | 207 563 | 48,52 | ||||
| 2025-08-13 | 13F | Sun Life Financial Inc | 2 231 800 | 123 | ||||||
| 2025-08-15 | 13F | Kestra Advisory Services, LLC | 14 092 | −10,18 | 779 | −1,52 | ||||
| 2025-04-25 | NP | SPDAX - DWS Multi-Asset Conservative Allocation Fund Class A | 195 047 | −25,09 | 10 445 | −27,13 | ||||
| 2025-07-09 | 13F | Fragasso Group Inc. | 7 032 | 25,66 | 389 | 37,59 | ||||
| 2025-07-10 | 13F | Focus Financial Network, Inc. | 0 | −100,00 | 0 | |||||
| 2025-04-30 | 13F | Sofos Investments, Inc. | 3 055 | −52,51 | 154 | −52,17 | ||||
| 2025-08-08 | 13F | Avantax Advisory Services, Inc. | 8 145 | 0,00 | 450 | 9,76 | ||||
| 2025-07-29 | 13F | APCM Wealth Management for Individuals | 186 044 | 8,00 | 10 288 | 18,43 | ||||
| 2025-07-18 | 13F | Cantor Fitzgerald Investment Adviser L.p. | 32 237 | −6,61 | 1 783 | 2,41 | ||||
| 2025-07-29 | 13F | Private Trust Co Na | 10 189 | 46,35 | 563 | 60,40 | ||||
| 2025-07-18 | 13F | First Pacific Financial | 1 417 | 0,07 | 78 | 9,86 | ||||
| 2025-08-08 | 13F | Citizens Financial Group Inc/ri | 4 569 | 0,00 | 253 | 9,57 | ||||
| 2025-08-04 | 13F | Assetmark, Inc | 225 | −34,97 | 12 | −29,41 | ||||
| 2025-07-18 | 13F/A | MJT & Associates Financial Advisory Group, Inc. | 2 027 | −27,16 | 112 | −20,00 | ||||
| 2025-08-14 | 13F | UBS Group AG | 492 431 | −14,09 | 27 231 | −5,79 | ||||
| 2025-08-13 | 13F | Congress Wealth Management LLC / DE / | 3 982 | 0,00 | 220 | 10,00 | ||||
| 2025-07-29 | 13F | Stratos Wealth Partners, LTD. | 44 831 | −0,24 | 2 479 | 9,40 | ||||
| 2025-08-11 | 13F | WPG Advisers, LLC | 18 | 0,00 | 1 | |||||
| 2025-08-08 | 13F | Hartland & Co., LLC | 9 954 | −26,99 | 550 | −19,94 | ||||
| 2025-08-05 | 13F | Simplex Trading, Llc | 100 | 0 | ||||||
| 2025-08-08 | 13F | Financial Gravity Companies, Inc. | 3 061 | 0,20 | 169 | 4,32 | ||||
| 2025-07-09 | 13F | Fermata Advisors, LLC | 0 | −100,00 | 0 | |||||
| 2025-08-13 | 13F | Flow Traders U.s. Llc | 0 | −100,00 | 0 | |||||
| 2025-08-12 | 13F | Prudential Plc | 25 000 | 0,00 | 1 382 | 9,68 | ||||
| 2025-08-18 | 13F | Goodman Advisory Group, LLC | 0 | −100,00 | 0 | |||||
| 2025-08-18 | 13F | Tyler-Stone Wealth Management | 0 | −100,00 | 0 | |||||
| 2025-08-11 | 13F | One Capital Management, LLC | 52 404 | −48,24 | 2 898 | −43,25 | ||||
| 2025-08-12 | 13F | MAI Capital Management | 110 807 | −6,60 | 6 128 | 2,42 | ||||
| 2025-08-14 | 13F | Two Sigma Securities, Llc | 4 436 | 245 | ||||||
| 2025-07-15 | 13F | Fifth Third Bancorp | 264 020 | −12,93 | 14 600 | −4,52 | ||||
| 2025-07-31 | 13F | WFA Asset Management Corp | 1 291 | 0,39 | 65 | 4,92 | ||||
| 2025-08-13 | 13F | Jump Financial, LLC | 19 615 | 0,00 | 1 085 | 9,61 | ||||
| 2025-08-01 | 13F | Envestnet Asset Management Inc | 65 320 | −11,57 | 3 612 | −3,03 | ||||
| 2025-07-25 | 13F | Cwm, Llc | 628 | 0,00 | 0 | |||||
| 2025-07-11 | 13F | Farther Finance Advisors, LLC | 1 424 | −74,37 | 79 | −72,24 | ||||
| 2025-07-15 | 13F | Mather Group, Llc. | 0 | −100,00 | 0 | |||||
| 2025-03-24 | 13F | Fulcrum Equity Management | 0 | −100,00 | 0 | |||||
| 2025-08-04 | 13F | Savvy Advisors, Inc. | 21 357 | 1 181 | ||||||
| 2025-08-12 | 13F | Deutsche Bank Ag\ | 16 825 | −89,65 | 930 | −88,66 | ||||
| 2025-08-13 | 13F | Twin Peaks Wealth Advisors, LLC | 1 000 | 58 | ||||||
| 2025-08-14 | 13F | Comerica Bank | 3 352 | 51,20 | 185 | 66,67 | ||||
| 2025-08-14 | 13F | Fmr Llc | 5 098 | −25,21 | 282 | −18,08 | ||||
| 2025-07-31 | 13F | Heirloom Wealth Management | 8 238 | 0,93 | 456 | 10,71 | ||||
| 2025-07-31 | 13F | Cambridge Investment Research Advisors, Inc. | 9 543 | 5,77 | 1 | |||||
| 2025-04-25 | NP | PLUSX - DWS Multi-Asset Moderate Allocation Fund Class A | 104 413 | −25,29 | 5 591 | −27,32 | ||||
| 2025-07-25 | NP | USSG - Xtrackers MSCI USA ESG Leaders Equity ETF | 25 000 | 284,62 | 1 311 | 276,44 | ||||
| 2025-07-15 | 13F | Bfsg, Llc | 0 | −100,00 | 0 | |||||
| 2025-07-31 | 13F | LJI Wealth Management, LLC | 4 636 | 0,00 | 256 | 9,87 | ||||
| 2025-08-06 | 13F | Commonwealth Equity Services, Llc | 4 560 | −16,92 | 0 | |||||
| 2025-08-08 | 13F | Cetera Investment Advisers | 17 554 | −1,55 | 971 | 7,90 | ||||
| 2025-07-15 | 13F | GSB Wealth Management, LLC | 7 015 | 388 | ||||||
| 2025-07-18 | 13F | PFG Investments, LLC | 4 859 | 269 | ||||||
| 2025-08-11 | 13F | TD Waterhouse Canada Inc. | 2 163 | 0,00 | 120 | 9,17 | ||||
| 2025-07-10 | 13F | IMPACTfolio, LLC | 0 | −100,00 | 0 | |||||
| 2025-08-07 | 13F | Prudent Man Investment Management, Inc. | 559 | 0,00 | 30 | 0,00 | ||||
| 2025-08-05 | 13F | Bank Of Montreal /can/ | 278 | 0,00 | 15 | 7,14 | ||||
| 2025-08-18 | 13F/A | National Bank Of Canada /fi/ | 77 700 | 4 297 | ||||||
| 2025-08-07 | 13F | Allworth Financial LP | 31 972 | 0,07 | 1 768 | 13,04 | ||||
| 2025-08-08 | 13F | Principal Financial Group Inc | 198 000 | −13,47 | 10 949 | −5,10 | ||||
| 2025-08-04 | 13F | Migdal Insurance & Financial Holdings Ltd. | 79 035 | 353,91 | 4 | |||||
| 2025-07-25 | 13F | Fifth Third Wealth Advisors LLC | 4 250 | 235 | ||||||
| 2025-08-14 | 13F | TCG Advisory Services, LLC | 8 132 | 450 | ||||||
| 2025-07-14 | 13F | AdvisorNet Financial, Inc | 2 379 | 0,13 | 132 | 10,08 | ||||
| 2025-08-14 | 13F | Ameriprise Financial Inc | 461 906 | 5,04 | 25 548 | 15,20 | ||||
| 2025-08-15 | 13F | Urban Financial Advisory Corp | 2 369 | 0,30 | 131 | 10,08 | ||||
| 2025-08-06 | 13F | AE Wealth Management LLC | 22 | 83,33 | 1 | |||||
| 2025-07-03 | 13F | Garde Capital, Inc. | 0 | 0 | ||||||
| 2025-08-14 | 13F | Jane Street Group, Llc | 6 188 | −41,23 | 342 | −35,59 | ||||
| 2025-07-22 | 13F | Carolina Wealth Advisors, LLC | 1 023 | −6,06 | 57 | 3,70 | ||||
| 2025-05-08 | 13F | Eastern Bank | 0 | −100,00 | 0 | |||||
| 2025-05-15 | 13F | Citadel Advisors Llc | Put | 0 | −100,00 | 0 | ||||
| 2025-08-05 | 13F | Ellevest, Inc. | 3 649 | 202 | ||||||
| 2025-08-13 | 13F | Investment Counsel Co Of Nevada | 34 602 | 0,29 | 1 913 | 10,01 | ||||
| 2025-07-16 | 13F | GenWealth Group, Inc. | 51 745 | 3,46 | 2 861 | 13,44 | ||||
| 2025-08-14 | 13F | Potomac Fund Management Inc /adv | 7 812 | 4,12 | 437 | 26,01 | ||||
| 2025-07-17 | 13F | Nelson, Van Denburg & Campbell Wealth Management Group, LLC | 32 341 | −0,06 | 1 788 | 9,56 | ||||
| 2025-08-14 | 13F | Raymond James Financial Inc | 266 010 | −24,52 | 14 710 | −17,23 | ||||
| 2025-07-31 | 13F | Insight Wealth Partners, LLC | 50 387 | 4,22 | 2 786 | 14,27 | ||||
| 2025-08-12 | 13F | O'shaughnessy Asset Management, Llc | 387 | 0,00 | 21 | 10,53 | ||||
| 2025-08-13 | 13F | Gateway Wealth Partners, LLC | 30 804 | −68,90 | 1 703 | −65,91 | ||||
| 2025-08-07 | 13F | Encompass More Asset Management | 0 | −100,00 | 0 | |||||
| 2025-08-27 | 13F/A | Brinker Capital Investments, LLC | 21 371 | 1,30 | 1 182 | 11,10 | ||||
| 2025-08-11 | 13F | Tidemark, LLC | 0 | −100,00 | 0 | |||||
| 2025-08-13 | 13F | Cerity Partners LLC | 16 165 | 894 | ||||||
| 2025-07-31 | 13F | Mason & Associates Inc | 14 927 | −0,30 | 825 | 9,27 | ||||
| 2025-08-13 | 13F | Northwestern Mutual Wealth Management Co | 104 291 | −11,79 | 5 767 | −3,27 | ||||
| 2025-08-13 | 13F | Rsm Us Wealth Management Llc | 117 188 | −0,39 | 6 480 | 9,24 | ||||
| 2025-05-13 | 13F | EverSource Wealth Advisors, LLC | 0 | −100,00 | 0 |