Grunnleggende statistikk
| Institusjonelle eiere | 181 total, 177 long only, 1 short only, 3 long/short - change of −1,62% MRQ |
| Gjennomsnittlig porteføljeallokering | 0.2492 % - change of −20,46% MRQ |
| Institusjonelle aksjer (Long) | 5 371 898 (ex 13D/G) - change of −0,55MM shares −9,22% MRQ |
| Institusjonell verdi (Long) | $ 751 676 USD ($1000) |
Institusjonelt eierskap og aksjonærer
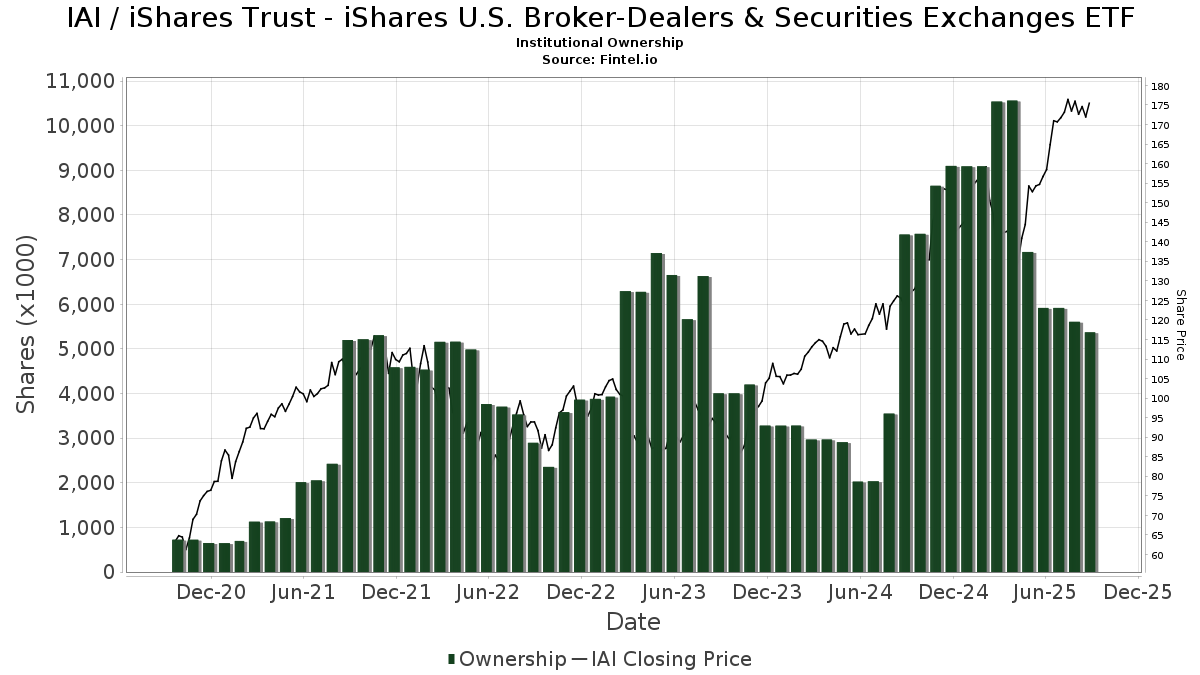
iShares Trust - iShares U.S. Broker-Dealers & Securities Exchanges ETF (US:IAI) har 181 institusjonelle eiere og aksjonærer som har sendt inn 13D/G- eller 13F-skjemaer til Securities Exchange Commission (SEC). Disse institusjonene eier til sammen 5,371,898 aksjer. De største aksjonærene inkluderer Fisher Asset Management, LLC, Harel Insurance Investments & Financial Services Ltd., Morgan Stanley, LPL Financial LLC, Bank Of America Corp /de/, Advisor Group Holdings, Inc., Mml Investors Services, Llc, Two Sigma Investments, Lp, SPC Financial, Inc., and Wells Fargo & Company/mn .
iShares Trust - iShares U.S. Broker-Dealers & Securities Exchanges ETF (ARCA:IAI) institusjonell eierstruktur viser nåværende posisjoner i selskapet fordelt på institusjoner og fond, samt de siste endringene i posisjonsstørrelse. De største aksjonærene kan være individuelle investorer, verdipapirfond, hedgefond eller institusjoner. Schedule 13D indikerer at investoren eier (eller har eid) mer enn 5 % av selskapet og har til hensikt (eller hadde til hensikt) å aktivt forfølge en endring i forretningsstrategien. Schedule 13G indikerer en passiv investering på over 5 %.
The share price as of September 10, 2025 is 175,45 / share. Previously, on September 11, 2024, the share price was 123,71 / share. This represents an increase of 41,82% over that period.
Fondssentiment-score
Fondssentiment Score (også kjent som akkumulering av eierskap poengsum) viser hvilke aksjer som er mest kjøpt av fond. Den er resultatet av en sofistikert, kvantitativ flerfaktormodell som identifiserer selskaper med de høyeste nivåene av institusjonell akkumulering. Beregningsmodellen for poeng bruker en kombinasjon av den totale økningen i antall offentliggjorte eiere, endringer i porteføljeallokeringen til disse eierne og andre beregninger. Tallet går fra 0 til 100, der høyere tall indikerer en høyere grad av akkumulering i forhold til sammenlignbare selskaper, der 50 er gjennomsnittet.
Oppdateringsfrekvens: Daglig
Sjekk ut Ownership Explorer, som inneholder en liste over de høyest rangerte selskapene.
Institusjonell Put/Call-forhold
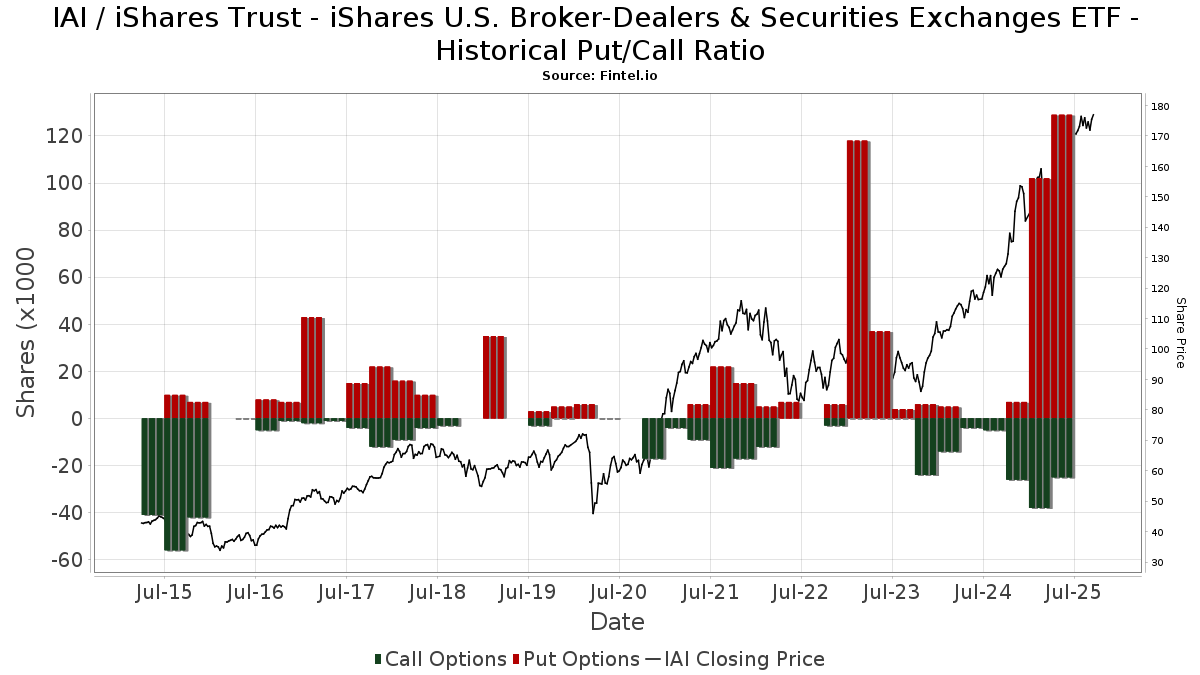
I tillegg til å rapportere standard aksje- og gjeldsemisjoner må institusjoner med mer enn 100 millioner kroner i forvaltningskapital også oppgi beholdningen av put- og callopsjoner. Siden put-opsjoner generelt indikerer et negativt sentiment, og call-opsjoner indikerer et positivt sentiment, kan vi få et inntrykk av det generelle institusjonelle sentimentet ved å plotte forholdet mellom put- og call-opsjoner. Diagrammet til høyre viser det historiske forholdet mellom put- og call-opsjoner for dette instrumentet.
Ved å bruke Put/Call-forholdet som en indikator på investorsentimentet kan man overvinne en av de viktigste svakhetene ved å bruke totalt institusjonelt eierskap, nemlig at en betydelig andel av forvaltningskapitalen investeres passivt for å følge indekser. Passivt forvaltede fond kjøper vanligvis ikke opsjoner, slik at indikatoren for put/call-forhold i større grad gjenspeiler stemningen i aktivt forvaltede fond.
13D/G-arkiveringer
Vi presenterer 13D/G-arkiveringene separat fra 13F-arkiveringene fordi de behandles forskjellig av SEC. 13D/G-arkiveringene kan sendes inn av grupper av investorer (med én leder), mens 13D/G-arkiveringene ikke kan sendes inn. Dette fører til situasjoner der en investor kan sende inn en 13D/G-rapport med én verdi for alle aksjene (som representerer alle aksjene som eies av investorgruppen), men deretter sende inn en 13F-melding med en annen verdi for alle aksjene (som kun representerer deres eget eierskap). Dette betyr at aksjeeierskap i 13D/G-arkiveringene og 13F-arkiveringene ofte ikke er direkte sammenlignbare, og vi presenterer dem derfor separat.
Merk: Fra og med 16. mai 2021 viser vi ikke lenger eiere som ikke har sendt inn en 13D/G i løpet av det siste året. Tidligere viste vi hele historikken for 13D/G-arkiveringer. Generelt må enheter som er pålagt å sende inn 13D/G-arkiveringer, sende inn minst én gang i året før de sender inn en avsluttende rapport. Det hender imidlertid at fond trekker seg ut av posisjoner uten å sende inn en avsluttende innlevering (dvs. at de avvikler), slik at visning av hele historikken av og til fører til forvirring om det nåværende eierskapet. For å unngå forvirring viser vi nå bare "nåværende" eiere, det vil si eiere som har sendt inn informasjon i løpet av det siste året.
Upgrade to unlock premium data.
| Fildato | Skjema | Investor | Tidligere aksjer |
Siste aksjer |
Δ Aksjer (prosent) |
Eierandel (prosent) |
Δ Eierandel (prosent) |
|
|---|---|---|---|---|---|---|---|---|
| 2025-04-28 | TRUIST FINANCIAL CORP | 722,350 | 14,294 | -98.02 | 0.20 | -96.55 |
13F- og NPORT-arkiveringer
Detaljer om 13F-arkiveringer er gratis. Detaljer om NP-arkiveringer krever et premium-medlemskap. Grønne rader indikerer nye posisjoner. Røde rader indikerer lukkede posisjoner. Klikk på lenke ikonet for å se hele transaksjonshistorikken.
Oppgrader
for å låse opp premiedata og eksportere til Excel. ![]() .
.
| Fildato | Kilde | Investor | Type | Gjennomsnittlig pris (estimert) |
Aksjer | Δ Aksjer (%) |
Rapportert verdi ($1000) | Verdi (%) | Portallokering (%) | |
|---|---|---|---|---|---|---|---|---|---|---|
| 2025-07-14 | 13F | Sowell Financial Services LLC | 1 464 | 248 | ||||||
| 2025-07-10 | 13F | Global Financial Private Client, LLC | 4 728 | 30,39 | 800 | 57,28 | ||||
| 2025-08-14 | 13F | Chicago Wealth Management, Inc. | 78 408 | −0,94 | 13 262 | 19,59 | ||||
| 2025-07-28 | 13F | Axxcess Wealth Management, Llc | 1 335 | 226 | ||||||
| 2025-07-14 | 13F | Park Avenue Securities Llc | 3 735 | 8,86 | 1 | |||||
| 2025-08-01 | 13F | Envestnet Asset Management Inc | 103 508 | −19,47 | 17 507 | −2,79 | ||||
| 2025-08-14 | 13F | GWM Advisors LLC | 4 899 | 0,04 | 829 | 20,70 | ||||
| 2025-08-14 | 13F | Tudor Financial Inc. | 18 426 | −2,25 | 3 117 | 17,99 | ||||
| 2025-08-04 | 13F | Assetmark, Inc | 6 588 | −98,85 | 1 114 | −98,62 | ||||
| 2025-08-27 | NP | XNAV - FundX Aggressive ETF | 0 | −100,00 | 0 | −100,00 | ||||
| 2025-08-14 | 13F | D. E. Shaw & Co., Inc. | 4 029 | −70,87 | 681 | −64,84 | ||||
| 2025-08-13 | 13F | Walleye Capital LLC | 3 934 | 665 | ||||||
| 2025-08-13 | 13F | EverSource Wealth Advisors, LLC | 39 | 0,00 | 7 | 20,00 | ||||
| 2025-08-14 | 13F | Two Sigma Securities, Llc | 0 | −100,00 | 0 | |||||
| 2025-08-14 | 13F | Synovus Financial Corp | 7 826 | 0,18 | 1 324 | 21,02 | ||||
| 2025-05-01 | 13F | Stephens Inc /ar/ | 0 | −100,00 | 0 | |||||
| 2025-06-17 | 13F | Howe & Rusling Inc | 0 | −100,00 | 0 | |||||
| 2025-07-15 | 13F | North Star Investment Management Corp. | 1 645 | −5,57 | 278 | 13,93 | ||||
| 2025-08-05 | 13F | Sigma Planning Corp | 2 291 | −0,35 | 387 | 20,19 | ||||
| 2025-08-04 | 13F | Balentine LLC | 443 | 0,00 | 75 | 19,35 | ||||
| 2025-08-06 | 13F | Black Swift Group, LLC | 0 | −100,00 | 0 | |||||
| 2025-08-11 | 13F | Private Advisor Group, LLC | 1 934 | 327 | ||||||
| 2025-08-05 | 13F | Bank of New York Mellon Corp | 2 076 | −0,38 | 351 | 20,62 | ||||
| 2025-08-15 | 13F | Kestra Advisory Services, LLC | 2 934 | 13,41 | 496 | 37,02 | ||||
| 2025-07-22 | 13F | DAVENPORT & Co LLC | 4 629 | −47,87 | 783 | −37,14 | ||||
| 2025-09-04 | 13F/A | Advisor Group Holdings, Inc. | 209 877 | 127,40 | 32 362 | 150,25 | ||||
| 2025-08-12 | 13F | Steward Partners Investment Advisory, Llc | 28 543 | 3,19 | 4 828 | 24,57 | ||||
| 2025-05-22 | 13F | Wbi Investments, Inc. | 0 | −100,00 | 0 | |||||
| 2025-08-04 | 13F | IFG Advisory, LLC | 7 101 | 377,86 | 1 201 | 477,40 | ||||
| 2025-08-14 | 13F | Stifel Financial Corp | 108 458 | 7,32 | 18 349 | 29,57 | ||||
| 2025-07-21 | 13F | Ascent Group, LLC | 0 | −100,00 | 0 | |||||
| 2025-07-25 | 13F | Envestnet Portfolio Solutions, Inc. | 2 213 | −60,51 | 374 | −52,36 | ||||
| 2025-08-13 | 13F | Russell Investments Group, Ltd. | 113 | 0,00 | 19 | 26,67 | ||||
| 2025-07-23 | 13F | Ignite Planners, LLC | 0 | −100,00 | 0 | |||||
| 2025-08-15 | 13F | Tower Research Capital LLC (TRC) | 0 | −100,00 | 0 | |||||
| 2025-05-15 | 13F | Hilltop Holdings Inc. | 0 | −100,00 | 0 | |||||
| 2025-08-08 | 13F | Woodley Farra Manion Portfolio Management Inc | 1 578 | 2,33 | 267 | 23,15 | ||||
| 2025-08-14 | 13F | Prelude Capital Management, Llc | 0 | −100,00 | 0 | |||||
| 2025-04-02 | 13F | Marcum Wealth, LLC | 0 | −100,00 | 0 | |||||
| 2025-07-25 | 13F | Muirfield Wealth Advisors Llc | 4 026 | −11,01 | 681 | 7,42 | ||||
| 2025-07-30 | 13F | WESPAC Advisors SoCal, LLC | 98 247 | −0,23 | 16 617 | 20,44 | ||||
| 2025-07-23 | 13F | WestEnd Advisors, LLC | 527 | −89,88 | 89 | −87,79 | ||||
| 2025-08-14 | 13F | Hrt Financial Lp | 0 | −100,00 | 0 | |||||
| 2025-08-05 | 13F | Bank Of Montreal /can/ | 12 | 0,00 | 2 | 100,00 | ||||
| 2025-08-26 | NP | CRTOX - Conquer Risk Tactical Opportunities Fund | 60 114 | −1,50 | 10 168 | 15,61 | ||||
| 2025-08-01 | 13F | Rossby Financial, LCC | 272 | 0,00 | 46 | 24,32 | ||||
| 2025-08-14 | 13F | Glen Eagle Advisors, LLC | 2 125 | 0,00 | 359 | 20,88 | ||||
| 2025-07-31 | 13F | Cambridge Investment Research Advisors, Inc. | 3 202 | 45,61 | 1 | |||||
| 2025-07-23 | 13F | WESPAC Advisors, LLC | 1 663 | 0,00 | 281 | 20,60 | ||||
| 2025-08-11 | 13F | HighTower Advisors, LLC | Put | 0 | −100,00 | 0 | ||||
| 2025-08-14 | 13F | CIBC World Markets Inc. | 2 209 | 374 | ||||||
| 2025-08-12 | 13F | Claudia M.p. Batlle, Crp (r) Llc | 0 | −100,00 | 0 | |||||
| 2025-07-15 | 13F | EWG Elevate Inc. | 0 | −100,00 | 0 | |||||
| 2025-08-11 | 13F | HighTower Advisors, LLC | Call | 0 | −100,00 | 0 | −100,00 | |||
| 2025-04-29 | 13F | Pensionmark Financial Group, Llc | 0 | −100,00 | 0 | |||||
| 2025-07-16 | 13F | Minichmacgregor Wealth Management, Llc | 64 187 | 25,60 | 10 857 | 51,62 | ||||
| 2025-08-04 | 13F | Bristlecone Advisors, LLC | 550 | 0,00 | 93 | 20,78 | ||||
| 2025-07-09 | 13F | Massmutual Trust Co Fsb/adv | 44 | 7 | ||||||
| 2025-08-11 | 13F | HHM Wealth Advisors, LLC | 77 | 0,00 | 13 | 30,00 | ||||
| 2025-08-19 | 13F | Advisory Services Network, LLC | 84 695 | 3,46 | 14 876 | 29,70 | ||||
| 2025-08-19 | 13F | Anchor Investment Management, LLC | 81 | 0,00 | 14 | 18,18 | ||||
| 2025-07-15 | 13F | Well Done, LLC | 37 230 | −0,96 | 6 297 | 16,27 | ||||
| 2025-08-07 | 13F | Allworth Financial LP | 6 620 | −12,28 | 1 120 | 7,29 | ||||
| 2025-08-06 | 13F | Commonwealth Equity Services, Llc | 6 265 | 32,76 | 1 | |||||
| 2025-08-11 | 13F | SFI Advisors, LLC | 40 485 | −6,55 | 6 848 | 12,82 | ||||
| 2025-08-14 | 13F | Federation des caisses Desjardins du Quebec | 100 | 0,00 | 17 | 14,29 | ||||
| 2025-08-13 | 13F | Pinkerton Retirement Specialists, LLC | 0 | −100,00 | 0 | |||||
| 2025-08-14 | 13F | Mariner, LLC | 19 769 | 13,08 | 3 344 | 36,50 | ||||
| 2025-05-15 | 13F | Schonfeld Strategic Advisors LLC | 0 | −100,00 | 0 | |||||
| 2025-07-17 | 13F | Paradigm Financial Partners, Llc | 6 932 | 1 172 | ||||||
| 2025-07-17 | 13F | Janney Montgomery Scott LLC | 27 847 | −40,14 | 5 | −33,33 | ||||
| 2025-07-10 | 13F | Wealth Enhancement Advisory Services, Llc | 1 631 | 280 | ||||||
| 2025-05-14 | 13F | Caitlin John, LLC | 0 | −100,00 | 0 | |||||
| 2025-07-16 | 13F | Southern Capital Advisors, Llc | 3 644 | −3,37 | 616 | 16,67 | ||||
| 2025-04-29 | 13F | Lee Danner & Bass Inc | 0 | −100,00 | 0 | −100,00 | ||||
| 2025-05-09 | 13F | Legacy Capital Group California, Inc. | 0 | −100,00 | 0 | |||||
| 2025-08-12 | 13F | O'shaughnessy Asset Management, Llc | 1 154 | −6,33 | 195 | 13,37 | ||||
| 2025-08-13 | 13F | Navis Wealth Advisors, LLC | 2 500 | 0,00 | 423 | 20,57 | ||||
| 2025-07-16 | 13F/A | CX Institutional | 1 039 | −24,87 | 0 | |||||
| 2025-07-28 | 13F | Harbour Investments, Inc. | 393 | 0,00 | 66 | 20,00 | ||||
| 2025-07-24 | 13F | Us Bancorp \de\ | 200 | 0,00 | 34 | 17,86 | ||||
| 2025-08-12 | 13F | Proequities, Inc. | 0 | 0 | ||||||
| 2025-07-15 | 13F | Heritage Oak Wealth Advisors Llc | 14 932 | 0,43 | 2 526 | 21,22 | ||||
| 2025-07-23 | 13F | Kingswood Wealth Advisors, Llc | 1 410 | −34,39 | 238 | −20,93 | ||||
| 2025-08-29 | 13F | Centaurus Financial, Inc. | 1 802 | 30,39 | 0 | |||||
| 2025-05-13 | 13F | Adviser Investments LLC | 0 | −100,00 | 0 | |||||
| 2025-04-16 | 13F | RMR Wealth Builders | 0 | −100,00 | 0 | |||||
| 2025-07-31 | 13F | Glass Jacobson Investment Advisors llc | 20 | 0,00 | 3 | 50,00 | ||||
| 2025-07-25 | 13F | Prostatis Group LLC | 0 | −100,00 | 0 | |||||
| 2025-08-12 | 13F | Founders Financial Alliance, LLC | 234 | 0,43 | 40 | 21,88 | ||||
| 2025-08-14 | 13F | Sunbelt Securities, Inc. | 293 | 614,63 | 42 | 740,00 | ||||
| 2025-07-14 | 13F | Abound Wealth Management | 32 | 0,00 | 5 | 25,00 | ||||
| 2025-08-05 | 13F | Huntington National Bank | 0 | −100,00 | ||||||
| 2025-08-13 | 13F | Summit Financial, LLC | 2 321 | −1,44 | 393 | 19,15 | ||||
| 2025-08-14 | 13F | Wiley Bros.-aintree Capital, Llc | 8 492 | −1,66 | 1 436 | 19,37 | ||||
| 2025-04-09 | 13F | Harbor Investment Advisory, Llc | 0 | −100,00 | 0 | |||||
| 2025-08-18 | 13F | Wolverine Trading, Llc | Call | 2 200 | −73,49 | 367 | −68,37 | |||
| 2025-07-31 | 13F | Hanlon Investment Management, Inc. | 0 | −100,00 | 0 | |||||
| 2025-08-18 | 13F | Wolverine Trading, Llc | Put | 7 500 | 97,37 | 1 250 | 136,29 | |||
| 2025-05-14 | 13F | Eqis Capital Management, Inc. | 0 | −100,00 | 0 | −100,00 | ||||
| 2025-08-18 | 13F | Wolverine Trading, Llc | 4 052 | 675 | ||||||
| 2025-07-24 | 13F | Blair William & Co/il | 348 | 840,54 | 59 | 1 060,00 | ||||
| 2025-08-12 | 13F | SRS Capital Advisors, Inc. | 156 | 0,00 | 26 | 23,81 | ||||
| 2025-08-12 | 13F | MAI Capital Management | 17 | 0,00 | 3 | 0,00 | ||||
| 2025-07-29 | 13F | Swmg, Llc | 1 440 | 252 | ||||||
| 2025-08-14 | 13F | Ausdal Financial Partners, Inc. | 1 449 | 245 | ||||||
| 2025-08-06 | 13F | Founders Financial Securities Llc | 27 562 | 4 662 | ||||||
| 2025-08-14 | 13F | Wells Fargo & Company/mn | 158 936 | −3,98 | 26 882 | 15,92 | ||||
| 2025-08-12 | 13F | Integrated Advisors Network LLC | 1 195 | 202 | ||||||
| 2025-08-14 | 13F | Fmr Llc | 3 963 | 2,01 | 670 | 23,16 | ||||
| 2025-08-08 | 13F | Altfest L J & Co Inc | 0 | −100,00 | 0 | |||||
| 2025-07-24 | 13F | Eastern Bank | 880 | 0,00 | 149 | 20,33 | ||||
| 2025-08-08 | 13F | Hartland & Co., LLC | 138 | 0,73 | 23 | 21,05 | ||||
| 2025-07-17 | 13F | Halbert Hargrove Global Advisors, Llc | 74 | 0,00 | 13 | 20,00 | ||||
| 2025-07-25 | 13F | Genesee Capital Advisors, LLC | 9 389 | 59,16 | 1 588 | 92,25 | ||||
| 2025-08-14 | 13F | Ameriprise Financial Inc | 118 858 | −26,62 | 20 098 | −11,43 | ||||
| 2025-07-18 | 13F | McGuire Investment Group, LLC | 31 550 | 0,01 | 5 336 | 20,75 | ||||
| 2025-08-14 | 13F | Citadel Advisors Llc | 26 693 | −26,80 | 4 515 | −11,65 | ||||
| 2025-08-14 | 13F | Citadel Advisors Llc | Put | 3 100 | 63,16 | 524 | 96,99 | |||
| 2025-08-04 | 13F | Atria Investments Llc | 7 545 | −25,86 | 1 276 | −10,46 | ||||
| 2025-07-25 | 13F | Atria Wealth Solutions, Inc. | 17 571 | −30,29 | 2 972 | −15,83 | ||||
| 2025-08-06 | 13F | Prospera Financial Services Inc | 61 258 | −0,84 | 10 361 | 19,71 | ||||
| 2025-07-02 | 13F | HBW Advisory Services LLC | 2 968 | −9,92 | 502 | 8,89 | ||||
| 2025-07-21 | 13F | Jackson Wealth Management, LLC | 5 089 | 2,17 | 861 | 23,35 | ||||
| 2025-08-14 | 13F | Mml Investors Services, Llc | 204 235 | 36,78 | 35 | 70,00 | ||||
| 2025-08-14 | 13F | Citadel Advisors Llc | Call | 5 700 | 235,29 | 964 | 305,04 | |||
| 2025-08-13 | 13F | VestGen Advisors, LLC | 16 684 | 10,70 | 2 822 | 33,63 | ||||
| 2025-08-14 | 13F | Arete Wealth Advisors, LLC | 13 712 | 581,85 | 2 | |||||
| 2025-08-14 | 13F | Royal Bank Of Canada | 90 140 | −0,20 | 15 247 | 20,48 | ||||
| 2025-08-14 | 13F | Integrated Wealth Concepts LLC | 4 102 | 694 | ||||||
| 2025-04-28 | 13F | First Horizon Advisors, Inc. | 0 | −100,00 | 0 | −100,00 | ||||
| 2025-08-13 | 13F | Quadrature Capital Ltd | 0 | −100,00 | 0 | |||||
| 2025-08-14 | 13F | UBS Group AG | 80 710 | 14,56 | 13 651 | 38,29 | ||||
| 2025-08-12 | 13F | Resolute Wealth Strategies, LLC | 1 892 | −17,77 | 320 | −0,62 | ||||
| 2025-07-02 | 13F | Central Pacific Bank - Trust Division | 30 | 0,00 | 5 | 25,00 | ||||
| 2025-08-11 | 13F | Aptus Capital Advisors, LLC | 22 | 0,00 | 4 | 0,00 | ||||
| 2025-08-15 | 13F | Equitable Holdings, Inc. | 5 367 | 185,33 | 908 | 244,87 | ||||
| 2025-07-07 | 13F | Thurston, Springer, Miller, Herd & Titak, Inc. | 294 | 0,00 | 50 | 19,51 | ||||
| 2025-08-14 | 13F | KKM Financial LLC | 1 479 | −26,12 | 250 | −10,71 | ||||
| 2025-08-14 | 13F | First International Bank of Israel Ltd. | 3 060 | 518 | ||||||
| 2025-04-10 | 13F | Secure Asset Management, LLC | 0 | −100,00 | 0 | −100,00 | ||||
| 2025-08-13 | 13F | Whalerock Point Partners, Llc | 1 227 | 208 | ||||||
| 2025-04-23 | 13F | Phillips Wealth Planners LLC | 0 | −100,00 | 0 | |||||
| 2025-07-16 | 13F | Cadent Capital Advisors, LLC | 27 637 | 80,21 | 4 675 | 117,60 | ||||
| 2025-07-24 | 13F | IFP Advisors, Inc | 263 | 39,15 | 44 | 69,23 | ||||
| 2025-08-14 | 13F | Peapack Gladstone Financial Corp | 1 200 | 0 | ||||||
| 2025-08-14 | 13F | Fwl Investment Management, Llc | 560 | 95 | ||||||
| 2025-08-15 | 13F | Morgan Stanley | 461 962 | −1,77 | 78 136 | 18,59 | ||||
| 2025-08-14 | 13F | Bank Of America Corp /de/ | 312 309 | 75,53 | 52 824 | 111,89 | ||||
| 2025-08-13 | 13F | Lido Advisors, LLC | 4 700 | −2,97 | 795 | 17,26 | ||||
| 2025-04-29 | 13F | Concurrent Investment Advisors, LLC | 0 | −100,00 | 0 | |||||
| 2025-05-09 | 13F | CoreCap Advisors, LLC | 0 | −100,00 | 0 | |||||
| 2025-08-01 | 13F | Belvedere Trading LLC | Put | 22 100 | 3 738 | |||||
| 2025-08-05 | 13F | Kesler, Norman & Wride, LLC | 2 945 | 3,55 | 498 | 25,13 | ||||
| 2025-08-14 | 13F | Peak6 Llc | Call | 0 | −100,00 | 0 | ||||
| 2025-07-22 | 13F | Wealthcare Advisory Partners LLC | 1 476 | −60,82 | 250 | −52,75 | ||||
| 2025-08-07 | 13F | David R. Rahn & Associates Inc. | 0 | −100,00 | 0 | |||||
| 2025-08-14 | 13F | Raymond James Financial Inc | 76 156 | −25,08 | 12 881 | −9,56 | ||||
| 2025-07-17 | 13F | Fifth Third Securities, Inc. | 5 917 | −10,57 | 1 001 | 7,99 | ||||
| 2025-07-28 | 13F | Duncker Streett & Co Inc | 48 | 0,00 | 8 | 33,33 | ||||
| 2025-08-14 | 13F | Jane Street Group, Llc | 0 | −100,00 | 0 | |||||
| 2025-07-31 | 13F | Brinker Capital Investments, LLC | 0 | −100,00 | 0 | −100,00 | ||||
| 2025-07-29 | 13F | Cottonwood Capital Advisors, Llc | 19 512 | −0,95 | 3 300 | 19,57 | ||||
| 2025-08-13 | 13F | Jones Financial Companies Lllp | 8 564 | 22,06 | 1 427 | 45,91 | ||||
| 2025-07-15 | 13F | Affinity Wealth Management Llc | 0 | −100,00 | 0 | |||||
| 2025-08-13 | 13F | National Bank Of Canada /fi/ | 0 | −100,00 | 0 | |||||
| 2025-07-28 | 13F | Alpine Woods Capital Investors, Llc | 3 000 | 0,00 | 507 | 20,71 | ||||
| 2025-04-24 | 13F | Transcend Wealth Collective, Llc | 0 | −100,00 | 0 | |||||
| 2025-08-08 | 13F | Cetera Investment Advisers | 33 134 | −12,00 | 5 604 | 6,24 | ||||
| 2025-08-12 | 13F | Jpmorgan Chase & Co | 2 551 | −54,00 | 431 | −44,53 | ||||
| 2025-08-06 | 13F | Csenge Advisory Group | 10 119 | −0,64 | 1 564 | 16,21 | ||||
| 2025-07-25 | 13F | Cwm, Llc | 90 | 109,30 | 0 | |||||
| 2025-05-09 | 13F | GeoWealth Management, LLC | 0 | −100,00 | 0 | |||||
| 2025-05-15 | 13F | Warren Averett Asset Management, LLC | 0 | −100,00 | 0 | |||||
| 2025-08-05 | 13F | Simplex Trading, Llc | 1 012 | 0 | ||||||
| 2025-08-14 | 13F | Clark Capital Management Group, Inc. | 20 313 | −10,74 | 3 436 | 7,75 | ||||
| 2025-08-11 | 13F | Cornerstone Planning Group LLC | 76 | 0,00 | 13 | 30,00 | ||||
| 2025-04-10 | 13F | CPR Investments Inc. | 0 | −100,00 | 0 | |||||
| 2025-07-22 | 13F | Belpointe Asset Management LLC | 7 832 | −3,00 | 1 325 | 17,06 | ||||
| 2025-09-03 | 13F | Q3 Asset Management | 3 252 | 1 | ||||||
| 2025-08-11 | 13F | HighTower Advisors, LLC | 42 303 | 9,47 | 7 155 | 32,16 | ||||
| 2025-08-11 | 13F | One Capital Management, LLC | 0 | −100,00 | 0 | |||||
| 2025-08-11 | 13F | Citigroup Inc | 2 639 | 97,68 | 446 | 138,50 | ||||
| 2025-08-13 | 13F | Baird Financial Group, Inc. | 7 809 | −0,61 | 1 321 | 20,00 | ||||
| 2025-08-12 | 13F | CIBC Private Wealth Group, LLC | 359 | −26,73 | 61 | 1,69 | ||||
| 2025-08-13 | 13F | Baker Avenue Asset Management, LP | 15 094 | 3,31 | 2 553 | 24,67 | ||||
| 2025-07-18 | 13F | Hudson Value Partners, LLC | 4 446 | −0,98 | 752 | 19,40 | ||||
| 2025-08-11 | 13F | Principal Securities, Inc. | 2 276 | −12,86 | 385 | 2,39 | ||||
| 2025-08-13 | 13F | Northwestern Mutual Wealth Management Co | 904 | −11,20 | 153 | 7,04 | ||||
| 2025-08-05 | 13F | Harel Insurance Investments & Financial Services Ltd. | 640 000 | 0,00 | 108 | 21,35 | ||||
| 2025-07-29 | 13F | Private Trust Co Na | 507 | 299,21 | 86 | 400,00 | ||||
| 2025-08-08 | 13F | Pnc Financial Services Group, Inc. | 652 | −0,46 | 110 | 20,88 | ||||
| 2025-08-04 | 13F | Integrity Alliance, Llc. | 0 | −100,00 | 0 | |||||
| 2025-08-14 | 13F | Bnp Paribas Arbitrage, Sa | 0 | −100,00 | 0 | |||||
| 2025-05-16 | 13F/A | Atlanta Consulting Group Advisors, LLC | 0 | −100,00 | 0 | |||||
| 2025-08-13 | 13F/A | StoneX Group Inc. | 2 844 | 52,82 | 284 | 38,54 | ||||
| 2025-08-13 | 13F | Great Diamond Partners, LLC | 15 109 | −4,69 | 2 556 | 15,04 | ||||
| 2025-08-13 | 13F | Millstone Evans Group, LLC | 14 | 0,00 | 2 | 100,00 | ||||
| 2025-05-08 | 13F | BRYN MAWR TRUST Co | 0 | −100,00 | 0 | |||||
| 2025-07-25 | 13F | SPC Financial, Inc. | 168 858 | −0,50 | 28 561 | 20,11 | ||||
| 2025-07-29 | 13F | Robinson Value Management, Ltd. | 9 047 | 0,00 | 1 530 | 20,76 | ||||
| 2025-05-12 | 13F | SOUTH STATE Corp | 0 | −100,00 | 0 | |||||
| 2025-07-11 | 13F | Farther Finance Advisors, LLC | 1 188 | 1 700,00 | 201 | 2 122,22 | ||||
| 2025-08-08 | 13F | Capital Investment Advisory Services, LLC | 6 | −88,68 | 1 | −85,71 | ||||
| 2025-08-14 | 13F | Susquehanna International Group, Llp | 31 508 | 21,69 | 5 329 | 46,93 | ||||
| 2025-07-10 | 13F | Focus Financial Network, Inc. | 1 449 | 245 | ||||||
| 2025-07-09 | 13F | Client First Investment Management LLC | 4 677 | 791 | ||||||
| 2025-08-14 | 13F | Susquehanna International Group, Llp | Call | 17 800 | −12,75 | 3 011 | 5,32 | |||
| 2025-08-14 | 13F | Susquehanna International Group, Llp | Put | 96 900 | 0,21 | 16 390 | 20,97 | |||
| 2025-08-19 | 13F | Newbridge Financial Services Group, Inc. | 100 | 17 | ||||||
| 2025-07-17 | 13F | Wagner Wealth Management, Llc | 141 | 24 | ||||||
| 2025-07-24 | 13F | Game Plan Financial Advisors, LLC | 100 | 0,00 | 17 | 14,29 | ||||
| 2025-08-06 | 13F | AE Wealth Management LLC | 191 | 141,77 | 32 | 190,91 | ||||
| 2025-05-16 | 13F/A | Kestra Investment Management, LLC | 0 | −100,00 | 0 | |||||
| 2025-08-01 | 13F | Chilton Capital Management Llc | 0 | −100,00 | 0 | |||||
| 2025-07-15 | 13F | Ballentine Partners, LLC | 1 300 | 220 | ||||||
| 2025-08-14 | 13F | Aprio Wealth Management, LLC | 5 481 | −4,98 | 927 | 14,60 | ||||
| 2025-07-16 | 13F | Signaturefd, Llc | 201 | 20 000,00 | 34 | |||||
| 2025-08-13 | 13F | Flow Traders U.s. Llc | 0 | −100,00 | 0 | |||||
| 2025-08-14 | 13F | Goldman Sachs Group Inc | 0 | −100,00 | 0 | |||||
| 2025-08-11 | 13F | TD Waterhouse Canada Inc. | 189 | 26,00 | 32 | 47,62 | ||||
| 2025-08-14 | 13F | Qube Research & Technologies Ltd | 31 343 | 58,00 | 5 301 | 90,75 | ||||
| 2025-08-14 | 13F | Two Sigma Investments, Lp | 202 400 | 2,79 | 34 234 | 24,09 | ||||
| 2025-08-12 | 13F | LPL Financial LLC | 374 163 | 236,84 | 63 286 | 306,64 | ||||
| 2025-08-14 | 13F | Coastal Bridge Advisors, LLC | 1 189 | −18,23 | 201 | −0,99 | ||||
| 2025-07-18 | 13F | Truist Financial Corp | 12 049 | −15,71 | 2 038 | 1,80 | ||||
| 2025-08-08 | 13F | Glassman Wealth Services | 0 | −100,00 | 0 | |||||
| 2025-08-11 | 13F | ARS Investment Partners, LLC | 15 917 | 2 692 | ||||||
| 2025-07-25 | 13F | Hazlett, Burt & Watson, Inc. | 126 | 0,00 | 0 | |||||
| 2025-07-30 | 13F | Strategic Blueprint, LLC | 1 513 | 4,78 | 256 | 26,24 | ||||
| 2025-08-13 | 13F | Renaissance Technologies Llc | 2 600 | 440 | ||||||
| 2025-05-01 | 13F | Fulcrum Equity Management | 0 | −100,00 | 0 | |||||
| 2025-08-14 | 13F | Harwood Advisory Group, LLC | 9 | 2 | ||||||
| 2025-07-23 | 13F | 1 North Wealth Services Llc | 19 391 | −1,01 | 3 280 | 19,50 | ||||
| 2025-07-11 | 13F | Seacrest Wealth Management, Llc | 2 494 | −5,03 | 422 | 14,71 | ||||
| 2025-08-14 | 13F | Family Management Corp | 10 | 0,00 | 2 | 0,00 | ||||
| 2025-08-04 | 13F | Spire Wealth Management | 352 | −5,88 | 60 | 13,46 | ||||
| 2025-08-13 | 13F | Fisher Asset Management, LLC | 684 053 | −3,68 | 115 701 | 16,28 | ||||
| 2025-08-14 | 13F | Barometer Capital Management Inc. | 3 100 | 524 | ||||||
| 2025-08-07 | 13F | Apeiron RIA LLC | 5 578 | 1,97 | 943 | 23,11 | ||||
| 2025-08-11 | 13F | Beaumont Capital Management, LLC | 0 | −100,00 | 0 | |||||
| 2025-04-24 | 13F | Total Wealth Planning & Management, Inc. | 0 | −100,00 | 0 | |||||
| 2025-08-12 | 13F | Trexquant Investment LP | 0 | −100,00 | 0 | |||||
| 2025-08-08 | 13F | Gts Securities Llc | 0 | −100,00 | 0 | |||||
| 2025-08-12 | 13F | Global Retirement Partners, LLC | 909 | 100,66 | 154 | 135,38 | ||||
| 2025-08-12 | 13F | BlackRock, Inc. | 414 | 0,73 | 70 | 22,81 | ||||
| 2025-07-15 | 13F | Fifth Third Bancorp | 288 | 0,00 | 49 | 20,00 | ||||
| 2025-08-14 | 13F | Comerica Bank | 57 | −48,18 | 10 | −40,00 | ||||
| 2025-07-17 | 13F | Lee Johnson Capital Management, Llc | 10 452 | 1 768 | ||||||
| 2025-05-02 | 13F | Cullen/frost Bankers, Inc. | 0 | −100,00 | 0 | |||||
| 2025-08-14 | 13F | Great Valley Advisor Group, Inc. | 12 048 | −1,77 | 2 038 | 18,57 | ||||
| 2025-04-21 | 13F | Harrell Investment Partners, Llc | 0 | −100,00 | 0 | |||||
| 2025-05-02 | 13F | Victory Capital Management Inc | 0 | −100,00 | 0 | −100,00 | ||||
| 2025-05-07 | 13F | Evermay Wealth Management Llc | 0 | −100,00 | 0 | −100,00 | ||||
| 2025-07-17 | 13F | Janney Capital Management LLC | 3 208 | −0,03 | 1 |
Other Listings
| MX:IAI |