Grunnleggende statistikk
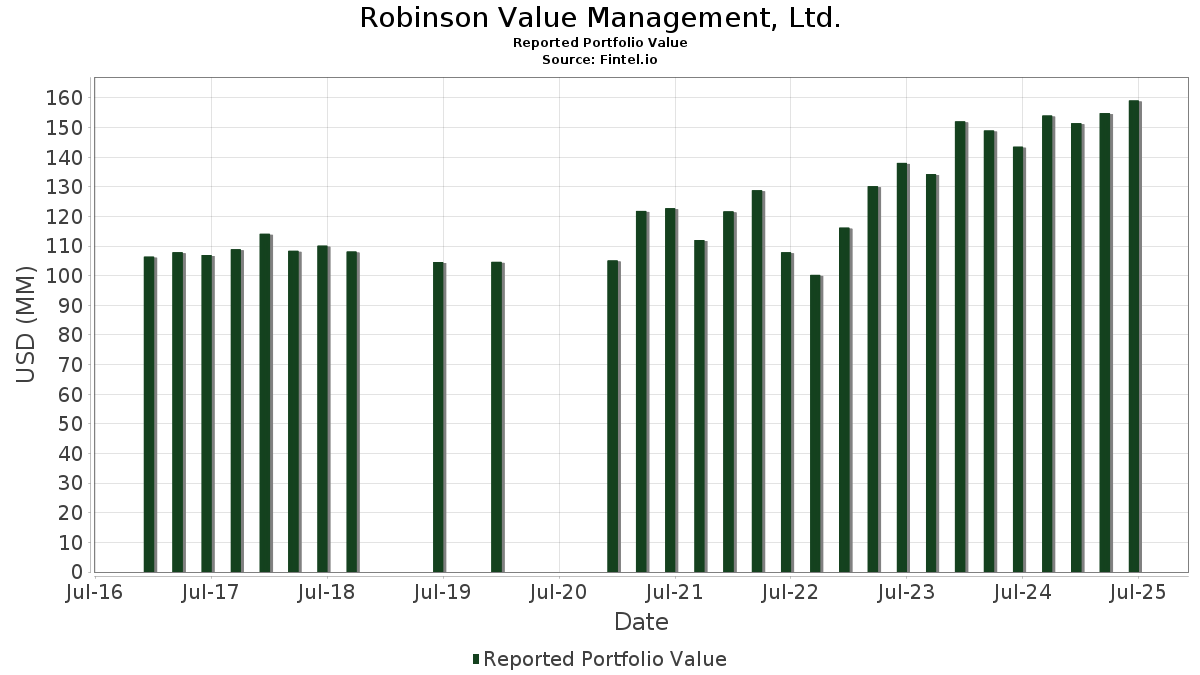
| Porteføljeverdi | $ 159 130 266 |
| Nåværende posisjoner | 69 |
Siste beholdninger, prestasjoner, forvaltet kapital (fra 13F, 13D)
Robinson Value Management, Ltd. har oppgitt 69 totale beholdninger i sine siste SEC-arkiveringer. Siste porteføljeverdi er beregnet til 159 130 266 USD. Faktisk forvaltet kapital (AUM) er denne verdien pluss kontanter (som ikke er oppgitt). Robinson Value Management, Ltd.s største beholdninger er ProShares Trust - ProShares Ultra S&P500 (US:SSO) , Newmont Corporation (US:NEM) , Wells Fargo & Company (US:WFC) , Archer-Daniels-Midland Company (US:ADM) , and M&T Bank Corporation (US:MTB) . Robinson Value Management, Ltd.s nye posisjoner inkluderer Advanced Micro Devices, Inc. (US:AMD) , ProShares Trust - ProShares Short QQQ (MX:PSQ) , .
De største økningene dette kvartalet
Vi bruker endringen i porteføljeallokeringen fordi dette er det mest meningsfulle målet. Endringer kan skyldes handler eller endringer i aksjekursene.
| Verdipapirer | Aksjer (MM) |
Verdi (MM$) |
Portefølje % | ΔPortefølje % |
|---|---|---|---|---|
| 0,24 | 23,07 | 14,4997 | 14,4997 | |
| 0,03 | 3,62 | 2,2776 | 2,2776 | |
| 0,01 | 4,52 | 2,8394 | 1,5051 | |
| 0,03 | 0,95 | 0,5982 | 0,5982 | |
| 0,11 | 6,23 | 3,9131 | 0,4839 | |
| 0,01 | 3,09 | 1,9431 | 0,3739 | |
| 0,03 | 3,87 | 2,4326 | 0,3441 | |
| 0,09 | 4,92 | 3,0898 | 0,3276 | |
| 0,06 | 5,16 | 3,2443 | 0,2371 | |
| 0,04 | 3,68 | 2,3120 | 0,2158 |
De største reduksjonene dette kvartalet
Vi bruker endringen i porteføljeallokeringen fordi dette er det mest meningsfulle målet. Endringer kan skyldes handler eller endringer i aksjekurser.
| Verdipapirer | Aksjer (MM) |
Verdi (MM$) |
Portefølje % | ΔPortefølje % |
|---|---|---|---|---|
| 0,00 | 0,00 | 0,0001 | −7,0143 | |
| 0,16 | 4,37 | 2,7475 | −1,3209 | |
| 0,06 | 2,10 | 1,3202 | −0,3612 | |
| 0,12 | 3,10 | 1,9488 | −0,3449 | |
| 0,06 | 3,71 | 2,3284 | −0,2997 | |
| 0,03 | 2,44 | 1,5351 | −0,2967 | |
| 0,01 | 1,37 | 0,8611 | −0,2294 | |
| 0,02 | 1,45 | 0,9102 | −0,1994 | |
| 0,05 | 4,70 | 2,9548 | −0,1969 | |
| 0,02 | 2,56 | 1,6107 | −0,1691 |
13F- og Fondsarkiveringer
Dette skjemaet ble sendt inn den 2025-07-29 for rapporteringsperioden 2025-06-30. Klikk på lenkeikonet for å se hele transaksjonshistorikken.
Oppgradere for å låse opp premiedata og eksportere til Excel![]() .
.
| Verdipapirer | Type | Gjennomsnittlig aksjekurs | Aksjer (MM) |
ΔAksjer (%) |
ΔAksjer (%) |
Verdi ($MM) |
Portefølje (%) |
ΔPortefølje (%) |
|
|---|---|---|---|---|---|---|---|---|---|
| SSO / ProShares Trust - ProShares Ultra S&P500 | 0,24 | 23,07 | 14,4997 | 14,4997 | |||||
| NEM / Newmont Corporation | 0,11 | −2,84 | 6,23 | 17,25 | 3,9131 | 0,4839 | |||
| WFC / Wells Fargo & Company | 0,06 | −0,67 | 5,16 | 10,84 | 3,2443 | 0,2371 | |||
| ADM / Archer-Daniels-Midland Company | 0,09 | −0,72 | 5,00 | 9,15 | 3,1418 | 0,1839 | |||
| MTB / M&T Bank Corporation | 0,03 | −0,52 | 4,95 | 7,96 | 3,1102 | 0,1502 | |||
| GLW / Corning Incorporated | 0,09 | 0,05 | 4,92 | 14,94 | 3,0898 | 0,3276 | |||
| MDT / Medtronic plc | 0,05 | −0,70 | 4,70 | −3,69 | 2,9548 | −0,1969 | |||
| ADBE / Adobe Inc. | 0,01 | 116,76 | 4,52 | 118,68 | 2,8394 | 1,5051 | |||
| SPTL / SPDR Series Trust - SPDR Portfolio Long Term Treasury ETF | 0,16 | −28,84 | 4,37 | −30,60 | 2,7475 | −1,3209 | |||
| QCOM / QUALCOMM Incorporated | 0,03 | −0,63 | 4,19 | 3,03 | 2,6315 | 0,0071 | |||
| D / Dominion Energy, Inc. | 0,07 | −0,82 | 3,97 | −0,03 | 2,4953 | −0,0691 | |||
| DIS / The Walt Disney Company | 0,03 | −4,75 | 3,87 | 19,67 | 2,4326 | 0,3441 | |||
| TLT / iShares Trust - iShares 20+ Year Treasury Bond ETF | 0,04 | 1,85 | 3,73 | −1,27 | 2,3418 | −0,0951 | |||
| IAU / iShares Gold Trust | 0,06 | −13,93 | 3,71 | −8,97 | 2,3284 | −0,2997 | |||
| WPM / Wheaton Precious Metals Corp. | 0,04 | −2,03 | 3,68 | 13,34 | 2,3120 | 0,2158 | |||
| AMD / Advanced Micro Devices, Inc. | 0,03 | 3,62 | 2,2776 | 2,2776 | |||||
| CMCSA / Comcast Corporation | 0,10 | −0,36 | 3,62 | −3,62 | 2,2776 | −0,1508 | |||
| MMM / 3M Company | 0,02 | −0,71 | 3,22 | 2,94 | 2,0256 | 0,0034 | |||
| WY / Weyerhaeuser Company | 0,12 | −0,50 | 3,10 | −12,70 | 1,9488 | −0,3449 | |||
| IDXX / IDEXX Laboratories, Inc. | 0,01 | −0,38 | 3,09 | 27,24 | 1,9431 | 0,3739 | |||
| RTX / RTX Corporation | 0,02 | −0,30 | 2,96 | 9,93 | 1,8576 | 0,1210 | |||
| SLV / iShares Silver Trust | 0,09 | −3,78 | 2,94 | 1,87 | 1,8472 | −0,0158 | |||
| EOG / EOG Resources, Inc. | 0,02 | −0,30 | 2,56 | −7,00 | 1,6107 | −0,1691 | |||
| IEI / iShares Trust - iShares 3-7 Year Treasury Bond ETF | 0,02 | −4,36 | 2,54 | −3,60 | 1,5993 | −0,1052 | |||
| GPC / Genuine Parts Company | 0,02 | −0,22 | 2,45 | 1,62 | 1,5419 | −0,0174 | |||
| OMC / Omnicom Group Inc. | 0,03 | −0,76 | 2,44 | −13,89 | 1,5351 | −0,2967 | |||
| DHI / D.R. Horton, Inc. | 0,02 | −0,41 | 2,41 | 1,01 | 1,5137 | −0,0263 | |||
| NKE / NIKE, Inc. | 0,03 | −0,23 | 2,35 | 11,69 | 1,4769 | 0,1178 | |||
| CVS / CVS Health Corporation | 0,03 | −0,23 | 2,28 | 1,56 | 1,4308 | −0,0165 | |||
| GSK / GSK plc - Depositary Receipt (Common Stock) | 0,06 | −0,48 | 2,18 | −1,36 | 1,3699 | −0,0569 | |||
| IEF / iShares Trust - iShares 7-10 Year Treasury Bond ETF | 0,02 | −4,76 | 2,15 | −4,37 | 1,3489 | −0,1002 | |||
| SLB / Schlumberger Limited | 0,06 | −0,23 | 2,10 | −19,35 | 1,3202 | −0,3612 | |||
| TROW / T. Rowe Price Group, Inc. | 0,02 | −0,22 | 1,95 | 4,83 | 1,2281 | 0,0241 | |||
| TM / Toyota Motor Corporation - Depositary Receipt (Common Stock) | 0,01 | −0,52 | 1,89 | −2,92 | 1,1904 | −0,0697 | |||
| TGT / Target Corporation | 0,02 | −0,31 | 1,84 | −5,75 | 1,1539 | −0,1042 | |||
| AKAM / Akamai Technologies, Inc. | 0,02 | −0,23 | 1,76 | −1,18 | 1,1077 | −0,0437 | |||
| INTC / Intel Corporation | 0,07 | −0,23 | 1,60 | −1,60 | 1,0073 | −0,0444 | |||
| SIVR / abrdn Silver ETF Trust - abrdn Physical Silver Shares ETF | 0,05 | 0,55 | 1,57 | 6,46 | 0,9843 | 0,0340 | |||
| XLK / The Select Sector SPDR Trust - The Technology Select Sector SPDR Fund | 0,01 | −0,57 | 1,55 | 21,95 | 0,9744 | 0,1534 | |||
| IAI / iShares Trust - iShares U.S. Broker-Dealers & Securities Exchanges ETF | 0,01 | 0,00 | 1,53 | 20,76 | 0,9616 | 0,1431 | |||
| SHY / iShares Trust - iShares 1-3 Year Treasury Bond ETF | 0,02 | −2,48 | 1,47 | −2,33 | 0,9231 | −0,0479 | |||
| GLDM / World Gold Trust - SPDR Gold MiniShares Trust | 0,02 | −20,39 | 1,45 | −15,72 | 0,9102 | −0,1994 | |||
| KRE / SPDR Series Trust - SPDR S&P Regional Banking ETF | 0,02 | 0,00 | 1,39 | 4,45 | 0,8712 | 0,0143 | |||
| CLX / The Clorox Company | 0,01 | −0,50 | 1,37 | −18,84 | 0,8611 | −0,2294 | |||
| FDX / FedEx Corporation | 0,01 | 0,24 | 1,31 | −6,57 | 0,8229 | −0,0817 | |||
| EWU / iShares Trust - iShares MSCI United Kingdom ETF | 0,03 | 0,35 | 1,28 | 6,33 | 0,8030 | 0,0273 | |||
| VNQ / Vanguard Specialized Funds - Vanguard Real Estate ETF | 0,01 | 0,00 | 1,21 | −1,62 | 0,7632 | −0,0340 | |||
| PSQ / ProShares Trust - ProShares Short QQQ | 0,03 | 0,95 | 0,5982 | 0,5982 | |||||
| IWD / iShares Trust - iShares Russell 1000 Value ETF | 0,00 | 1,88 | 0,73 | 5,22 | 0,4565 | 0,0105 | |||
| MSFT / Microsoft Corporation | 0,00 | 0,00 | 0,34 | 32,55 | 0,2126 | 0,0477 | |||
| SIL / Global X Funds - Global X Silver Miners ETF | 0,01 | 0,00 | 0,27 | 22,48 | 0,1678 | 0,0265 | |||
| PSLV / Sprott Physical Silver Trust | 0,02 | 0,00 | 0,24 | 5,70 | 0,1515 | 0,0040 | |||
| CEF / Sprott Physical Gold and Silver Trust | 0,01 | 0,00 | 0,24 | 6,19 | 0,1510 | 0,0046 | |||
| HD / The Home Depot, Inc. | 0,00 | 0,00 | 0,21 | 0,00 | 0,1343 | −0,0036 | |||
| AGI / Alamos Gold Inc. | 0,01 | 0,00 | 0,18 | −0,55 | 0,1132 | −0,0039 | |||
| SHV / iShares Trust - iShares Short Treasury Bond ETF | 0,00 | 0,00 | 0,18 | 0,00 | 0,1100 | −0,0031 | |||
| WEST / Westrock Coffee Company | 0,03 | 0,00 | 0,17 | −20,83 | 0,1080 | −0,0318 | |||
| MPC / Marathon Petroleum Corporation | 0,00 | 0,00 | 0,09 | 14,67 | 0,0543 | 0,0054 | |||
| BSV / Vanguard Bond Index Funds - Vanguard Short-Term Bond ETF | 0,00 | 0,00 | 0,08 | 0,00 | 0,0527 | −0,0012 | |||
| CFR / Cullen/Frost Bankers, Inc. | 0,00 | 0,00 | 0,06 | 3,23 | 0,0404 | −0,0000 | |||
| TMO / Thermo Fisher Scientific Inc. | 0,00 | 0,00 | 0,05 | −18,18 | 0,0341 | −0,0089 | |||
| KMB / Kimberly-Clark Corporation | 0,00 | 0,00 | 0,03 | −10,71 | 0,0162 | −0,0022 | |||
| COP / ConocoPhillips | 0,00 | 0,00 | 0,01 | −18,75 | 0,0086 | −0,0017 | |||
| MRK / Merck & Co., Inc. | 0,00 | 0,00 | 0,01 | −7,14 | 0,0083 | −0,0014 | |||
| MDLZ / Mondelez International, Inc. | 0,00 | 0,00 | 0,01 | 0,00 | 0,0070 | −0,0002 | |||
| NOG / Northern Oil and Gas, Inc. | 0,00 | 0,00 | 0,01 | −16,67 | 0,0036 | −0,0003 | |||
| UAL / United Airlines Holdings, Inc. | 0,00 | 0,00 | 0,00 | 50,00 | 0,0020 | 0,0002 | |||
| VCSH / Vanguard Scottsdale Funds - Vanguard Short-Term Corporate Bond ETF | 0,00 | −100,00 | 0,00 | −100,00 | 0,0001 | −7,0143 | |||
| BK / The Bank of New York Mellon Corporation | 0,00 | 0,00 | 0,00 | 0,0000 | 0,0000 | ||||
| SPY / SPDR S&P 500 ETF | 0,00 | −100,00 | 0,00 | 0,0000 | |||||
| FI / Fiserv, Inc. | 0,00 | −100,00 | 0,00 | 0,0000 | |||||
| XOM / Exxon Mobil Corporation | 0,00 | −100,00 | 0,00 | 0,0000 | |||||
| LUV / Southwest Airlines Co. | 0,00 | −100,00 | 0,00 | 0,0000 | |||||
| SH / ProShares Trust - ProShares Short S&P500 | 0,00 | −100,00 | 0,00 | 0,0000 |