Grunnleggende statistikk
| Institusjonelle eiere | 227 total, 227 long only, 0 short only, 0 long/short - change of −6,17% MRQ |
| Gjennomsnittlig porteføljeallokering | 0.7172 % - change of 14,00% MRQ |
| Institusjonelle aksjer (Long) | 37 670 989 (ex 13D/G) - change of 0,03MM shares 0,08% MRQ |
| Institusjonell verdi (Long) | $ 2 013 082 USD ($1000) |
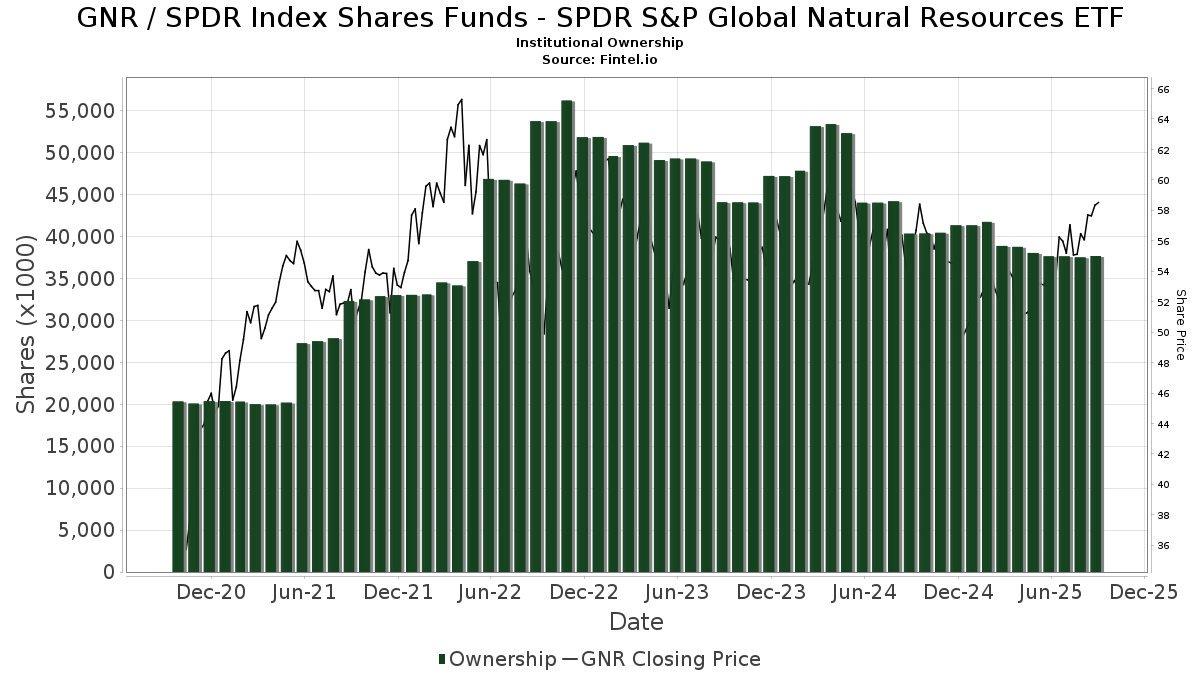
Institusjonelt eierskap og aksjonærer
SPDR Index Shares Funds - SPDR S&P Global Natural Resources ETF (US:GNR) har 227 institusjonelle eiere og aksjonærer som har sendt inn 13D/G- eller 13F-skjemaer til Securities Exchange Commission (SEC). Disse institusjonene eier til sammen 37,670,989 aksjer. De største aksjonærene inkluderer Northern Trust Corp, Pure Financial Advisors, Inc., RLY - SPDR SSGA Multi-Asset Real Return ETF, Oxford Financial Group Ltd, Hackensack Meridian Health, Inc., Johns Hopkins University, Morgan Stanley, BlackRock, Inc., Bank Of America Corp /de/, and Nepc Llc .
SPDR Index Shares Funds - SPDR S&P Global Natural Resources ETF (ARCA:GNR) institusjonell eierstruktur viser nåværende posisjoner i selskapet fordelt på institusjoner og fond, samt de siste endringene i posisjonsstørrelse. De største aksjonærene kan være individuelle investorer, verdipapirfond, hedgefond eller institusjoner. Schedule 13D indikerer at investoren eier (eller har eid) mer enn 5 % av selskapet og har til hensikt (eller hadde til hensikt) å aktivt forfølge en endring i forretningsstrategien. Schedule 13G indikerer en passiv investering på over 5 %.
The share price as of September 10, 2025 is 58,34 / share. Previously, on September 11, 2024, the share price was 53,43 / share. This represents an increase of 9,19% over that period.
Fondssentiment-score
Fondssentiment Score (også kjent som akkumulering av eierskap poengsum) viser hvilke aksjer som er mest kjøpt av fond. Den er resultatet av en sofistikert, kvantitativ flerfaktormodell som identifiserer selskaper med de høyeste nivåene av institusjonell akkumulering. Beregningsmodellen for poeng bruker en kombinasjon av den totale økningen i antall offentliggjorte eiere, endringer i porteføljeallokeringen til disse eierne og andre beregninger. Tallet går fra 0 til 100, der høyere tall indikerer en høyere grad av akkumulering i forhold til sammenlignbare selskaper, der 50 er gjennomsnittet.
Oppdateringsfrekvens: Daglig
Sjekk ut Ownership Explorer, som inneholder en liste over de høyest rangerte selskapene.
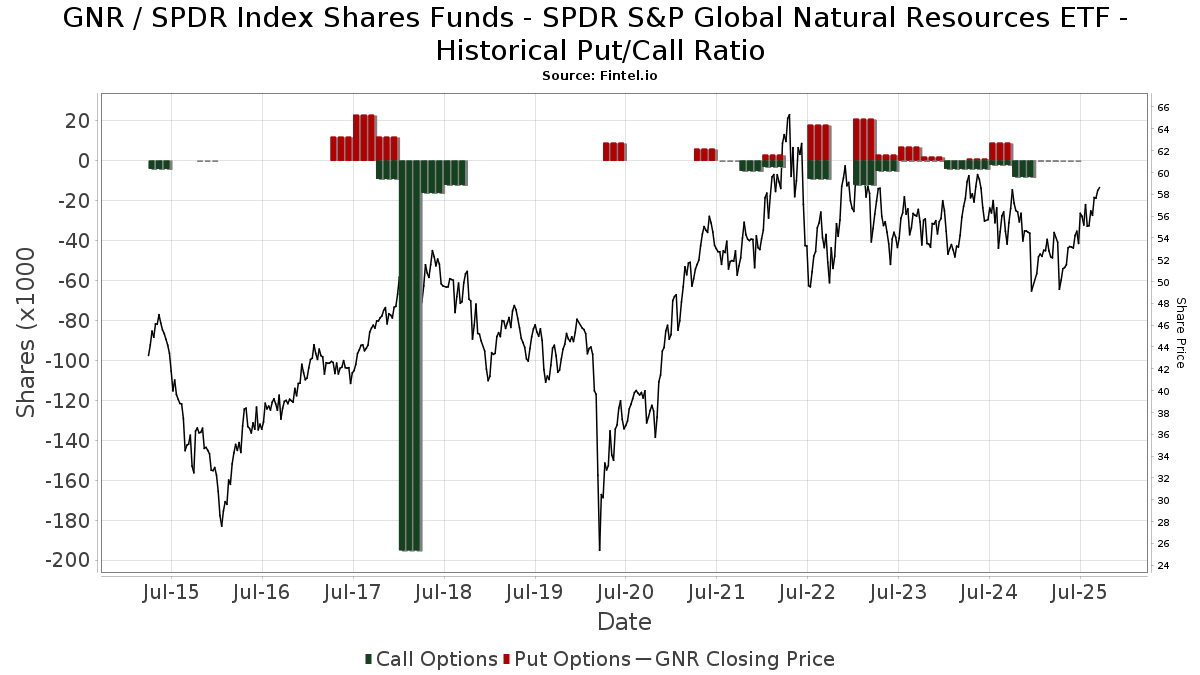
Institusjonell Put/Call-forhold
I tillegg til å rapportere standard aksje- og gjeldsemisjoner må institusjoner med mer enn 100 millioner kroner i forvaltningskapital også oppgi beholdningen av put- og callopsjoner. Siden put-opsjoner generelt indikerer et negativt sentiment, og call-opsjoner indikerer et positivt sentiment, kan vi få et inntrykk av det generelle institusjonelle sentimentet ved å plotte forholdet mellom put- og call-opsjoner. Diagrammet til høyre viser det historiske forholdet mellom put- og call-opsjoner for dette instrumentet.
Ved å bruke Put/Call-forholdet som en indikator på investorsentimentet kan man overvinne en av de viktigste svakhetene ved å bruke totalt institusjonelt eierskap, nemlig at en betydelig andel av forvaltningskapitalen investeres passivt for å følge indekser. Passivt forvaltede fond kjøper vanligvis ikke opsjoner, slik at indikatoren for put/call-forhold i større grad gjenspeiler stemningen i aktivt forvaltede fond.
13F- og NPORT-arkiveringer
Detaljer om 13F-arkiveringer er gratis. Detaljer om NP-arkiveringer krever et premium-medlemskap. Grønne rader indikerer nye posisjoner. Røde rader indikerer lukkede posisjoner. Klikk på lenke ikonet for å se hele transaksjonshistorikken.
Oppgrader
for å låse opp premiedata og eksportere til Excel. ![]() .
.
| Fildato | Kilde | Investor | Type | Gjennomsnittlig pris (estimert) |
Aksjer | Δ Aksjer (%) |
Rapportert verdi ($1000) | Verdi (%) | Portallokering (%) | |
|---|---|---|---|---|---|---|---|---|---|---|
| 2025-07-28 | 13F | BRYN MAWR TRUST Co | 10 800 | 0,00 | 586 | 1,74 | ||||
| 2025-07-02 | 13F | Howard Financial Services, Ltd. | 0 | −100,00 | 0 | |||||
| 2025-07-10 | 13F | Sterling Investment Advisors Llc /adv | 123 462 | 5,13 | 6 697 | 7,10 | ||||
| 2025-08-14 | 13F | Boston Private Wealth Llc | 6 372 | −5,74 | 346 | −3,90 | ||||
| 2025-07-08 | 13F | Boltwood Capital Management | 46 200 | −9,17 | 2 506 | −7,50 | ||||
| 2025-05-13 | 13F | Tocqueville Asset Management L.p. | 0 | −100,00 | 0 | −100,00 | ||||
| 2025-07-28 | 13F | Harbour Investments, Inc. | 206 | 1,48 | 11 | 10,00 | ||||
| 2025-07-31 | 13F/A | Sendero Wealth Management, LLC | 362 282 | −16,20 | 19 650 | −14,64 | ||||
| 2025-07-24 | 13F | IFP Advisors, Inc | 0 | −100,00 | 0 | |||||
| 2025-08-05 | 13F | Navalign, LLC | 0 | −100,00 | 0 | |||||
| 2025-07-24 | 13F | Comprehensive Money Management Services LLC | 11 644 | 7,79 | 632 | 9,74 | ||||
| 2025-08-13 | 13F | Brooklands Fund Management Ltd | Call | 1 | 0 | |||||
| 2025-08-06 | 13F | TKG Advisors, LLC | 5 493 | 0,00 | 298 | 1,71 | ||||
| 2025-08-13 | 13F | Fort Sheridan Advisors Llc | 4 001 | −25,76 | 217 | −24,13 | ||||
| 2025-07-17 | 13F | Sage Rhino Capital Llc | 28 054 | −1,37 | 1 522 | 0,46 | ||||
| 2025-08-14 | 13F | Treasure Coast Financial Planning | 105 613 | 8,30 | 5 728 | 10,32 | ||||
| 2025-08-06 | 13F | Prospera Financial Services Inc | 6 388 | 3,48 | 347 | 5,49 | ||||
| 2025-08-18 | 13F/A | National Bank Of Canada /fi/ | 8 809 | 0,17 | 477 | 1,92 | ||||
| 2025-07-22 | 13F | White & Co Financial Planning Inc | 57 937 | 2,13 | 3 142 | 3,77 | ||||
| 2025-07-16 | 13F | Signaturefd, Llc | 100 | −65,28 | 5 | −66,67 | ||||
| 2025-08-11 | 13F | Empowered Funds, LLC | 0 | −100,00 | 0 | |||||
| 2025-08-14 | 13F | Integrated Wealth Concepts LLC | 5 932 | −3,18 | 322 | −1,53 | ||||
| 2025-08-08 | 13F | Firestone Capital Management | 17 202 | −9,99 | 933 | −8,26 | ||||
| 2025-08-14 | 13F | Stifel Financial Corp | 52 517 | 2,95 | 2 848 | 4,86 | ||||
| 2025-07-25 | 13F | Sequoia Financial Advisors, LLC | 10 839 | −0,10 | 588 | 1,73 | ||||
| 2025-07-21 | 13F | Cromwell Holdings LLC | 0 | −100,00 | 0 | |||||
| 2025-08-12 | 13F | Steward Partners Investment Advisory, Llc | 1 807 | −7,33 | 98 | −4,85 | ||||
| 2025-05-14 | 13F | Power Wealth Management Llc | 0 | −100,00 | 0 | |||||
| 2025-07-16 | 13F | One + One Wealth Management, Llc | 33 213 | −1,68 | 1 801 | 0,17 | ||||
| 2025-08-13 | 13F | 1832 Asset Management L.P. | 423 429 | −50,63 | 22 967 | −49,72 | ||||
| 2025-07-31 | 13F | Sage Mountain Advisors LLC | 13 394 | 0,00 | 726 | 1,82 | ||||
| 2025-07-11 | 13F | Essex Savings Bank | 0 | −100,00 | 0 | |||||
| 2025-08-15 | 13F | Morgan Stanley | 1 157 427 | −19,12 | 62 779 | −17,62 | ||||
| 2025-07-15 | 13F | Patriot Investment Management Inc. | 4 470 | 0,00 | 242 | 1,68 | ||||
| 2025-07-25 | 13F | Cwm, Llc | 360 | 0,00 | 0 | |||||
| 2025-08-05 | 13F | Elyxium Wealth, LLC | 0 | −100,00 | 0 | |||||
| 2025-08-14 | 13F | D. E. Shaw & Co., Inc. | 4 986 | −1,97 | 270 | 0,00 | ||||
| 2025-08-01 | 13F | Brookwood Investment Group LLC | 19 954 | 18,79 | 1 082 | 21,03 | ||||
| 2025-07-31 | 13F | Jackson Hole Capital Partners, LLC | 2 762 | 0,00 | 150 | 1,36 | ||||
| 2025-08-06 | 13F | AE Wealth Management LLC | 838 | 0,00 | 45 | 2,27 | ||||
| 2025-08-08 | 13F | Hudock, Inc. | 4 403 | 0,27 | 239 | 2,15 | ||||
| 2025-08-13 | 13F | M&t Bank Corp | 121 431 | 0,00 | 6 586 | 1,86 | ||||
| 2025-07-09 | 13F | Fermata Advisors, LLC | 10 190 | −17,95 | 553 | −16,49 | ||||
| 2025-05-13 | 13F | Ci Investments Inc. | 0 | −100,00 | 0 | |||||
| 2025-08-07 | 13F | Brio Consultants, LLC | 28 799 | 91,67 | 1 562 | 95,25 | ||||
| 2025-08-13 | 13F | Meketa Investment Group Inc /adv | 0 | −100,00 | 0 | |||||
| 2025-08-12 | 13F | Rock Creek Group, LP | 6 264 | 427 | ||||||
| 2025-04-23 | 13F | ASB Consultores, LLC | 0 | −100,00 | 0 | |||||
| 2025-08-13 | 13F | Rsm Us Wealth Management Llc | 23 090 | −1,61 | 1 252 | 0,24 | ||||
| 2025-07-17 | 13F | Worth Financial Advisory Group, LLC | 4 818 | −11,64 | 261 | −10,00 | ||||
| 2025-08-12 | 13F | Jpmorgan Chase & Co | 563 243 | −2,63 | 30 550 | −0,82 | ||||
| 2025-08-14 | 13F | Snowden Capital Advisors LLC | 7 671 | −21,64 | 416 | −20,15 | ||||
| 2025-07-15 | 13F | GSB Wealth Management, LLC | 125 | 9,65 | 7 | 0,00 | ||||
| 2025-08-12 | 13F | Bokf, Na | 0 | −100,00 | 0 | |||||
| 2025-08-14 | 13F | Sunbelt Securities, Inc. | 0 | −100,00 | 0 | |||||
| 2025-08-06 | 13F | Atlantic Union Bankshares Corp | 402 | 22 | ||||||
| 2025-08-08 | 13F | Gts Securities Llc | 0 | −100,00 | 0 | |||||
| 2025-07-09 | 13F | Reyes Financial Architecture, Inc. | 342 | 19 | ||||||
| 2025-07-01 | 13F | Harbor Investment Advisory, Llc | 40 | −86,71 | 2 | −87,50 | ||||
| 2025-07-16 | 13F | Perigon Wealth Management, LLC | 21 103 | 1,03 | 1 145 | 2,88 | ||||
| 2025-07-16 | 13F/A | CX Institutional | 41 | −90,40 | 0 | |||||
| 2025-08-01 | 13F | Bessemer Group Inc | 43 291 | −51,22 | 2 | −50,00 | ||||
| 2025-08-05 | 13F | Mason Investment Advisory Services, Inc. | 11 774 | −10,35 | 639 | −8,73 | ||||
| 2025-08-07 | 13F | Allworth Financial LP | 75 | 4 | ||||||
| 2025-08-14 | 13F | Greenline Partners, LLC | 0 | −100,00 | 0 | |||||
| 2025-07-31 | 13F | FSM Wealth Advisors, LLC | 5 131 | −0,98 | 284 | 3,27 | ||||
| 2025-07-14 | 13F | AdvisorNet Financial, Inc | 1 244 | 16,15 | 67 | 17,54 | ||||
| 2025-08-14 | 13F | Aqr Capital Management Llc | 26 359 | 0,86 | 1 430 | 2,73 | ||||
| 2025-08-14 | 13F | Ameriprise Financial Inc | 116 098 | 226,37 | 6 298 | 232,47 | ||||
| 2025-08-14 | 13F | Citadel Advisors Llc | Call | 0 | −100,00 | 0 | ||||
| 2025-07-18 | 13F | Pure Financial Advisors, Inc. | 1 952 602 | 2,80 | 105 909 | 4,72 | ||||
| 2025-08-14 | 13F | Citadel Advisors Llc | Put | 0 | −100,00 | 0 | ||||
| 2025-08-13 | 13F | Baird Financial Group, Inc. | 3 817 | −56,08 | 207 | −55,19 | ||||
| 2025-08-14 | 13F | GWM Advisors LLC | 25 019 | −11,20 | 1 357 | −9,53 | ||||
| 2025-07-22 | 13F | SOL Capital Management CO | 41 020 | −1,61 | 2 | 0,00 | ||||
| 2025-07-23 | 13F | Nbt Bank N A /ny | 750 | 650,00 | 41 | 700,00 | ||||
| 2025-04-11 | 13F | City State Bank | 0 | −100,00 | 0 | |||||
| 2025-08-13 | 13F | Kayne Anderson Rudnick Investment Management Llc | 187 | 10 | ||||||
| 2025-08-14 | 13F | Mercer Global Advisors Inc /adv | 83 396 | −31,88 | 4 524 | −30,61 | ||||
| 2025-09-04 | 13F/A | Advisor Group Holdings, Inc. | 9 970 | −27,40 | 541 | −25,99 | ||||
| 2025-07-16 | 13F | Stephenson National Bank & Trust | 36 576 | −15,17 | 1 984 | −13,63 | ||||
| 2025-08-12 | 13F | Wood Tarver Financial Group, LLC | 412 | 0,00 | 0 | −100,00 | ||||
| 2025-07-25 | 13F | Pathway Financial Advisors LLC | 8 431 | −34,32 | 457 | −33,09 | ||||
| 2025-08-13 | 13F | Renaissance Technologies Llc | 4 400 | −87,85 | 239 | −87,65 | ||||
| 2025-07-22 | 13F | Global Strategic Investment Solutions, LLC | 27 389 | −7,22 | 1 486 | −5,47 | ||||
| 2025-08-13 | 13F | Townsquare Capital Llc | 0 | −100,00 | 0 | |||||
| 2025-08-11 | 13F | Aptus Capital Advisors, LLC | 355 | 1,43 | 19 | 5,56 | ||||
| 2025-08-12 | 13F | Allen Capital Group, LLC | 23 024 | −2,48 | 1 249 | −0,72 | ||||
| 2025-08-06 | 13F | Stone House Investment Management, LLC | 1 608 | −1,05 | 87 | 1,16 | ||||
| 2025-08-14 | 13F | UBS Group AG | 427 262 | 5,21 | 23 175 | 7,17 | ||||
| 2025-07-15 | 13F | Main Street Group, LTD | 2 | 0,00 | 0 | |||||
| 2025-08-14 | 13F | Operose Advisors LLC | 189 | 0,00 | 10 | 0,00 | ||||
| 2025-07-11 | 13F | Farther Finance Advisors, LLC | 3 724 | 202 | ||||||
| 2025-08-14 | 13F | CoreCap Advisors, LLC | 0 | −100,00 | 0 | |||||
| 2025-08-13 | 13F | Botty Investors LLC | 6 900 | 0,00 | 374 | 1,91 | ||||
| 2025-08-14 | 13F | Trace Wealth Advisors, LLC | 0 | −100,00 | 0 | |||||
| 2025-04-23 | 13F | Mascagni Wealth Management, Inc. | 0 | −100,00 | 0 | −100,00 | ||||
| 2025-07-08 | 13F | Parallel Advisors, LLC | 100 | 0,00 | 5 | 0,00 | ||||
| 2025-08-12 | 13F | Proequities, Inc. | 0 | 0 | ||||||
| 2025-08-13 | 13F | Flow Traders U.s. Llc | 86 380 | 5 | ||||||
| 2025-07-31 | 13F | Longview Financial Advisors, Inc. | 20 339 | −28,57 | 1 103 | −27,24 | ||||
| 2025-06-30 | 13F/A | Deutsche Bank Ag\ | 0 | −100,00 | 0 | |||||
| 2025-08-06 | 13F | Commonwealth Equity Services, Llc | 45 157 | −15,18 | 2 | 0,00 | ||||
| 2025-08-14 | 13F/A | Rockefeller Capital Management L.P. | 75 439 | 132,75 | 4 092 | 137,16 | ||||
| 2025-08-14 | 13F | Hackensack Meridian Health, Inc. | 1 606 000 | 0,00 | 87 109 | 1,86 | ||||
| 2025-08-14 | 13F | Mariner, LLC | 76 003 | 0,45 | 4 122 | 2,31 | ||||
| 2025-08-05 | 13F | Hills Bank & Trust Co | 40 485 | 2 196 | ||||||
| 2025-08-08 | 13F | Meridian Wealth Management, LLC | 4 100 | 222 | ||||||
| 2025-07-23 | 13F | Morton Capital Management LLC/CA | 10 861 | 0,53 | 589 | 2,43 | ||||
| 2025-04-22 | 13F | Duncker Streett & Co Inc | 0 | −100,00 | 0 | |||||
| 2025-08-12 | 13F | Minot DeBlois Advisors LLC | 750 | 0,00 | 41 | 2,56 | ||||
| 2025-08-12 | 13F | Kimelman & Baird, LLC | 14 500 | 0,00 | 786 | 1,81 | ||||
| 2025-08-13 | 13F | Jones Financial Companies Lllp | 3 740 | 11,21 | 203 | 12,85 | ||||
| 2025-07-31 | 13F | WFA Asset Management Corp | 493 | 1,65 | 28 | −3,57 | ||||
| 2025-04-29 | 13F | Richard Bernstein Advisors LLC | 0 | −100,00 | 0 | |||||
| 2025-07-24 | 13F | Blair William & Co/il | 4 641 | −8,33 | 252 | −6,69 | ||||
| 2025-08-01 | 13F | Envestnet Asset Management Inc | 182 197 | 0,45 | 9 882 | 2,32 | ||||
| 2025-08-12 | 13F | Charles Schwab Investment Management Inc | 347 871 | −1,91 | 18 869 | −0,09 | ||||
| 2025-04-10 | 13F | Park Edge Advisors, LLC | 0 | −100,00 | 0 | |||||
| 2025-08-13 | 13F | Millstone Evans Group, LLC | 130 | 0,00 | 7 | 16,67 | ||||
| 2025-08-14 | 13F | Visionary Wealth Advisors | 13 095 | −9,05 | 710 | −7,31 | ||||
| 2025-05-01 | 13F | Schechter Investment Advisors, LLC | 60 133 | −3,35 | 3 202 | 3,46 | ||||
| 2025-08-05 | 13F | Bank Of Montreal /can/ | 159 309 | −6,23 | 8 641 | −4,49 | ||||
| 2025-04-15 | 13F | Transform Wealth, LLC | 0 | −100,00 | 0 | |||||
| 2025-07-15 | 13F | Gunma Bank,Ltd. | 70 000 | 0,00 | 4 | 0,00 | ||||
| 2025-07-17 | 13F | Sound Income Strategies, LLC | 19 | 0,00 | 1 | 0,00 | ||||
| 2025-08-11 | 13F | Cornerstone Planning Group LLC | 526 | 1,54 | 29 | 7,69 | ||||
| 2025-08-14 | 13F | Royal Bank Of Canada | 120 316 | −20,59 | 6 525 | −19,12 | ||||
| 2025-04-17 | 13F | Monticello Wealth Management, Llc | 0 | −100,00 | 0 | |||||
| 2025-08-04 | 13F | Spire Wealth Management | 106 | 0,00 | 6 | 0,00 | ||||
| 2025-05-12 | 13F | Sandy Spring Bank | 402 | 0,00 | 21 | 5,00 | ||||
| 2025-08-13 | 13F | Northwestern Mutual Wealth Management Co | 6 882 | 33,22 | 373 | 35,64 | ||||
| 2025-07-25 | NP | PRDAX - Diversified Real Asset Fund Class A | 97 447 | 1,78 | 5 174 | 3,31 | ||||
| 2025-08-11 | 13F | NewEdge Wealth, LLC | 9 069 | 0,00 | 503 | 4,15 | ||||
| 2025-08-14 | 13F | Raymond James Financial Inc | 468 126 | 1,83 | 25 391 | 3,72 | ||||
| 2025-04-29 | 13F | U.S. Capital Wealth Advisors, LLC | 0 | −100,00 | 0 | |||||
| 2025-07-30 | 13F | Whittier Trust Co Of Nevada Inc | 216 | 0,00 | 12 | 0,00 | ||||
| 2025-08-14 | 13F | Citadel Advisors Llc | 5 517 | 14,96 | 299 | 17,25 | ||||
| 2025-07-24 | 13F | Us Bancorp \de\ | 19 017 | 0,00 | 1 031 | 1,88 | ||||
| 2025-08-01 | 13F | Redwood Park Advisors LLC | 10 873 | 5,69 | 590 | 7,68 | ||||
| 2025-08-11 | 13F | Citigroup Inc | 9 685 | 2,22 | 525 | 4,17 | ||||
| 2025-07-22 | 13F | Wealthcare Advisory Partners LLC | 25 038 | 135,16 | 1 358 | 139,93 | ||||
| 2025-08-26 | NP | PDPAX - Virtus Rampart Alternatives Diversifier Fund Class A | 49 400 | 67,74 | 2 679 | 70,85 | ||||
| 2025-08-12 | 13F | Palisades Hudson Asset Management, L.P. | 58 013 | 4,32 | 3 | 50,00 | ||||
| 2025-08-14 | 13F | Alliancebernstein L.p. | 485 649 | −0,68 | 26 342 | 1,16 | ||||
| 2025-08-19 | 13F | Newbridge Financial Services Group, Inc. | 18 | 0,00 | 1 | |||||
| 2025-08-12 | 13F | CIBC Private Wealth Group, LLC | 4 007 | −21,03 | 217 | −6,06 | ||||
| 2025-05-05 | 13F | Nwam Llc | 0 | −100,00 | 0 | |||||
| 2025-08-08 | 13F | Principal Financial Group Inc | 276 997 | 30,72 | 15 024 | 33,16 | ||||
| 2025-07-18 | 13F | Lynx Investment Advisory | 16 833 | −45,42 | 913 | −44,40 | ||||
| 2025-07-30 | 13F | Cullen/frost Bankers, Inc. | 350 | −82,93 | 19 | −83,49 | ||||
| 2025-08-14 | 13F | Fmr Llc | 370 890 | −3,27 | 20 117 | −1,46 | ||||
| 2025-07-25 | 13F | Landmark Wealth Management, LLC | 36 583 | −1,06 | 2 | 0,00 | ||||
| 2025-07-30 | 13F | Clune & Associates, Ltd. | 19 261 | −1,67 | 1 045 | 0,10 | ||||
| 2025-08-07 | 13F | Commerce Bank | 4 370 | 0,00 | 237 | 2,16 | ||||
| 2025-07-31 | 13F | Conservest Capital Advisors, Inc. | 45 736 | 14,74 | 2 481 | 16,87 | ||||
| 2025-04-15 | 13F | Signet Financial Management, Llc | 0 | −100,00 | 0 | |||||
| 2025-08-14 | 13F | Nepc Llc | 861 133 | 17,82 | 46 708 | 20,01 | ||||
| 2025-08-14 | 13F | Mml Investors Services, Llc | 11 557 | −2,23 | 1 | |||||
| 2025-07-22 | 13F | Gsa Capital Partners Llp | 0 | −100,00 | 0 | |||||
| 2025-08-29 | NP | GDMA - Gadsden Dynamic Multi-Asset ETF | 0 | −100,00 | 0 | −100,00 | ||||
| 2025-08-13 | 13F | Schroder Investment Management Group | 39 540 | −60,50 | 2 145 | −59,87 | ||||
| 2025-08-12 | 13F | OneAscent Financial Services LLC | 16 052 | −31,09 | 1 | −100,00 | ||||
| 2025-07-23 | 13F | Valmark Advisers, Inc. | 109 402 | 23,43 | 5 934 | 25,73 | ||||
| 2025-08-13 | 13F | Satovsky Asset Management Llc | 138 051 | 2,44 | 7 488 | 4,33 | ||||
| 2025-07-28 | 13F | Mutual Advisors, LLC | 6 300 | −9,10 | 357 | −0,28 | ||||
| 2025-08-12 | 13F | LPL Financial LLC | 160 626 | −20,85 | 8 712 | −19,38 | ||||
| 2025-08-12 | 13F | MAI Capital Management | 428 | 0,00 | 23 | 4,55 | ||||
| 2025-08-14 | 13F/A | Perritt Capital Management Inc | 28 676 | 3,62 | 1 555 | 5,57 | ||||
| 2025-08-05 | 13F | Carolinas Wealth Consulting Llc | 0 | −100,00 | 0 | −100,00 | ||||
| 2025-07-31 | 13F | Money Design Co.,Ltd. | 33 051 | 17,62 | 2 | 0,00 | ||||
| 2025-08-11 | 13F | Regal Investment Advisors LLC | 48 138 | −1,86 | 2 611 | 0,00 | ||||
| 2025-08-12 | 13F | Global Retirement Partners, LLC | 0 | −100,00 | 0 | |||||
| 2025-08-12 | 13F | O'shaughnessy Asset Management, Llc | 331 | −16,83 | 18 | −19,05 | ||||
| 2025-05-09 | 13F | Frazier Financial Advisors, LLC | 0 | −100,00 | 0 | |||||
| 2025-08-04 | 13F | Hantz Financial Services, Inc. | 0 | −100,00 | 0 | |||||
| 2025-08-04 | 13F | AMG National Trust Bank | 428 714 | 11,01 | 23 253 | 13,08 | ||||
| 2025-08-14 | 13F | VPR Management LLC | 77 550 | 0,00 | 4 206 | 1,86 | ||||
| 2025-08-12 | 13F | Hanover Advisors Inc | 5 908 | −15,94 | 320 | −14,44 | ||||
| 2025-07-08 | 13F | Nbc Securities, Inc. | 29 | 0,00 | 0 | |||||
| 2025-04-15 | 13F | Corrigan Financial, Inc. | 13 641 | −10,60 | 726 | −4,35 | ||||
| 2025-05-05 | 13F | Lindbrook Capital, Llc | 0 | −100,00 | 0 | |||||
| 2025-08-04 | 13F | Assetmark, Inc | 214 | 12 | ||||||
| 2025-08-11 | 13F | von Borstel & Associates, Inc. | 0 | −100,00 | 0 | |||||
| 2025-08-04 | 13F | Mesirow Financial Investment Management, Inc. | 3 988 | 0,96 | 216 | 2,86 | ||||
| 2025-07-07 | 13F | Versant Capital Management, Inc | 167 746 | 13,55 | 9 099 | 15,66 | ||||
| 2025-05-15 | 13F | Macquarie Group Ltd | 0 | −100,00 | 0 | |||||
| 2025-07-18 | 13F | Warren Street Wealth Advisors, LLC | 172 627 | 9,52 | 9 363 | 11,56 | ||||
| 2025-08-08 | 13F | Hedeker Wealth, LLC | 12 408 | −0,92 | 673 | 1,05 | ||||
| 2025-07-23 | 13F | Litman Gregory Asset Management LLC | 6 766 | 0,00 | 367 | 1,67 | ||||
| 2025-08-13 | 13F | PACK Private Wealth, LLC | 153 853 | 7,04 | 8 345 | 9,03 | ||||
| 2025-08-14 | 13F | Susquehanna International Group, Llp | 20 131 | −2,05 | 1 092 | −0,27 | ||||
| 2025-08-14 | 13F | Wells Fargo & Company/mn | 268 304 | −2,24 | 14 553 | −0,42 | ||||
| 2025-08-13 | 13F | Nicolet Advisory Services, Llc | 0 | −100,00 | 0 | |||||
| 2025-05-06 | 13F | Venturi Wealth Management, LLC | 0 | −100,00 | 0 | |||||
| 2025-07-29 | 13F | Kanawha Capital Management Llc | 18 360 | 0,00 | 996 | 1,84 | ||||
| 2025-08-11 | 13F | HighTower Advisors, LLC | 4 372 | −38,85 | 237 | −37,63 | ||||
| 2025-08-05 | 13F | Huntington National Bank | 6 | 400,00 | ||||||
| 2025-08-28 | 13F/A | Tolleson Wealth Management, Inc. | 0 | −100,00 | 0 | −100,00 | ||||
| 2025-08-12 | 13F | BlackRock, Inc. | 1 061 645 | 0,00 | 57 584 | 1,86 | ||||
| 2025-08-18 | 13F | Geneos Wealth Management Inc. | 2 151 | −1,92 | 117 | 0,00 | ||||
| 2025-08-14 | 13F | Hurley Capital, LLC | 1 100 | 0,00 | 60 | 1,72 | ||||
| 2025-08-18 | 13F | Hollencrest Capital Management | 53 | 3 | ||||||
| 2025-07-22 | 13F | Cornerstone Partners Capital Management, Llc | 352 374 | 0,00 | 19 113 | 1,86 | ||||
| 2025-08-13 | 13F | Cresset Asset Management, LLC | 5 564 | −3,37 | 302 | −1,63 | ||||
| 2025-05-15 | 13F | Glenmede Trust Co Na | 9 503 | 91,09 | 506 | 104,86 | ||||
| 2025-07-10 | 13F | Wealth Enhancement Advisory Services, Llc | 25 164 | −2,13 | 1 412 | 3,14 | ||||
| 2025-07-24 | 13F | Trust Co Of Toledo Na /oh/ | 13 | 1 | ||||||
| 2025-05-12 | 13F | Virtu Financial LLC | 0 | −100,00 | 0 | |||||
| 2025-08-12 | 13F | Pathstone Holdings, LLC | 24 110 | 0,00 | 1 308 | 1,87 | ||||
| 2025-08-14 | 13F | Cardiff Park Advisors, Llc | 200 | 0,00 | 11 | 0,00 | ||||
| 2025-07-30 | 13F | D.a. Davidson & Co. | 59 202 | 2,53 | 3 211 | 4,46 | ||||
| 2025-08-14 | 13F | Bank Of America Corp /de/ | 966 621 | 41,69 | 52 430 | 44,32 | ||||
| 2025-08-05 | 13F | Simplex Trading, Llc | 120 | 0 | ||||||
| 2025-08-15 | 13F | Captrust Financial Advisors | 160 260 | −3,59 | 8 692 | −1,80 | ||||
| 2025-08-14 | 13F | Gotham Asset Management, LLC | 32 472 | 0,00 | 1 761 | 1,85 | ||||
| 2025-08-14 | 13F | Colony Group, LLC | 23 316 | 8,01 | 1 265 | 10,01 | ||||
| 2025-08-06 | 13F | Savant Capital, LLC | 15 052 | 816 | ||||||
| 2025-07-22 | 13F | Coastal Investment Advisors, Inc. | 0 | −100,00 | 0 | |||||
| 2025-08-08 | 13F | Creative Planning | 20 847 | 28,39 | 1 131 | 30,79 | ||||
| 2025-08-14 | 13F | Cambridge Associates Llc /ma/ /adv | 309 990 | 0,00 | 16 814 | 1,86 | ||||
| 2025-08-08 | 13F | Pnc Financial Services Group, Inc. | 7 303 | 65,26 | 396 | 68,51 | ||||
| 2025-08-14 | 13F | London & Capital Asset Management Ltd | 0 | −100,00 | 0 | |||||
| 2025-07-03 | 13F | Garde Capital, Inc. | 1 754 | 0,00 | 95 | 2,15 | ||||
| 2025-08-11 | 13F | Dorsey & Whitney Trust CO LLC | 7 506 | 6,38 | 407 | 8,53 | ||||
| 2025-07-21 | 13F | J2 Capital Management Inc | 10 330 | 3,10 | 560 | 5,07 | ||||
| 2025-08-13 | 13F | Cerity Partners LLC | 76 815 | 2,38 | 4 166 | 4,28 | ||||
| 2025-08-14 | 13F | Oxford Financial Group Ltd | 1 690 960 | 1 026,46 | 91 718 | 1 047,47 | ||||
| 2025-08-07 | 13F | Evoke Wealth, Llc | 94 974 | 13,53 | 5 151 | 15,65 | ||||
| 2025-08-13 | 13F | IAG Wealth Partners, LLC | 67 381 | −19,32 | 3 655 | −17,83 | ||||
| 2025-08-07 | 13F | 1620 Investment Advisors, Inc. | 0 | −100,00 | 0 | |||||
| 2025-08-08 | 13F | Cetera Investment Advisers | 64 979 | 4,56 | 3 524 | 6,50 | ||||
| 2025-08-12 | 13F | Calton & Associates, Inc. | 3 900 | −4,36 | 212 | −2,76 | ||||
| 2025-04-29 | 13F | Lee Danner & Bass Inc | 0 | −100,00 | 0 | −100,00 | ||||
| 2025-08-05 | 13F | Bank of New York Mellon Corp | 286 493 | −6,03 | 15 539 | −4,28 | ||||
| 2025-08-14 | 13F | Goldman Sachs Group Inc | 4 951 | 0,00 | 269 | 1,90 | ||||
| 2025-08-27 | NP | RLY - SPDR SSGA Multi-Asset Real Return ETF This fund is a listed as child fund of State Street Corp and if that institution has disclosed ownership in this security, then these positions will not be double counted when calculating total shares and total value | 1 936 968 | −5,34 | 105 061 | −3,58 | ||||
| 2025-08-12 | 13F | DiMeo Schneider & Associates, L.L.C. | 88 238 | 1,50 | 4 786 | 3,39 | ||||
| 2025-08-14 | 13F | Manufacturers Life Insurance Company, The | 39 111 | 363,84 | 2 121 | 372,38 | ||||
| 2025-07-23 | 13F | Sachetta, LLC | 203 795 | 19,48 | 11 054 | 21,70 | ||||
| 2025-07-18 | 13F | Fmb Wealth Management | 21 799 | 0,00 | 1 182 | 1,90 | ||||
| 2025-07-08 | 13F/A | Salem Investment Counselors Inc | 35 | 2 | ||||||
| 2025-08-13 | 13F | Crescent Grove Advisors, LLC | 46 808 | 3,60 | 2 539 | 5,53 | ||||
| 2025-08-15 | 13F | CI Private Wealth, LLC | 9 380 | 98,52 | 509 | 102,39 | ||||
| 2025-07-15 | 13F | Mather Group, Llc. | 5 708 | 0,00 | 310 | 1,98 | ||||
| 2025-08-12 | 13F | TCTC Holdings, LLC | 175 | 0,00 | 9 | 0,00 | ||||
| 2025-08-14 | 13F | Old Mission Capital Llc | 0 | −100,00 | 0 | |||||
| 2025-08-13 | 13F | Northern Trust Corp | 13 399 173 | −3,54 | 726 771 | −1,74 | ||||
| 2025-07-30 | 13F | Dupree Financial Group, LLC | 9 045 | −1,71 | 491 | 0,00 | ||||
| 2025-07-30 | 13F | Phillips Financial Management, Llc | 69 848 | 19,65 | 3 788 | 21,88 | ||||
| 2025-07-11 | 13F | Grove Bank & Trust | 485 | 0,00 | 26 | 4,00 | ||||
| 2025-06-25 | NP | WMMRX - Wilmington Real Asset Fund Class A Shares | 119 300 | 0,00 | 6 117 | −1,77 | ||||
| 2025-08-13 | 13F | Summit Financial, LLC | 77 595 | 12,97 | 4 209 | 15,07 | ||||
| 2025-07-08 | 13F | Lowe Wealth Advisors, LLC | 270 | 0,00 | 15 | 0,00 | ||||
| 2025-07-14 | 13F | Park Avenue Securities Llc | 3 999 | −0,87 | 0 | |||||
| 2025-07-30 | 13F | Strategic Investment Management, Llc | 0 | −100,00 | 0 | |||||
| 2025-07-03 | 13F | Fiduciary Financial Group, Llc | 117 468 | 15,59 | 6 450 | 32,63 | ||||
| 2025-07-08 | 13F | Chemistry Wealth Management LLC | 33 375 | −0,87 | 1 810 | 1,00 | ||||
| 2025-04-25 | 13F | Tradewinds Capital Management, LLC | 0 | −100,00 | 0 | −100,00 | ||||
| 2025-07-16 | 13F | ORG Partners LLC | 200 | −79,70 | 11 | −80,77 | ||||
| 2025-05-15 | 13F | Hrt Financial Lp | 0 | −100,00 | 0 | |||||
| 2025-07-16 | 13F | St Germain D J Co Inc | 775 | 0,00 | 42 | 2,44 | ||||
| 2025-07-16 | 13F | Brown, Lisle/cummings, Inc. | 67 | 0,00 | 4 | 0,00 | ||||
| 2025-08-12 | 13F | Cadence Wealth Management LLC | 80 554 | 21,65 | 4 369 | 23,91 | ||||
| 2025-07-16 | 13F | Old Port Advisors | 9 958 | −13,40 | 540 | −11,76 | ||||
| 2025-04-28 | 13F | Mainstream Capital Management LLC | 0 | −100,00 | 0 | |||||
| 2025-08-14 | 13F | Comerica Bank | 18 416 | −0,13 | 999 | 1,73 | ||||
| 2025-07-24 | 13F | JNBA Financial Advisors | 4 260 | −1,57 | 231 | 0,43 | ||||
| 2025-08-11 | 13F | Duff & Phelps Investment Management Co | 49 400 | 67,74 | 2 679 | 70,85 | ||||
| 2025-08-13 | 13F | Natixis Advisors, L.p. | 82 269 | −6,55 | 4 | 0,00 | ||||
| 2025-07-25 | 13F | Fifth Third Wealth Advisors LLC | 13 070 | 0,00 | 709 | 1,87 | ||||
| 2025-07-29 | 13F | Private Trust Co Na | 1 815 | 294,57 | 98 | 308,33 | ||||
| 2025-08-14 | 13F | Glenmede Investment Management, LP | 6 473 | 351 | ||||||
| 2025-07-16 | 13F | Prairiewood Capital, LLC | 227 104 | 4,32 | 12 318 | 6,26 | ||||
| 2025-07-31 | 13F | Ingalls & Snyder Llc | 18 440 | −0,67 | 1 | |||||
| 2025-08-13 | 13F | Capital Analysts, Inc. | 2 613 | 0,00 | 0 | |||||
| 2025-07-29 | 13F | Stratos Wealth Partners, LTD. | 8 039 | −12,15 | 436 | −10,47 | ||||
| 2025-08-08 | 13F | WASHINGTON TRUST Co | 0 | −100,00 | 0 | |||||
| 2025-07-29 | 13F | United Bank | 10 668 | −0,67 | 579 | 1,23 | ||||
| 2025-08-14 | 13F | Hirtle Callaghan & Co LLC | 5 086 | 0,00 | 276 | 1,85 | ||||
| 2025-08-15 | 13F | Johns Hopkins University | 1 572 088 | 0,00 | 85 270 | 1,86 | ||||
| 2025-07-28 | 13F | CGC Financial Services, LLC | 5 894 | −6,99 | 320 | −5,34 | ||||
| 2025-07-29 | 13F | Regions Financial Corp | 277 | 0,00 | 0 | |||||
| 2025-07-31 | 13F | Wealthfront Advisers Llc | 33 422 | −22,09 | 1 813 | −20,67 | ||||
| 2025-05-01 | 13F | High Note Wealth, LLC | 0 | −100,00 | 0 |
Other Listings
| MX:GNR |