Grunnleggende statistikk
| Institusjonelle eiere | 181 total, 181 long only, 0 short only, 0 long/short - change of 8,28% MRQ |
| Gjennomsnittlig porteføljeallokering | 0.5295 % - change of 58,86% MRQ |
| Institusjonelle aksjer (Long) | 61 569 954 (ex 13D/G) - change of −2,90MM shares −4,49% MRQ |
| Institusjonell verdi (Long) | $ 1 981 250 USD ($1000) |
Institusjonelt eierskap og aksjonærer
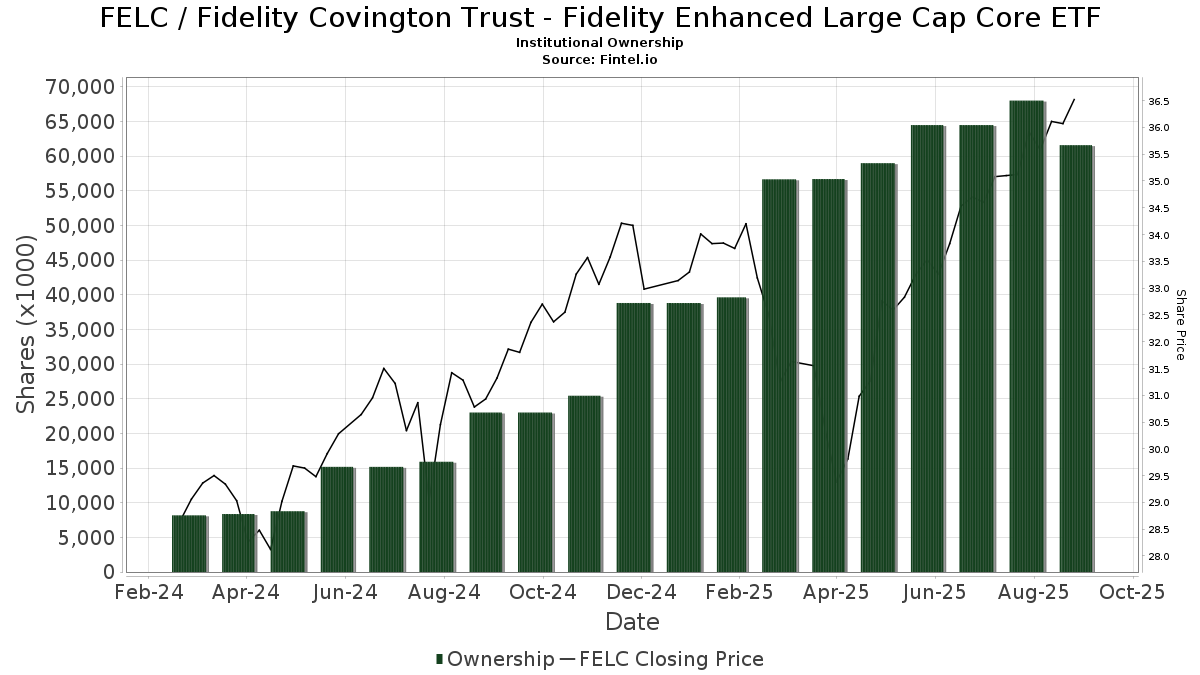
Fidelity Covington Trust - Fidelity Enhanced Large Cap Core ETF (US:FELC) har 181 institusjonelle eiere og aksjonærer som har sendt inn 13D/G- eller 13F-skjemaer til Securities Exchange Commission (SEC). Disse institusjonene eier til sammen 61,569,954 aksjer. De største aksjonærene inkluderer Fmr Llc, Commonwealth Equity Services, Llc, Fragasso Group Inc., Kfg Wealth Management, Llc, LPL Financial LLC, EdgeRock Capital LLC, HighTower Advisors, LLC, Advisor Group Holdings, Inc., Jane Street Group, Llc, and Variable Insurance Products Fund V - FundsManager 60% Portfolio Investor Class .
Fidelity Covington Trust - Fidelity Enhanced Large Cap Core ETF (ARCA:FELC) institusjonell eierstruktur viser nåværende posisjoner i selskapet fordelt på institusjoner og fond, samt de siste endringene i posisjonsstørrelse. De største aksjonærene kan være individuelle investorer, verdipapirfond, hedgefond eller institusjoner. Schedule 13D indikerer at investoren eier (eller har eid) mer enn 5 % av selskapet og har til hensikt (eller hadde til hensikt) å aktivt forfølge en endring i forretningsstrategien. Schedule 13G indikerer en passiv investering på over 5 %.
The share price as of September 9, 2025 is 36,45 / share. Previously, on September 10, 2024, the share price was 30,57 / share. This represents an increase of 19,23% over that period.
Fondssentiment-score
Fondssentiment Score (også kjent som akkumulering av eierskap poengsum) viser hvilke aksjer som er mest kjøpt av fond. Den er resultatet av en sofistikert, kvantitativ flerfaktormodell som identifiserer selskaper med de høyeste nivåene av institusjonell akkumulering. Beregningsmodellen for poeng bruker en kombinasjon av den totale økningen i antall offentliggjorte eiere, endringer i porteføljeallokeringen til disse eierne og andre beregninger. Tallet går fra 0 til 100, der høyere tall indikerer en høyere grad av akkumulering i forhold til sammenlignbare selskaper, der 50 er gjennomsnittet.
Oppdateringsfrekvens: Daglig
Sjekk ut Ownership Explorer, som inneholder en liste over de høyest rangerte selskapene.
Institusjonell Put/Call-forhold
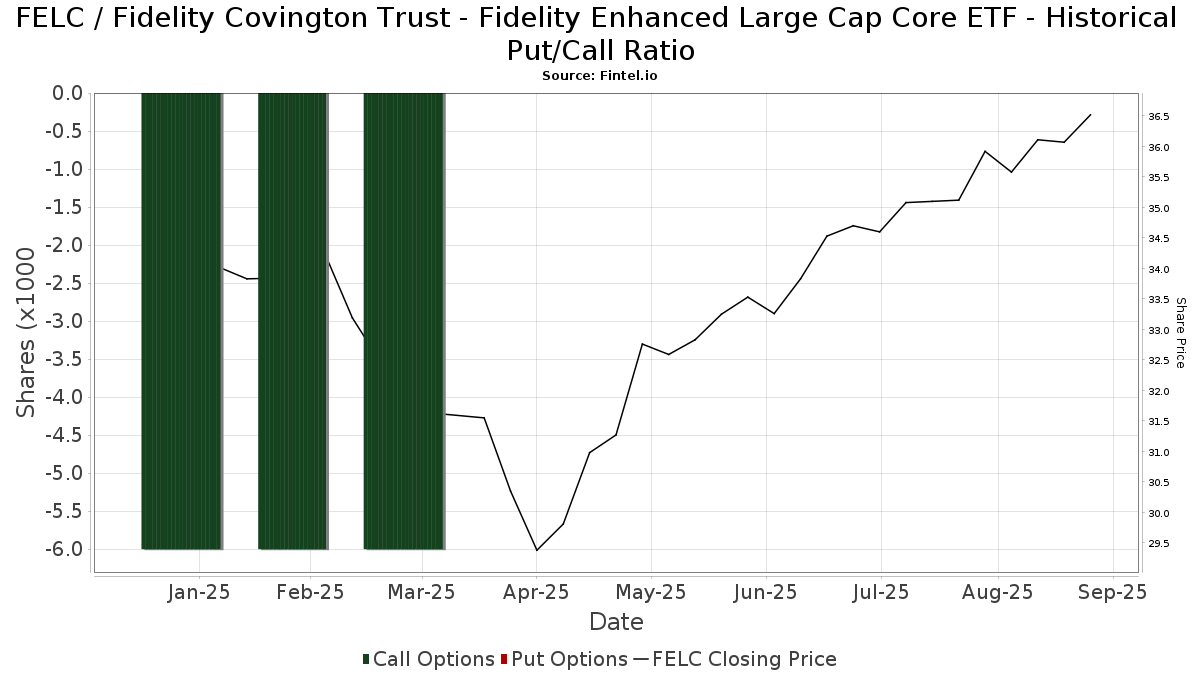
I tillegg til å rapportere standard aksje- og gjeldsemisjoner må institusjoner med mer enn 100 millioner kroner i forvaltningskapital også oppgi beholdningen av put- og callopsjoner. Siden put-opsjoner generelt indikerer et negativt sentiment, og call-opsjoner indikerer et positivt sentiment, kan vi få et inntrykk av det generelle institusjonelle sentimentet ved å plotte forholdet mellom put- og call-opsjoner. Diagrammet til høyre viser det historiske forholdet mellom put- og call-opsjoner for dette instrumentet.
Ved å bruke Put/Call-forholdet som en indikator på investorsentimentet kan man overvinne en av de viktigste svakhetene ved å bruke totalt institusjonelt eierskap, nemlig at en betydelig andel av forvaltningskapitalen investeres passivt for å følge indekser. Passivt forvaltede fond kjøper vanligvis ikke opsjoner, slik at indikatoren for put/call-forhold i større grad gjenspeiler stemningen i aktivt forvaltede fond.
13D/G-arkiveringer
Vi presenterer 13D/G-arkiveringene separat fra 13F-arkiveringene fordi de behandles forskjellig av SEC. 13D/G-arkiveringene kan sendes inn av grupper av investorer (med én leder), mens 13D/G-arkiveringene ikke kan sendes inn. Dette fører til situasjoner der en investor kan sende inn en 13D/G-rapport med én verdi for alle aksjene (som representerer alle aksjene som eies av investorgruppen), men deretter sende inn en 13F-melding med en annen verdi for alle aksjene (som kun representerer deres eget eierskap). Dette betyr at aksjeeierskap i 13D/G-arkiveringene og 13F-arkiveringene ofte ikke er direkte sammenlignbare, og vi presenterer dem derfor separat.
Merk: Fra og med 16. mai 2021 viser vi ikke lenger eiere som ikke har sendt inn en 13D/G i løpet av det siste året. Tidligere viste vi hele historikken for 13D/G-arkiveringer. Generelt må enheter som er pålagt å sende inn 13D/G-arkiveringer, sende inn minst én gang i året før de sender inn en avsluttende rapport. Det hender imidlertid at fond trekker seg ut av posisjoner uten å sende inn en avsluttende innlevering (dvs. at de avvikler), slik at visning av hele historikken av og til fører til forvirring om det nåværende eierskapet. For å unngå forvirring viser vi nå bare "nåværende" eiere, det vil si eiere som har sendt inn informasjon i løpet av det siste året.
Upgrade to unlock premium data.
13F- og NPORT-arkiveringer
Detaljer om 13F-arkiveringer er gratis. Detaljer om NP-arkiveringer krever et premium-medlemskap. Grønne rader indikerer nye posisjoner. Røde rader indikerer lukkede posisjoner. Klikk på lenke ikonet for å se hele transaksjonshistorikken.
Oppgrader
for å låse opp premiedata og eksportere til Excel. ![]() .
.
| Fildato | Kilde | Investor | Type | Gjennomsnittlig pris (estimert) |
Aksjer | Δ Aksjer (%) |
Rapportert verdi ($1000) | Verdi (%) | Portallokering (%) | |
|---|---|---|---|---|---|---|---|---|---|---|
| 2025-07-16 | 13F | EdgeRock Capital LLC | 1 887 103 | 65 146 | ||||||
| 2025-08-08 | 13F | Foundations Investment Advisors, LLC | 14 014 | 91,66 | 483 | 111,84 | ||||
| 2025-08-14 | 13F | GWM Advisors LLC | 1 591 | 8,16 | 55 | 20,00 | ||||
| 2025-08-22 | NP | Variable Insurance Products Fund V - FundsManager 50% Portfolio Investor Class | 242 531 | −85,46 | 8 365 | −83,92 | ||||
| 2025-08-12 | 13F | Steward Partners Investment Advisory, Llc | 8 184 | 192,91 | 282 | 224,14 | ||||
| 2025-08-12 | 13F | Jpmorgan Chase & Co | 598 189 | −16,28 | 20 632 | −7,43 | ||||
| 2025-08-14 | 13F | Geneva Partners, LLC | 18 195 | −2,50 | 628 | 7,73 | ||||
| 2025-08-08 | 13F | Apex Wealth Management, LLC | 0 | −100,00 | 0 | |||||
| 2025-08-07 | 13F | Nwam Llc | 6 499 | −10,38 | 228 | 0,88 | ||||
| 2025-07-25 | 13F | Investment Advisory Group, LLC | 6 628 | 0,00 | 229 | 10,68 | ||||
| 2025-08-08 | 13F | Hudock, Inc. | 11 860 | 0,00 | 409 | 10,84 | ||||
| 2025-08-12 | 13F | Global Retirement Partners, LLC | 2 954 | 277,27 | 102 | 304,00 | ||||
| 2025-08-13 | 13F | Fiduciary Group LLC | 6 329 | 218 | ||||||
| 2025-08-13 | 13F | Rsm Us Wealth Management Llc | 10 014 | 0,23 | 345 | 10,93 | ||||
| 2025-08-04 | 13F | Barnes Dennig Private Wealth Management LLC | 33 | 1 | ||||||
| 2025-08-05 | 13F | AAFCPAs Wealth Management, LLC | 53 770 | −0,27 | 1 855 | 10,29 | ||||
| 2025-07-30 | 13F/A | KPP Advisory Services LLC | 151 857 | 29,50 | 5 238 | 43,20 | ||||
| 2025-08-12 | 13F | Northstar Financial Companies, Inc. | 10 430 | −2,27 | 360 | 8,13 | ||||
| 2025-07-14 | 13F | Sowell Financial Services LLC | 7 981 | 275 | ||||||
| 2025-07-17 | 13F | Beacon Capital Management, LLC | 587 | 20 | ||||||
| 2025-08-11 | 13F | Teachers Insurance & Annuity Association Of America | 0 | −100,00 | 0 | |||||
| 2025-08-14 | 13F | Fmr Llc | 33 392 195 | −6,72 | 1 151 697 | 3,15 | ||||
| 2025-08-14 | 13F | Stifel Financial Corp | 84 387 | −22,60 | 2 911 | −14,41 | ||||
| 2025-08-14 | 13F | Snowden Capital Advisors LLC | 9 355 | 0,00 | 323 | 10,65 | ||||
| 2025-08-01 | 13F | Advisory Alpha, LLC | 0 | −100,00 | 0 | |||||
| 2025-07-21 | 13F | Ameritas Advisory Services, LLC | 1 129 | 39 | ||||||
| 2025-08-15 | 13F | Captrust Financial Advisors | 9 823 | −6,34 | 339 | 3,36 | ||||
| 2025-08-14 | 13F | Susquehanna International Group, Llp | 44 740 | −37,99 | 1 543 | −31,42 | ||||
| 2025-08-01 | 13F | Envestnet Asset Management Inc | 437 534 | 5,19 | 15 091 | 16,32 | ||||
| 2025-08-14 | 13F | UBS Group AG | 1 235 | −80,30 | 43 | −78,46 | ||||
| 2025-08-11 | 13F | Regal Investment Advisors LLC | 11 644 | 2,86 | 402 | 13,60 | ||||
| 2025-08-14 | 13F | Clarity Asset Management, Inc. | 0 | −100,00 | 0 | |||||
| 2025-07-29 | 13F | Madison Wealth Partners, Inc | 11 715 | 1,86 | 404 | 12,85 | ||||
| 2025-08-07 | 13F | Allworth Financial LP | 4 076 | −27,47 | 141 | −18,13 | ||||
| 2025-07-30 | 13F | Financial Perspectives, Inc | 10 832 | 20,24 | 374 | 33,21 | ||||
| 2025-08-08 | 13F | Creative Planning | 17 690 | 2,66 | 610 | 13,59 | ||||
| 2025-08-14 | 13F | Betterment LLC | 46 458 | 342,67 | 2 | |||||
| 2025-09-09 | 13F | NWF Advisory Services Inc. | 5 872 | 203 | ||||||
| 2025-08-22 | NP | Variable Insurance Products Fund V - FundsManager 85% Portfolio Investor Class | 306 607 | −26,25 | 10 575 | −18,45 | ||||
| 2025-08-06 | 13F | Savant Capital, LLC | 0 | −100,00 | 0 | |||||
| 2025-05-15 | 13F/A | Orion Portfolio Solutions, LLC | 11 150 | 348 | ||||||
| 2025-07-14 | 13F | ABLE Financial Group, LLC | 0 | −100,00 | 0 | |||||
| 2025-08-15 | 13F | Kestra Advisory Services, LLC | 549 587 | 111,98 | 18 955 | 134,42 | ||||
| 2025-07-18 | 13F | Rolek Wealth Management LLC | 6 053 | 209 | ||||||
| 2025-09-04 | 13F/A | Advisor Group Holdings, Inc. | 1 386 341 | −10,21 | 47 820 | −0,71 | ||||
| 2025-07-18 | 13F | Dogwood Wealth Management LLC | 31 | 1 | ||||||
| 2025-08-08 | 13F | Pnc Financial Services Group, Inc. | 2 974 | −0,97 | 103 | 9,68 | ||||
| 2025-08-14 | 13F | McIlrath & Eck, LLC | 1 577 | 0,25 | 54 | 10,20 | ||||
| 2025-05-27 | NP | Variable Insurance Products Fund V - FundsManager 20% Portfolio Investor Class | 283 455 | 83,38 | 8 841 | 73,67 | ||||
| 2025-07-15 | 13F | EWG Elevate Inc. | Call | 0 | −100,00 | 0 | ||||
| 2025-08-12 | 13F | Proequities, Inc. | 0 | 0 | ||||||
| 2025-08-04 | 13F | Flagship Harbor Advisors, Llc | 28 873 | 2,00 | 996 | 12,81 | ||||
| 2025-07-24 | 13F | Ronald Blue Trust, Inc. | 898 | 0,00 | 31 | 7,14 | ||||
| 2025-07-25 | 13F | Priebe Wealth Holdings LLC | 218 695 | 7 543 | ||||||
| 2025-08-11 | 13F | Strategic Wealth Partners, Ltd. | 343 | 12 | ||||||
| 2025-08-06 | 13F | Modera Wealth Management, LLC | 16 622 | 0,05 | 573 | 10,62 | ||||
| 2025-08-06 | 13F | Able Wealth Management LLC | 152 601 | 0,89 | 5 263 | 11,58 | ||||
| 2025-08-15 | 13F | Tower Research Capital LLC (TRC) | 1 316 | −96,23 | 45 | −95,87 | ||||
| 2025-08-12 | 13F | Maripau Wealth Management Llc | 34 555 | 28,00 | 1 192 | 41,45 | ||||
| 2025-05-08 | 13F | Eastern Bank | 0 | −100,00 | 0 | |||||
| 2025-07-15 | 13F | Axis Wealth Partners, LLC | 9 888 | 341 | ||||||
| 2025-08-06 | 13F | AE Wealth Management LLC | 3 546 | 54,38 | 122 | 71,83 | ||||
| 2025-08-07 | 13F | Hughes Financial Services, LLC | 0 | −100,00 | 0 | |||||
| 2025-08-07 | 13F | New England Private Wealth Advisors LLC | 32 253 | 3,20 | 1 132 | 16,22 | ||||
| 2025-07-08 | 13F | Arlington Trust Co LLC | 3 840 | 0,00 | 132 | 10,92 | ||||
| 2025-07-09 | 13F | Fragasso Group Inc. | 3 295 512 | 24,38 | 113 662 | 37,54 | ||||
| 2025-07-31 | 13F | Cambridge Investment Research Advisors, Inc. | 156 612 | 2,31 | 5 | 25,00 | ||||
| 2025-07-15 | 13F | Mather Group, Llc. | 35 750 | 0,00 | 1 233 | 10,58 | ||||
| 2025-08-14 | 13F | Mercer Global Advisors Inc /adv | 20 135 | 3,91 | 695 | 16,64 | ||||
| 2025-07-23 | 13F | Element Wealth, LLC | 16 781 | 35,57 | 579 | 49,74 | ||||
| 2025-08-05 | 13F | Prosperity Wealth Management, Inc. | 12 478 | 4,51 | 430 | 15,59 | ||||
| 2025-08-05 | 13F | GPS Wealth Strategies Group, LLC | 100 | 3 | ||||||
| 2025-08-08 | 13F | Cetera Investment Advisers | 57 143 | 25,37 | 1 971 | 38,63 | ||||
| 2025-07-15 | 13F | Retirement Income Solutions, Inc | 5 926 | 204 | ||||||
| 2025-08-12 | 13F | O'shaughnessy Asset Management, Llc | 1 800 | 47,06 | 62 | 63,16 | ||||
| 2025-04-07 | 13F | Tompkins Financial Corp | 0 | −100,00 | 0 | |||||
| 2025-08-14 | 13F | NCM Capital Management, LLC | 13 361 | 0,27 | 461 | 10,84 | ||||
| 2025-08-08 | 13F | Ogorek Anthony Joseph /ny/ /adv | 2 485 | 0,28 | 0 | |||||
| 2025-07-14 | 13F | Rooted Wealth Advisors, Inc. | 94 814 | 9,63 | 3 278 | 34,25 | ||||
| 2025-08-13 | 13F | Summit Wealth Group Llc / Co | 32 206 | 1 111 | ||||||
| 2025-08-05 | 13F | Dunhill Financial, LLC | 859 | 0,00 | 30 | 11,54 | ||||
| 2025-08-14 | 13F | Old Mission Capital Llc | 0 | −100,00 | 0 | |||||
| 2025-08-14 | 13F | Bank Of America Corp /de/ | 29 729 | −52,09 | 1 025 | −47,03 | ||||
| 2025-08-22 | NP | Variable Insurance Products Fund V - FundsManager 60% Portfolio Investor Class | 705 575 | −76,09 | 24 335 | −73,56 | ||||
| 2025-08-14 | 13F | CoreCap Advisors, LLC | 859 | 0,23 | 30 | 11,54 | ||||
| 2025-08-04 | 13F | Creekmur Asset Management LLC | 5 026 | 173 | ||||||
| 2025-08-06 | 13F | Golden State Wealth Management, LLC | 180 | 0,00 | 6 | 20,00 | ||||
| 2025-08-12 | 13F | Wood Tarver Financial Group, LLC | 129 | 0 | ||||||
| 2025-07-24 | 13F | Wealthstar Advisors, Llc | 6 852 | 4,83 | 236 | 16,26 | ||||
| 2025-05-15 | 13F | Two Sigma Securities, Llc | 0 | −100,00 | 0 | −100,00 | ||||
| 2025-07-02 | 13F | HBW Advisory Services LLC | 7 044 | 0,00 | 243 | 10,50 | ||||
| 2025-07-28 | 13F | Harbour Investments, Inc. | 22 783 | −1,53 | 786 | 8,88 | ||||
| 2025-08-14 | 13F | Hrt Financial Lp | 0 | −100,00 | 0 | |||||
| 2025-08-01 | 13F | First Command Advisory Services, Inc. | 67 | 0,00 | 2 | 0,00 | ||||
| 2025-07-24 | 13F | IFP Advisors, Inc | 2 069 | −39,82 | 71 | −33,64 | ||||
| 2025-08-08 | 13F | Kingsview Wealth Management, LLC | 15 283 | 0,74 | 527 | 11,42 | ||||
| 2025-08-14 | 13F | Wells Fargo & Company/mn | 54 656 | 1 557,75 | 1 885 | 1 748,04 | ||||
| 2025-08-14 | 13F | Citadel Advisors Llc | 22 595 | −78,15 | 779 | −75,84 | ||||
| 2025-07-30 | 13F | D.a. Davidson & Co. | 49 693 | −10,77 | 1 714 | −1,38 | ||||
| 2025-08-19 | 13F | Advisory Services Network, LLC | 20 768 | 4,44 | 727 | 17,10 | ||||
| 2025-08-14 | 13F | Raymond James Financial Inc | 427 288 | −9,50 | 14 737 | 0,08 | ||||
| 2025-08-22 | NP | Variable Insurance Products Fund V - FundsManager 70% Portfolio Investor Class | 402 559 | −59,33 | 13 884 | −55,03 | ||||
| 2025-08-07 | 13F | Flagship Wealth Advisors, Llc | 142 783 | 69,00 | 4 925 | 86,87 | ||||
| 2025-08-14 | 13F | EP Wealth Advisors, Inc. | 4 387 | 5,36 | 151 | 17,05 | ||||
| 2025-08-13 | 13F | Jones Financial Companies Lllp | 0 | −100,00 | 0 | |||||
| 2025-08-12 | 13F | CIBC Private Wealth Group, LLC | 2 812 | 56,74 | 97 | 95,92 | ||||
| 2025-07-25 | 13F | Concord Wealth Partners | 253 | 0,00 | 9 | 14,29 | ||||
| 2025-07-24 | 13F | Leo Wealth, LLC | 7 175 | 2,84 | 247 | 13,82 | ||||
| 2025-08-13 | 13F | Cerity Partners LLC | 186 678 | 5,34 | 6 438 | 16,48 | ||||
| 2025-07-07 | 13F | Kings Path Partners LLC | 117 | 4 | ||||||
| 2025-04-02 | 13F | Global Wealth Strategies & Associates | 0 | −100,00 | 0 | |||||
| 2025-07-22 | 13F | Valeo Financial Advisors, LLC | 16 473 | −3,85 | 568 | 6,37 | ||||
| 2025-08-14 | 13F | Jane Street Group, Llc | 1 370 421 | 406,33 | 47 266 | 459,95 | ||||
| 2025-07-18 | 13F | Truist Financial Corp | 57 848 | 17,56 | 1 995 | 30,05 | ||||
| 2025-08-04 | 13F | IFG Advisory, LLC | 28 112 | 35,34 | 970 | 49,77 | ||||
| 2025-08-14 | 13F | Certified Advisory Corp | 32 665 | 0,27 | 1 127 | 10,83 | ||||
| 2025-08-14 | 13F | D. E. Shaw & Co., Inc. | 6 491 | 224 | ||||||
| 2025-05-16 | 13F | Coppell Advisory Solutions LLC | 0 | −100,00 | 0 | |||||
| 2025-05-27 | NP | Variable Insurance Products Fund V - FundsManager 40% Portfolio Service Class | 10 291 | 81,44 | 321 | 72,04 | ||||
| 2025-08-08 | 13F | TD Capital Management LLC | 7 688 | 0,27 | 265 | 10,88 | ||||
| 2025-07-29 | 13F | Salus Financial Advisors, LLC | 37 597 | −18,19 | 1 297 | −9,56 | ||||
| 2025-08-12 | 13F | Howe & Rusling Inc | 51 | 2 | ||||||
| 2025-07-30 | 13F | Cullen/frost Bankers, Inc. | 0 | −100,00 | 0 | |||||
| 2025-08-14 | 13F | Florida Financial Advisors, Llc | 0 | −100,00 | 0 | |||||
| 2025-08-13 | 13F | Renaissance Technologies Llc | 63 100 | 221,94 | 2 176 | 256,14 | ||||
| 2025-08-15 | 13F | Equitable Holdings, Inc. | 164 458 | 162,78 | 5 672 | 190,72 | ||||
| 2025-07-25 | 13F | Cwm, Llc | 230 866 | 2 583,86 | 8 | |||||
| 2025-08-14 | 13F | Mml Investors Services, Llc | 123 215 | −21,09 | 4 | 0,00 | ||||
| 2025-07-30 | 13F | Strategic Blueprint, LLC | 24 871 | 18,24 | 858 | 30,64 | ||||
| 2025-08-11 | 13F | Aptus Capital Advisors, LLC | 1 874 | 0,32 | 65 | 10,34 | ||||
| 2025-08-27 | 13F/A | Brinker Capital Investments, LLC | 6 863 | −38,45 | 237 | −31,99 | ||||
| 2025-08-15 | 13F | Morgan Stanley | 26 555 | 8,63 | 916 | 20,08 | ||||
| 2025-08-14 | 13F | Qube Research & Technologies Ltd | 4 153 | −69,60 | 143 | −66,43 | ||||
| 2025-08-08 | 13F | Avantax Advisory Services, Inc. | 368 414 | 4,71 | 12 707 | 15,78 | ||||
| 2025-04-25 | 13F | TBH Global Asset Management, LLC | 0 | −100,00 | 0 | |||||
| 2025-07-09 | 13F | WealthCare Investment Partners, LLC | 10 039 | 0,00 | 350 | 21,18 | ||||
| 2025-07-11 | 13F | Farther Finance Advisors, LLC | 5 300 | −13,57 | 183 | −5,21 | ||||
| 2025-08-25 | 13F | Silverlake Wealth Management Llc | 75 397 | 10,10 | 2 600 | 21,78 | ||||
| 2025-08-13 | 13F | Mayfair Advisory Group, LLC | 22 636 | 2,13 | 803 | 16,06 | ||||
| 2025-07-10 | 13F | Wealth Enhancement Advisory Services, Llc | 224 140 | 1 206,02 | 7 805 | 1 358,69 | ||||
| 2025-08-08 | 13F | King Wealth | 6 789 | 0,22 | 0 | |||||
| 2025-08-11 | 13F | HighTower Advisors, LLC | 1 459 228 | 19,06 | 50 329 | 31,66 | ||||
| 2025-07-24 | 13F | Us Bancorp \de\ | 10 059 | 61,43 | 347 | 78,35 | ||||
| 2025-08-12 | 13F | MAI Capital Management | 417 | 0,00 | 14 | 7,69 | ||||
| 2025-07-29 | 13F | Harbor Asset Planning, Inc. | 12 862 | 444 | ||||||
| 2025-08-13 | 13F | Capital Analysts, Inc. | 523 | −96,73 | 0 | |||||
| 2025-08-11 | 13F | Ritter Daniher Financial Advisory LLC / DE | 2 847 | 0,00 | 98 | 11,36 | ||||
| 2025-08-12 | 13F | J.w. Cole Advisors, Inc. | 26 122 | 53,85 | 901 | 70,13 | ||||
| 2025-07-16 | 13F | Legend Financial Advisors, Inc. | 99 | 3 | ||||||
| 2025-07-24 | 13F | Williams & Novak, LLC | 153 685 | 3,46 | 5 301 | 13,88 | ||||
| 2025-08-19 | 13F | National Asset Management, Inc. | 35 019 | 30,84 | 1 208 | 37,00 | ||||
| 2025-08-11 | 13F | Private Advisor Group, LLC | 38 274 | 24,13 | 1 320 | 37,36 | ||||
| 2025-07-07 | 13F | Roxbury Financial LLC | 5 313 | 2,06 | 183 | 6,40 | ||||
| 2025-07-15 | 13F | Financial Partners Group, Inc | 186 226 | −11,90 | 6 423 | −2,59 | ||||
| 2025-08-05 | 13F | EPG Wealth Management LLC | 1 226 | 0,33 | 42 | 10,53 | ||||
| 2025-08-07 | 13F | BOK Financial Private Wealth, Inc. | 141 | 5 | ||||||
| 2025-07-14 | 13F | Kfg Wealth Management, Llc | 2 224 321 | 9,19 | 76 717 | 20,75 | ||||
| 2025-08-11 | 13F | Brown Brothers Harriman & Co | 90 | 0,00 | 3 | 50,00 | ||||
| 2025-08-04 | 13F | Assetmark, Inc | 256 | −12,93 | 9 | −11,11 | ||||
| 2025-08-05 | 13F | GHP Investment Advisors, Inc. | 20 | 33,33 | 1 | |||||
| 2025-08-12 | 13F | Change Path, LLC | 6 926 | 239 | ||||||
| 2025-08-11 | 13F | Principal Securities, Inc. | 193 241 | 3 794,42 | 6 665 | 3 988,34 | ||||
| 2025-08-06 | 13F | SJA Financial Advisory, LLC | 31 394 | −6,58 | 1 083 | 3,24 | ||||
| 2025-08-06 | 13F | Commonwealth Equity Services, Llc | 3 537 702 | 1,14 | 122 | 11,93 | ||||
| 2025-08-13 | 13F | Northwestern Mutual Wealth Management Co | 634 502 | −40,79 | 21 884 | −34,52 | ||||
| 2025-07-08 | 13F | Parallel Advisors, LLC | 110 | −97,18 | 4 | −97,52 | ||||
| 2025-07-10 | 13F | Oliver Lagore Vanvalin Investment Group | 0 | 0 | ||||||
| 2025-08-13 | 13F | Twin Peaks Wealth Advisors, LLC | 516 | 18 | ||||||
| 2025-07-30 | 13F | Canvas Wealth Advisors, LLC | 76 580 | 42,35 | 2 699 | 70,71 | ||||
| 2025-08-14 | 13F | Comerica Bank | 4 519 | 0,00 | 156 | 10,71 | ||||
| 2025-08-14 | 13F | Investmark Advisory Group LLC | 54 498 | 1 880 | ||||||
| 2025-08-04 | 13F | Pinnacle Associates Ltd | 8 371 | −1,51 | 289 | 8,68 | ||||
| 2025-08-18 | 13F | Geneos Wealth Management Inc. | 228 | 100,00 | 8 | 133,33 | ||||
| 2025-08-22 | NP | Variable Insurance Products Fund V - Target Volatility Portfolio Service Class | 386 087 | 508,63 | 13 316 | 573,21 | ||||
| 2025-08-14 | 13F | Goldman Sachs Group Inc | 71 838 | −96,93 | 2 478 | −96,61 | ||||
| 2025-08-13 | 13F | Fisher Asset Management, LLC | 0 | −100,00 | 0 | |||||
| 2025-07-16 | 13F | Signaturefd, Llc | 6 350 | 0,00 | 219 | 10,61 | ||||
| 2025-08-01 | 13F | Schmidt P J Investment Management Inc | 6 708 | 231 | ||||||
| 2025-08-14 | 13F | Mariner, LLC | 29 108 | 61,24 | 1 004 | 78,15 | ||||
| 2025-07-25 | 13F | Concurrent Investment Advisors, LLC | 15 209 | 58,79 | 525 | 75,84 | ||||
| 2025-08-05 | 13F | Bank Of Montreal /can/ | 1 221 | 32,57 | 42 | 50,00 | ||||
| 2025-04-25 | 13F | JNBA Financial Advisors | 0 | −100,00 | 0 | |||||
| 2025-05-27 | NP | Variable Insurance Products Fund V - FundsManager 30% Portfolio Service Class | 7 664 | 130,63 | 239 | 119,27 | ||||
| 2025-07-31 | 13F | Briaud Financial Planning, Inc | 0 | −100,00 | 0 | |||||
| 2025-08-13 | 13F | Lido Advisors, LLC | 19 188 | 3,84 | 662 | 14,76 | ||||
| 2025-08-07 | 13F | Rollins Financial Advisors, LLC | 67 578 | −0,75 | 2 331 | 9,75 | ||||
| 2025-08-05 | 13F | Huntington National Bank | 8 | 14,29 | ||||||
| 2025-07-22 | 13F | Mascoma Wealth Management LLC | 370 885 | 7,61 | 12 792 | 19,00 | ||||
| 2025-07-17 | 13F | Sound Income Strategies, LLC | 16 | 1 | ||||||
| 2025-07-15 | 13F | Bfsg, Llc | 1 389 | 48 | ||||||
| 2025-08-14 | 13F | Fortress Financial Group, Llc | 238 410 | 8 223 | ||||||
| 2025-07-21 | 13F | Ameriflex Group, Inc. | 343 | 0,00 | 12 | 10,00 | ||||
| 2025-08-04 | 13F | Spire Wealth Management | 8 665 | 4,44 | 299 | 15,50 | ||||
| 2025-07-10 | 13F | Signal Advisors Wealth, LLC | 34 555 | 26,98 | 1 192 | 40,45 | ||||
| 2025-08-13 | 13F | Russell Investments Group, Ltd. | 1 279 | −42,47 | 44 | −36,23 | ||||
| 2025-07-15 | 13F | Herbst Group, Llc | 7 195 | 248 | ||||||
| 2025-08-14 | 13F | Royal Bank Of Canada | 155 078 | −39,48 | 5 348 | −33,08 | ||||
| 2025-08-14 | 13F | Colony Group, LLC | 68 153 | −0,84 | 2 351 | 9,66 | ||||
| 2025-08-11 | 13F | Lighthouse Financial LLC | 11 050 | −39,91 | 381 | −33,51 | ||||
| 2025-08-14 | 13F | Sunbelt Securities, Inc. | 1 904 | −40,48 | 63 | −37,37 | ||||
| 2025-07-22 | 13F | BridgePort Financial Solutions, LLC | 20 003 | 0,00 | 690 | 10,59 | ||||
| 2025-07-09 | 13F | Lincoln Capital Corp | 156 134 | 1,40 | 5 385 | 12,14 | ||||
| 2025-08-13 | 13F | EverSource Wealth Advisors, LLC | 71 | −72,48 | 2 | −75,00 | ||||
| 2025-07-23 | 13F | Sax Wealth Advisors, Llc | 65 932 | 23,80 | 2 274 | 36,85 | ||||
| 2025-07-31 | 13F | Glass Jacobson Investment Advisors llc | 3 219 | 0,56 | 111 | 5,71 | ||||
| 2025-08-12 | 13F | LPL Financial LLC | 2 141 139 | 75,69 | 73 848 | 94,28 |