Grunnleggende statistikk
| Institusjonelle eiere | 192 total, 192 long only, 0 short only, 0 long/short - change of −1,54% MRQ |
| Gjennomsnittlig porteføljeallokering | 0.6513 % - change of −3,78% MRQ |
| Institusjonelle aksjer (Long) | 32 923 553 (ex 13D/G) - change of −2,19MM shares −6,24% MRQ |
| Institusjonell verdi (Long) | $ 816 341 USD ($1000) |
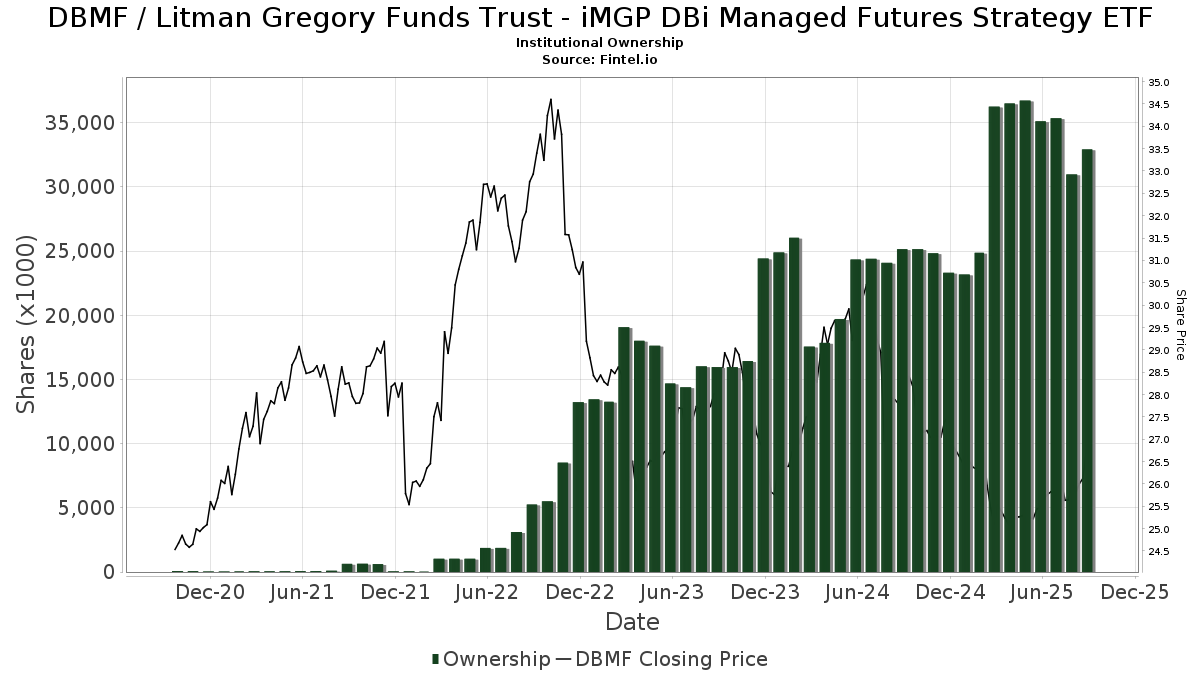
Institusjonelt eierskap og aksjonærer
Litman Gregory Funds Trust - iMGP DBi Managed Futures Strategy ETF (US:DBMF) har 192 institusjonelle eiere og aksjonærer som har sendt inn 13D/G- eller 13F-skjemaer til Securities Exchange Commission (SEC). Disse institusjonene eier til sammen 32,923,553 aksjer. De største aksjonærene inkluderer LPL Financial LLC, Morgan Stanley, Northwestern Mutual Wealth Management Co, Raymond James Financial Inc, Goldstein Advisors, LLC, Litman Gregory Asset Management LLC, Cardinal Point Capital Management, ULC, RAA - SMI 3Fourteen Real Asset Allocation ETF SMI 3Fourteen REAL Asset Allocation ETF, Savant Capital, LLC, and Resources Investment Advisors, LLC. .
Litman Gregory Funds Trust - iMGP DBi Managed Futures Strategy ETF (ARCA:DBMF) institusjonell eierstruktur viser nåværende posisjoner i selskapet fordelt på institusjoner og fond, samt de siste endringene i posisjonsstørrelse. De største aksjonærene kan være individuelle investorer, verdipapirfond, hedgefond eller institusjoner. Schedule 13D indikerer at investoren eier (eller har eid) mer enn 5 % av selskapet og har til hensikt (eller hadde til hensikt) å aktivt forfølge en endring i forretningsstrategien. Schedule 13G indikerer en passiv investering på over 5 %.
The share price as of September 10, 2025 is 26,75 / share. Previously, on September 11, 2024, the share price was 27,84 / share. This represents a decline of 3,92% over that period.
Fondssentiment-score
Fondssentiment Score (også kjent som akkumulering av eierskap poengsum) viser hvilke aksjer som er mest kjøpt av fond. Den er resultatet av en sofistikert, kvantitativ flerfaktormodell som identifiserer selskaper med de høyeste nivåene av institusjonell akkumulering. Beregningsmodellen for poeng bruker en kombinasjon av den totale økningen i antall offentliggjorte eiere, endringer i porteføljeallokeringen til disse eierne og andre beregninger. Tallet går fra 0 til 100, der høyere tall indikerer en høyere grad av akkumulering i forhold til sammenlignbare selskaper, der 50 er gjennomsnittet.
Oppdateringsfrekvens: Daglig
Sjekk ut Ownership Explorer, som inneholder en liste over de høyest rangerte selskapene.
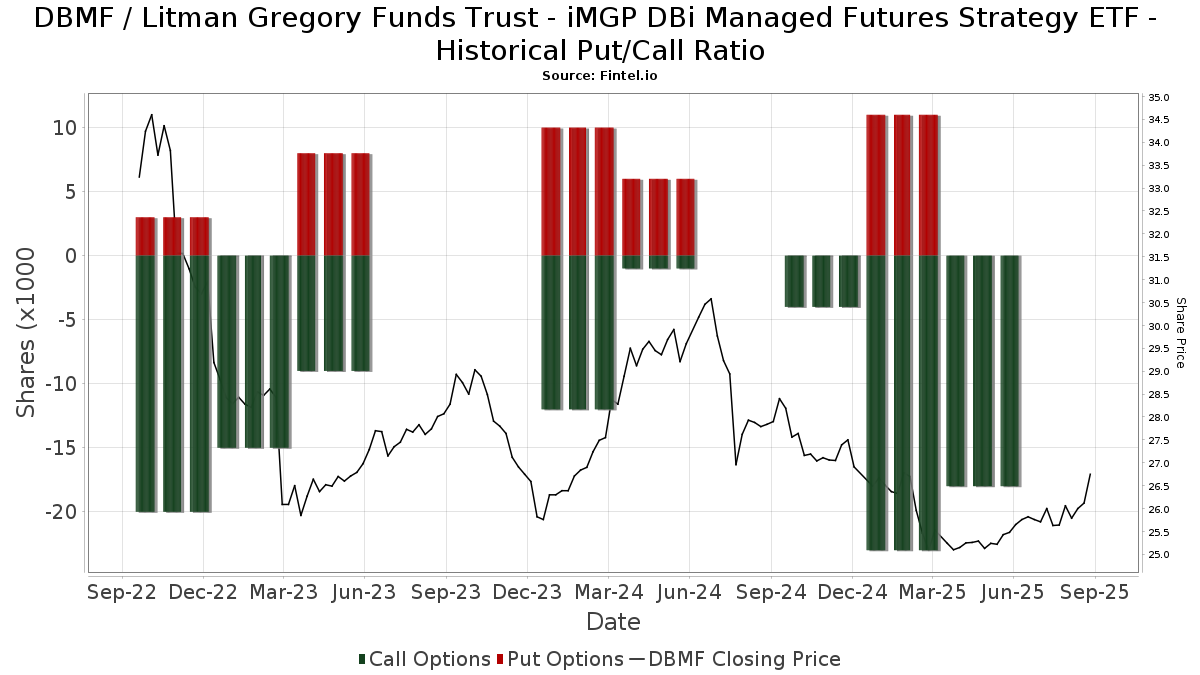
Institusjonell Put/Call-forhold
I tillegg til å rapportere standard aksje- og gjeldsemisjoner må institusjoner med mer enn 100 millioner kroner i forvaltningskapital også oppgi beholdningen av put- og callopsjoner. Siden put-opsjoner generelt indikerer et negativt sentiment, og call-opsjoner indikerer et positivt sentiment, kan vi få et inntrykk av det generelle institusjonelle sentimentet ved å plotte forholdet mellom put- og call-opsjoner. Diagrammet til høyre viser det historiske forholdet mellom put- og call-opsjoner for dette instrumentet.
Ved å bruke Put/Call-forholdet som en indikator på investorsentimentet kan man overvinne en av de viktigste svakhetene ved å bruke totalt institusjonelt eierskap, nemlig at en betydelig andel av forvaltningskapitalen investeres passivt for å følge indekser. Passivt forvaltede fond kjøper vanligvis ikke opsjoner, slik at indikatoren for put/call-forhold i større grad gjenspeiler stemningen i aktivt forvaltede fond.
13F- og NPORT-arkiveringer
Detaljer om 13F-arkiveringer er gratis. Detaljer om NP-arkiveringer krever et premium-medlemskap. Grønne rader indikerer nye posisjoner. Røde rader indikerer lukkede posisjoner. Klikk på lenke ikonet for å se hele transaksjonshistorikken.
Oppgrader
for å låse opp premiedata og eksportere til Excel. ![]() .
.
| Fildato | Kilde | Investor | Type | Gjennomsnittlig pris (estimert) |
Aksjer | Δ Aksjer (%) |
Rapportert verdi ($1000) | Verdi (%) | Portallokering (%) | |
|---|---|---|---|---|---|---|---|---|---|---|
| 2025-08-11 | 13F | Trajan Wealth LLC | 25 272 | −15,53 | 650 | −13,91 | ||||
| 2025-08-04 | 13F | IFG Advisory, LLC | 62 396 | 23,82 | 1 605 | 26,18 | ||||
| 2025-07-16 | 13F | Castleview Partners, Llc | 49 055 | 225,84 | 1 262 | 232,11 | ||||
| 2025-04-21 | 13F | Envestnet Portfolio Solutions, Inc. | 0 | −100,00 | 0 | |||||
| 2025-05-08 | 13F | Altiora Financial Group, LLC | 0 | −100,00 | 0 | |||||
| 2025-05-06 | 13F | Proficio Capital Partners LLC | 0 | −100,00 | 0 | −100,00 | ||||
| 2025-07-30 | 13F | Drive Wealth Management, Llc | 0 | −100,00 | 0 | |||||
| 2025-08-12 | 13F | CIBC Private Wealth Group, LLC | 2 621 | 0,00 | 67 | 4,69 | ||||
| 2025-08-05 | 13F | Elyxium Wealth, LLC | 53 320 | 86,81 | 1 372 | 90,42 | ||||
| 2025-07-10 | 13F | Focus Financial Network, Inc. | 9 440 | 12,15 | 243 | 14,15 | ||||
| 2025-05-16 | 13F/A | Kestra Investment Management, LLC | 0 | −100,00 | 0 | |||||
| 2025-07-29 | 13F | Private Trust Co Na | 14 709 | 3,63 | 378 | 5,59 | ||||
| 2025-08-18 | 13F | N.E.W. Advisory Services LLC | 32 | 0,00 | 1 | |||||
| 2025-08-13 | 13F | Cambria Investment Management, L.P. | 266 136 | 6 848 | ||||||
| 2025-05-15 | 13F/A | Orion Portfolio Solutions, LLC | 18 786 | −8,09 | 475 | −11,24 | ||||
| 2025-07-28 | 13F | Innova Wealth Partners | 78 643 | 158,81 | 2 023 | 163,75 | ||||
| 2025-08-14 | 13F | Wells Fargo & Company/mn | 385 626 | −1,47 | 9 922 | 0,36 | ||||
| 2025-07-09 | 13F | Fermata Advisors, LLC | 131 305 | 16,23 | 3 378 | 18,40 | ||||
| 2025-08-14 | 13F | GWM Advisors LLC | 75 884 | 35,22 | 1 953 | 37,76 | ||||
| 2025-05-12 | 13F | Fmr Llc | 0 | −100,00 | 0 | |||||
| 2025-07-25 | 13F | We Are One Seven, LLC | 12 629 | −1,44 | 325 | 0,31 | ||||
| 2025-08-05 | 13F | ALM First Financial Advisors, LLC | 472 305 | 0,00 | 12 152 | 1,86 | ||||
| 2025-08-14 | 13F | Citadel Advisors Llc | Put | 0 | −100,00 | 0 | ||||
| 2025-08-25 | NP | MAINSTAY VP FUNDS TRUST - MainStay VP IQ Hedge Multi-Strategy Portfolio Initial Class | 104 896 | 9,97 | 2 699 | 12,00 | ||||
| 2025-06-24 | NP | TNMAX - 1290 Multi-Alternative Strategies Fund Class A | 88 890 | 16,71 | 2 245 | 11,41 | ||||
| 2025-08-01 | 13F | Solstein Capital, LLC | 35 | 0,00 | 1 | |||||
| 2025-08-14 | 13F | Citadel Advisors Llc | Call | 18 200 | −21,21 | 468 | −19,73 | |||
| 2025-08-14 | 13F | Visionary Wealth Advisors | 43 441 | −14,51 | 1 118 | −12,94 | ||||
| 2025-04-22 | 13F | FMA Wealth Management, LLC | 0 | −100,00 | 0 | −100,00 | ||||
| 2025-08-15 | 13F | Harvest Fund Management Co., Ltd | 1 053 | 0,00 | 0 | |||||
| 2025-08-08 | 13F | Austin Wealth Management, LLC | 559 759 | 23,93 | 14 335 | 25,31 | ||||
| 2025-07-10 | 13F | Wealth Enhancement Advisory Services, Llc | 34 466 | −58,36 | 888 | −57,51 | ||||
| 2025-07-10 | 13F | Rockland Trust Co | 293 140 | 7 542 | ||||||
| 2025-08-11 | 13F | HighTower Advisors, LLC | 0 | −100,00 | 0 | |||||
| 2025-07-28 | 13F | Axxcess Wealth Management, Llc | 362 965 | 42,58 | 9 339 | 45,24 | ||||
| 2025-08-13 | 13F | Quadrature Capital Ltd | 0 | −100,00 | 0 | |||||
| 2025-08-13 | 13F | Northwestern Mutual Wealth Management Co | 1 896 185 | −3,93 | 48 789 | −2,14 | ||||
| 2025-08-14 | 13F | Pinnacle Family Advisors, LLC | 17 684 | 5,51 | 455 | 7,57 | ||||
| 2025-08-08 | 13F | Meridian Wealth Management, LLC | 14 258 | −31,73 | 367 | −30,55 | ||||
| 2025-07-30 | NP | ENDW - Cambria Endowment Style ETF | 94 873 | 2 393 | ||||||
| 2025-07-09 | 13F | Burt Wealth Advisors | 21 460 | 80,32 | 552 | 84,00 | ||||
| 2025-08-15 | 13F | Equitable Holdings, Inc. | 171 614 | 2,51 | 4 416 | 4,42 | ||||
| 2025-08-14 | 13F | Mariner, LLC | 57 195 | −2,86 | 1 472 | −1,08 | ||||
| 2025-07-14 | 13F | Matrix Trust Co | 40 746 | −2,12 | 1 | 0,00 | ||||
| 2025-05-14 | 13F | Atomi Financial Group, Inc. | 0 | −100,00 | 0 | |||||
| 2025-08-14 | 13F | Principia Wealth Advisory, LLC | 200 450 | −5,96 | 5 157 | −3,61 | ||||
| 2025-08-08 | 13F | Avantax Advisory Services, Inc. | 0 | −100,00 | 0 | |||||
| 2025-07-22 | 13F | Wealthcare Advisory Partners LLC | 11 846 | 305 | ||||||
| 2025-05-16 | 13F | Arete Wealth Advisors, LLC | 0 | −100,00 | 0 | |||||
| 2025-07-15 | 13F | FLP Wealth Management, LLC | 0 | −100,00 | 0 | |||||
| 2025-08-14 | 13F | Stansberry Asset Management, Llc | 116 648 | −2,25 | 3 001 | −0,43 | ||||
| 2025-08-08 | 13F | Cetera Investment Advisers | 199 414 | 25,73 | 5 131 | 28,06 | ||||
| 2025-08-06 | 13F | New Millennium Group LLC | 1 | 0 | ||||||
| 2025-05-01 | 13F | Quest 10 Wealth Builders, Inc. | 569 | −38,82 | 14 | −41,67 | ||||
| 2025-07-25 | 13F | R. W. Roge & Company, Inc. | 71 213 | 2 | ||||||
| 2025-08-13 | 13F | GeoWealth Management, LLC | 12 985 | 0,64 | 334 | 2,77 | ||||
| 2025-08-07 | 13F | Howard Bailey Securities, Llc | 52 383 | −2,10 | 1 348 | −0,30 | ||||
| 2025-08-12 | 13F | SRS Capital Advisors, Inc. | 490 | 0,62 | 13 | 0,00 | ||||
| 2025-08-13 | 13F | West Chester Capital Advisors, Inc | 0 | −100,00 | 0 | |||||
| 2025-06-27 | NP | TRTY - Cambria Trinity ETF | 171 263 | 4 326 | ||||||
| 2025-07-25 | 13F | Northwest Capital Management Inc | 492 | 14,95 | 13 | 20,00 | ||||
| 2025-08-07 | 13F | Vise Technologies, Inc. | 0 | −100,00 | 0 | |||||
| 2025-07-03 | 13F | City Center Advisors, LLC | 35 289 | −2,47 | 908 | −0,77 | ||||
| 2025-07-08 | 13F | Zrc Wealth Management, Llc | 2 290 | 0,00 | 59 | 1,75 | ||||
| 2025-08-26 | NP | EQ ADVISORS TRUST - 1290 VT Multi-Alternative Strategies Portfolio Class IB | 42 840 | 1,73 | 1 102 | 3,67 | ||||
| 2025-08-06 | 13F | Ethos Financial Group, LLC | 13 107 | −37,65 | 335 | −38,76 | ||||
| 2025-08-11 | 13F | Citigroup Inc | 5 433 | −45,36 | 140 | −44,62 | ||||
| 2025-08-11 | 13F | Empowered Funds, LLC | 94 873 | 2 441 | ||||||
| 2025-08-12 | 13F | Global Retirement Partners, LLC | 25 841 | 5 088,96 | 665 | 5 007,69 | ||||
| 2025-05-14 | 13F | Legend Financial Advisors, Inc. | 0 | −100,00 | 0 | |||||
| 2025-07-09 | 13F | Dynamic Advisor Solutions LLC | 0 | −100,00 | 0 | |||||
| 2025-07-15 | 13F | Family Investment Center, Inc. | 26 591 | −92,49 | 684 | −92,35 | ||||
| 2025-08-12 | 13F | LPL Financial LLC | 5 156 988 | 5,09 | 132 689 | 7,04 | ||||
| 2025-08-13 | 13F | Renaissance Technologies Llc | 176 400 | 356,99 | 4 539 | 365,44 | ||||
| 2025-08-14 | 13F | Royal Bank Of Canada | 64 115 | 32,37 | 1 650 | 34,91 | ||||
| 2025-08-15 | 13F | WFA of San Diego, LLC | 136 | −80,26 | 3 | −84,21 | ||||
| 2025-08-11 | 13F | Private Advisor Group, LLC | 400 560 | −6,72 | 10 306 | −4,98 | ||||
| 2025-08-13 | 13F | Virtue Capital Management, LLC | 0 | −100,00 | 0 | |||||
| 2025-08-14 | 13F | Ausdal Financial Partners, Inc. | 25 821 | −1,45 | 664 | 0,45 | ||||
| 2025-07-10 | 13F | Exchange Traded Concepts, Llc | 27 384 | 1,36 | 705 | 3,23 | ||||
| 2025-07-23 | 13F | Valmark Advisers, Inc. | 475 069 | −3,99 | 12 224 | −2,21 | ||||
| 2025-08-14 | 13F | Raymond James Financial Inc | 1 285 564 | 54,95 | 33 078 | 57,83 | ||||
| 2025-07-16 | 13F | ORG Partners LLC | 14 785 | 7,01 | 381 | 8,88 | ||||
| 2025-07-18 | 13F | Midwest Financial Group LLC | 71 699 | 4,46 | 1 845 | 6,41 | ||||
| 2025-08-08 | 13F | Creative Planning | 17 424 | −9,37 | 448 | −7,63 | ||||
| 2025-08-01 | 13F | Bessemer Group Inc | 92 | 0,00 | 0 | |||||
| 2025-07-24 | 13F | IFP Advisors, Inc | 1 655 | −14,87 | 43 | −14,29 | ||||
| 2025-08-05 | 13F | Tsfg, Llc | 108 | 0,93 | 0 | |||||
| 2025-05-02 | 13F | Fortress Wealth Group, LLC | 0 | −100,00 | 0 | −100,00 | ||||
| 2025-08-14 | 13F | UBS Group AG | 6 000 | −26,95 | 154 | −25,60 | ||||
| 2025-07-28 | 13F | Fairman Group, LLC | 75 079 | −12,96 | 1 932 | −9,34 | ||||
| 2025-07-24 | 13F | Live Oak Investment Partners | 115 778 | 0,01 | 2 979 | 1,85 | ||||
| 2025-07-18 | 13F | Astor Investment Management LLC | 177 689 | −3,82 | 4 572 | −2,04 | ||||
| 2025-05-02 | 13F | Parcion Private Wealth LLC | 0 | −100,00 | 0 | |||||
| 2025-08-05 | 13F | Bank of New York Mellon Corp | 9 212 | −3,94 | 237 | −2,07 | ||||
| 2025-08-14 | 13F | Hrt Financial Lp | 26 999 | 1 | ||||||
| 2025-07-29 | 13F | Signature Estate & Investment Advisors Llc | 0 | −100,00 | 0 | |||||
| 2025-08-13 | 13F | Truvestments Capital Llc | 0 | −100,00 | 0 | |||||
| 2025-04-25 | 13F | New Wave Wealth Advisors Llc | 0 | −100,00 | 0 | |||||
| 2025-08-14 | 13F | Citadel Advisors Llc | 97 613 | 334,24 | 2 512 | 342,86 | ||||
| 2025-07-30 | 13F | Strategic Blueprint, LLC | 0 | −100,00 | 0 | |||||
| 2025-08-13 | 13F | Transce3nd, LLC | 1 686 | −0,35 | 43 | 2,38 | ||||
| 2025-08-13 | 13F | Legacy Capital Wealth Partners, LLC | 0 | −100,00 | 0 | |||||
| 2025-08-06 | 13F | Entrewealth, Llc | 90 668 | 8,40 | 2 333 | 10,42 | ||||
| 2025-08-07 | 13F | Nwam Llc | 31 991 | 19,32 | 820 | 20,97 | ||||
| 2025-07-11 | 13F | Deane Retirement Strategies, Inc. | 217 648 | 31 171,26 | 5 600 | 32 835,29 | ||||
| 2025-08-11 | 13F | Principal Securities, Inc. | 2 495 | 596,93 | 64 | 611,11 | ||||
| 2025-07-31 | 13F | West Michigan Advisors, Llc | 14 128 | 57,34 | 366 | 61,50 | ||||
| 2025-08-11 | 13F | Perennial Investment Advisors, LLC | 44 928 | 73,47 | 1 156 | 76,76 | ||||
| 2025-08-18 | 13F/A | National Bank Of Canada /fi/ | 37 316 | 2,39 | 960 | 4,24 | ||||
| 2025-07-17 | 13F | Fifth Third Securities, Inc. | 8 873 | −9,54 | 228 | −7,69 | ||||
| 2025-07-23 | 13F | TriaGen Wealth Management LLC | 88 500 | 11,88 | 2 277 | 13,96 | ||||
| 2025-08-12 | 13F | Change Path, LLC | 13 392 | 9,73 | 345 | 11,69 | ||||
| 2025-07-25 | 13F | Cwm, Llc | 194 372 | −93,01 | 5 | −92,86 | ||||
| 2025-07-18 | 13F | Truist Financial Corp | 0 | −100,00 | 0 | |||||
| 2025-08-13 | 13F | Flow Traders U.s. Llc | 29 355 | 1 | ||||||
| 2025-07-03 | 13F | Garde Capital, Inc. | 100 | 3 | ||||||
| 2025-08-14 | 13F | Css Llc/il | 205 764 | 2,02 | 5 294 | 3,93 | ||||
| 2025-07-31 | 13F | Longview Financial Advisors, Inc. | 134 819 | −8,76 | 3 469 | −7,07 | ||||
| 2025-07-14 | 13F | Legacy Capital Group California, Inc. | 45 872 | 2,62 | 1 180 | 4,52 | ||||
| 2025-09-04 | 13F/A | Advisor Group Holdings, Inc. | 39 125 | 75,22 | 1 007 | 78,37 | ||||
| 2025-06-02 | 13F/A | Modern Wealth Management, LLC | 8 541 | 0,31 | 216 | −3,15 | ||||
| 2025-07-16 | 13F | ORG Wealth Partners, LLC | 27 880 | 7,11 | 718 | 8,97 | ||||
| 2025-08-14 | 13F | Sunbelt Securities, Inc. | 64 | 0,00 | 2 | 0,00 | ||||
| 2025-05-15 | 13F | Advisory Services Network, LLC | 0 | −100,00 | 0 | |||||
| 2025-08-13 | 13F | Manning & Napier Advisors Llc | 888 | 23 | ||||||
| 2025-07-11 | 13F | Mkd Wealth Coaches, Llc | 92 434 | 0,01 | 2 378 | 1,89 | ||||
| 2025-07-14 | 13F | Ai Financial Services Llc | 222 129 | 2,48 | 5 715 | 4,40 | ||||
| 2025-08-14 | 13F | Comerica Bank | 24 850 | 19,27 | 639 | 21,48 | ||||
| 2025-07-15 | 13F | Verum Partners LLC | 8 899 | −49,45 | 229 | −48,65 | ||||
| 2025-08-15 | 13F | Kestra Advisory Services, LLC | 15 860 | −22,94 | 408 | −21,39 | ||||
| 2025-07-14 | 13F | E&G Advisors, LP | 72 782 | −3,45 | 1 873 | −1,68 | ||||
| 2025-07-29 | 13F | Sage Private Wealth Group, Llc | 460 951 | 9,99 | 11 860 | 12,03 | ||||
| 2025-05-08 | 13F | Moors & Cabot, Inc. | 0 | −100,00 | 0 | |||||
| 2025-07-24 | 13F | Ronald Blue Trust, Inc. | 50 | 0,00 | 1 | 0,00 | ||||
| 2025-08-14 | 13F | Mml Investors Services, Llc | 66 849 | 4,70 | 2 | 0,00 | ||||
| 2025-05-12 | 13F | Simplex Trading, Llc | 0 | −100,00 | 0 | |||||
| 2025-08-14 | 13F | Toroso Investments, LLC | 339 077 | 140,72 | 8 724 | 145,19 | ||||
| 2025-07-23 | 13F | Citizens National Bank Trust Department | 0 | −100,00 | 0 | |||||
| 2025-08-05 | 13F | Retirement Financial Solutions, Llc | 12 465 | −12,35 | 321 | −10,86 | ||||
| 2025-08-15 | 13F | Morgan Stanley | 2 680 823 | 13,59 | 68 978 | 15,70 | ||||
| 2025-08-05 | 13F | Optivise Advisory Services LLC | 69 008 | 1,78 | 1 776 | 3,68 | ||||
| 2025-07-28 | 13F | Smart Portfolios, LLC | 31 336 | 25,78 | 806 | 28,14 | ||||
| 2025-04-23 | 13F | PMV Capital Advisers, LLC | 0 | −100,00 | 0 | |||||
| 2025-08-04 | 13F | Savvy Advisors, Inc. | 48 641 | 25,96 | 1 252 | 28,31 | ||||
| 2025-04-22 | 13F | World Equity Group, Inc. | 0 | −100,00 | 0 | |||||
| 2025-08-01 | 13F | Envestnet Asset Management Inc | 633 318 | 6,89 | 16 295 | 8,89 | ||||
| 2025-08-29 | NP | RAA - SMI 3Fourteen Real Asset Allocation ETF SMI 3Fourteen REAL Asset Allocation ETF | 958 053 | 218,89 | 24 651 | 224,81 | ||||
| 2025-07-24 | 13F | Stonebridge Financial Group, LLC | 31 508 | 940,21 | 811 | 965,79 | ||||
| 2025-08-14 | 13F | Federation des caisses Desjardins du Quebec | 1 201 | 0,00 | 31 | 0,00 | ||||
| 2025-07-18 | 13F | Trilogy Capital Inc. | 24 044 | 14,35 | 619 | 16,38 | ||||
| 2025-08-11 | 13F | Advisor Resource Council | 9 053 | −96,69 | 233 | −96,53 | ||||
| 2025-08-14 | 13F | Ancora Advisors, LLC | 0 | −100,00 | 0 | |||||
| 2025-08-14 | 13F | Wiley Bros.-aintree Capital, Llc | 10 527 | 271 | ||||||
| 2025-08-07 | 13F | Resources Investment Advisors, LLC. | 689 223 | −1,08 | 17 734 | 0,76 | ||||
| 2025-08-12 | 13F | Integrated Advisors Network LLC | 9 900 | −40,04 | 255 | −39,09 | ||||
| 2025-08-12 | 13F | Proequities, Inc. | 0 | 0 | ||||||
| 2025-04-25 | 13F | Mather Group, Llc. | 0 | −100,00 | 0 | |||||
| 2025-08-29 | 13F | Centaurus Financial, Inc. | 10 785 | 0 | ||||||
| 2025-08-05 | 13F | Scarborough Advisors, LLC | 113 140 | −6,43 | 2 911 | −4,68 | ||||
| 2025-08-01 | 13F | New York Life Investment Management Llc | 474 820 | 19,04 | 12 217 | 21,26 | ||||
| 2025-08-13 | 13F | Empire Financial Management Company, LLC | 204 996 | −0,32 | 5 275 | 1,54 | ||||
| 2025-07-23 | 13F | Columbus Macro, LLC | 36 690 | 944 | ||||||
| 2025-08-14 | 13F | Integrated Wealth Concepts LLC | 28 097 | 5,26 | 723 | 7,12 | ||||
| 2025-08-13 | 13F | IAG Wealth Partners, LLC | 414 567 | 19,85 | 10 667 | 22,08 | ||||
| 2025-07-07 | 13F | Upper Left Wealth Management, LLC | 181 056 | 19,21 | 4 659 | 21,43 | ||||
| 2025-08-06 | 13F | Commonwealth Equity Services, Llc | 498 815 | −25,63 | 13 | −25,00 | ||||
| 2025-07-22 | 13F | Merit Financial Group, LLC | 36 954 | 951 | ||||||
| 2025-07-23 | 13F | Litman Gregory Asset Management LLC | 1 166 894 | −1,13 | 30 024 | 0,71 | ||||
| 2025-08-06 | 13F | Summit Wealth & Retirement Planning, Inc. | 585 899 | 3,96 | 15 075 | 5,89 | ||||
| 2025-08-04 | 13F | Atria Investments Llc | 115 102 | −4,19 | 2 962 | −2,41 | ||||
| 2025-08-08 | 13F | Gts Securities Llc | 0 | −100,00 | 0 | |||||
| 2025-04-15 | 13F | Kozak & Associates, Inc. | 0 | −100,00 | 0 | |||||
| 2025-08-13 | 13F | EverSource Wealth Advisors, LLC | 6 930 | −7,23 | 178 | −5,32 | ||||
| 2025-07-16 | 13F | Octavia Wealth Advisors, LLC | 0 | −100,00 | 0 | |||||
| 2025-07-31 | 13F | Cambridge Investment Research Advisors, Inc. | 196 550 | −6,71 | 5 | 0,00 | ||||
| 2025-08-14 | 13F | Aqr Capital Management Llc | 18 673 | −14,18 | 480 | −12,57 | ||||
| 2025-08-14 | 13F | Susquehanna International Group, Llp | 20 938 | −38,82 | 539 | −37,73 | ||||
| 2025-08-06 | 13F | Wedbush Securities Inc | 18 949 | 3,27 | 0 | |||||
| 2025-07-15 | 13F | Cranbrook Wealth Management, LLC | 0 | −100,00 | 0 | |||||
| 2025-07-21 | 13F | Rainey & Randall Investment Management Inc. | 63 699 | −80,25 | 1 639 | −79,89 | ||||
| 2025-08-12 | 13F | Steward Partners Investment Advisory, Llc | 18 927 | −7,45 | 487 | −5,81 | ||||
| 2025-07-16 | 13F | Perigon Wealth Management, LLC | 8 351 | −5,77 | 215 | −4,04 | ||||
| 2025-08-11 | 13F | Lake Street Financial Llc | 12 904 | −43,17 | 332 | −42,06 | ||||
| 2025-07-22 | 13F | Simplicity Wealth,LLC | 28 924 | 744 | ||||||
| 2025-07-10 | 13F | Professional Financial Advisors, LLC | 179 591 | 8,41 | 4 621 | 10,42 | ||||
| 2025-07-17 | 13F | Sterneck Capital Management, LLC | 44 052 | 1,69 | 1 133 | 3,56 | ||||
| 2025-07-31 | 13F | Brighton Jones Llc | 10 321 | 4,81 | 266 | 6,85 | ||||
| 2025-07-28 | 13F | Naviter Wealth, LLC | 0 | −100,00 | 0 | |||||
| 2025-08-07 | 13F | LFA - Lugano Financial Advisors SA | 11 620 | 0,00 | 299 | 1,71 | ||||
| 2025-08-14 | 13F/A | Rockefeller Capital Management L.P. | 24 552 | 0,00 | 632 | 1,77 | ||||
| 2025-08-14 | 13F | L2 Asset Management, LLC | 9 574 | 246 | ||||||
| 2025-07-21 | 13F | Greenwood Capital Associates Llc | 16 874 | 24,03 | 434 | 26,53 | ||||
| 2025-08-14 | 13F | Stifel Financial Corp | 60 221 | 33,02 | 1 550 | 35,52 | ||||
| 2025-08-14 | 13F | Two Sigma Securities, Llc | 10 342 | 266 | ||||||
| 2025-07-17 | 13F | Raleigh Capital Management Inc. | 3 601 | −8,95 | 93 | −7,07 | ||||
| 2025-06-30 | NP | ASTIX - Astor Dynamic Allocation Fund Class I shares | 79 365 | 0,00 | 2 005 | −4,57 | ||||
| 2025-07-25 | 13F | Concurrent Investment Advisors, LLC | 20 387 | 46,69 | 525 | 49,29 | ||||
| 2025-08-13 | 13F | Avestar Capital, LLC | 156 034 | 8,03 | 4 015 | 10,03 | ||||
| 2025-04-21 | 13F | Nelson, Van Denburg & Campbell Wealth Management Group, LLC | 0 | −100,00 | 0 | |||||
| 2025-04-28 | 13F | DAVENPORT & Co LLC | 0 | −100,00 | 0 | |||||
| 2025-07-31 | 13F | Leelyn Smith, LLC | 259 877 | 2,61 | 6 687 | 4,52 | ||||
| 2025-08-12 | 13F | Financial Advocates Investment Management | 18 891 | 6,61 | 486 | 8,72 | ||||
| 2025-08-14 | 13F | CoreCap Advisors, LLC | 129 462 | 3,31 | 3 331 | 5,24 | ||||
| 2025-08-13 | 13F | Cerity Partners LLC | 30 905 | 0,31 | 795 | 2,19 | ||||
| 2025-08-14 | 13F | Capitolis Liquid Global Markets LLC | 149 300 | −18,01 | 3 841 | −16,48 | ||||
| 2025-08-13 | 13F | Proactive Wealth Strategies LLC | 19 545 | −9,45 | 1 | |||||
| 2025-08-06 | 13F | AE Wealth Management LLC | 25 986 | 21,54 | 669 | 23,70 | ||||
| 2025-07-15 | 13F | Genesis Wealth Advisors, LLC | 10 189 | 0,00 | 262 | 1,95 | ||||
| 2025-07-01 | 13F | Burkett Financial Services, Llc | 0 | −100,00 | 0 | |||||
| 2025-07-28 | 13F | Kiker Wealth Management, LLC | 21 | 0,00 | 1 | |||||
| 2025-08-27 | 13F/A | Brinker Capital Investments, LLC | 18 342 | −2,36 | 472 | −0,63 | ||||
| 2025-07-11 | 13F | Farther Finance Advisors, LLC | 107 476 | −37,84 | 2 765 | −36,80 | ||||
| 2025-05-09 | 13F | Sound Financial Strategies Group, LLC | 0 | −100,00 | 0 | |||||
| 2025-07-21 | 13F | Ashton Thomas Securities, Llc | 133 968 | 3 447 | ||||||
| 2025-07-29 | 13F | Goldstein Advisors, LLC | 1 180 035 | −1,99 | 30 362 | −0,17 | ||||
| 2025-08-12 | 13F | Jpmorgan Chase & Co | 248 279 | 3,75 | 6 388 | 5,67 | ||||
| 2025-04-28 | 13F | Rossby Financial, LCC | 0 | 0 | ||||||
| 2025-08-05 | 13F | Bank Of Montreal /can/ | 22 324 | −0,49 | 574 | 1,41 | ||||
| 2025-07-25 | 13F | RHS Financial, LLC | 50 250 | −5,47 | 1 293 | −3,73 | ||||
| 2025-07-24 | 13F | Eastern Bank | 0 | −100,00 | 0 | |||||
| 2025-07-15 | 13F | Fortitude Family Office, LLC | 339 371 | 9,16 | 8 732 | 11,21 | ||||
| 2025-08-13 | 13F | Baird Financial Group, Inc. | 171 235 | −2,68 | 4 406 | −0,88 | ||||
| 2025-07-24 | 13F | Us Bancorp \de\ | 360 | −50,14 | 9 | −50,00 | ||||
| 2025-08-14 | 13F | Hilltop Holdings Inc. | 76 306 | 0,39 | 1 963 | 2,29 | ||||
| 2025-07-28 | 13F | Harbour Investments, Inc. | 8 933 | 8,48 | 230 | 10,10 | ||||
| 2025-08-15 | 13F | Captrust Financial Advisors | 81 817 | −18,50 | 2 105 | −16,96 | ||||
| 2025-07-31 | 13F | Oppenheimer & Co Inc | 0 | −100,00 | 0 | |||||
| 2025-08-13 | 13F | Johnson Financial Group, Inc. | 164 | 4 | ||||||
| 2025-06-26 | NP | FARX - Frontier Asset Absolute Return ETF | 27 016 | −6,38 | 682 | −10,62 | ||||
| 2025-08-06 | 13F | Savant Capital, LLC | 704 535 | 54,00 | 18 128 | 56,86 | ||||
| 2025-07-11 | 13F | UMA Financial Services, Inc. | 0 | −100,00 | 0 | |||||
| 2025-06-25 | NP | QAI - IQ Hedge Multi-Strategy Tracker ETF | 353 804 | 17,72 | 8 937 | 12,34 | ||||
| 2025-08-11 | 13F | Inspire Advisors, LLC | 8 032 | 207 | ||||||
| 2025-07-16 | 13F | Twelve Points Wealth Management LLC | 66 857 | 0,09 | 1 720 | 1,96 | ||||
| 2025-04-15 | 13F | Reuter James Wealth Management, Llc | 0 | −100,00 | 0 | |||||
| 2025-08-12 | 13F | Frontier Asset Management, LLC | 65 772 | −48,94 | 1 692 | −47,99 | ||||
| 2025-08-12 | 13F | MAI Capital Management | 40 749 | −13,70 | 1 048 | −12,08 | ||||
| 2025-05-23 | 13F | SWAN Capital LLC | 0 | −100,00 | 0 | |||||
| 2025-07-31 | 13F | Cardinal Point Capital Management, ULC | 1 084 995 | −0,26 | 27 917 | 1,59 | ||||
| 2025-08-08 | 13F | Advyzon Investment Management, LLC | 10 994 | 4,32 | 283 | 6,02 | ||||
| 2025-08-14 | 13F | Family Office Research LLC | 32 487 | 29,58 | 836 | 31,91 | ||||
| 2025-08-04 | 13F | Creekmur Asset Management LLC | 426 | 9,79 | 11 | 11,11 | ||||
| 2025-08-14 | 13F | Bank Of America Corp /de/ | 33 263 | 3,99 | 856 | 5,95 |