Grunnleggende statistikk
| Institusjonelle aksjer (Long) | 49 612 875 - 23,42% (ex 13D/G) - change of 15,01MM shares 43,39% MRQ |
| Institusjonell verdi (Long) | $ 467 414 USD ($1000) |
Institusjonelt eierskap og aksjonærer
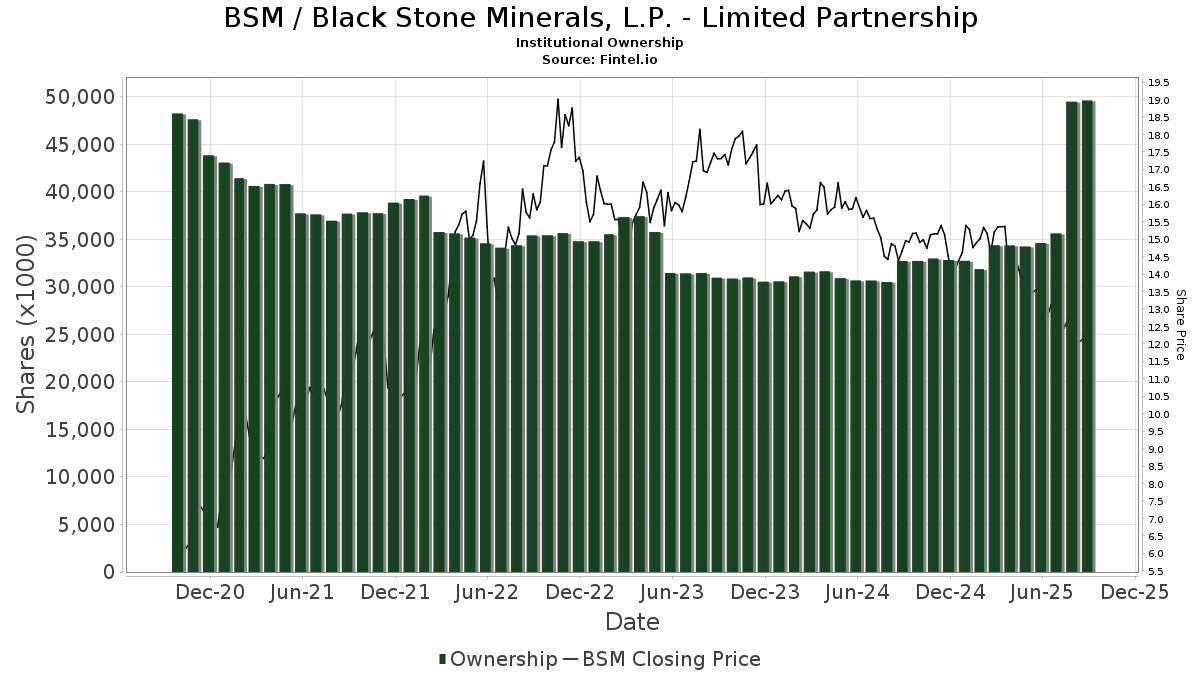
Black Stone Minerals, L.P. - Limited Partnership (US:BSM) har 211 institusjonelle eiere og aksjonærer som har sendt inn 13D/G- eller 13F-skjemaer til Securities Exchange Commission (SEC). Disse institusjonene eier til sammen 49,612,875 aksjer. De største aksjonærene inkluderer Kingstone Capital Partners Texas, LLC, William Marsh Rice University, Morgan Stanley, Bank Of America Corp /de/, Penn Davis Mcfarland Inc, Investment Management Associates Inc /adv, Natixis, UBS Group AG, MIRAE ASSET GLOBAL ETFS HOLDINGS Ltd., and DIV - Global X SuperDividend U.S. ETF .
Black Stone Minerals, L.P. - Limited Partnership (NYSE:BSM) institusjonell eierstruktur viser nåværende posisjoner i selskapet fordelt på institusjoner og fond, samt de siste endringene i posisjonsstørrelse. De største aksjonærene kan være individuelle investorer, verdipapirfond, hedgefond eller institusjoner. Schedule 13D indikerer at investoren eier (eller har eid) mer enn 5 % av selskapet og har til hensikt (eller hadde til hensikt) å aktivt forfølge en endring i forretningsstrategien. Schedule 13G indikerer en passiv investering på over 5 %.
The share price as of September 11, 2025 is 12,58 / share. Previously, on September 12, 2024, the share price was 14,79 / share. This represents a decline of 14,94% over that period.
Fondssentiment-score
Fondssentiment Score (også kjent som akkumulering av eierskap poengsum) viser hvilke aksjer som er mest kjøpt av fond. Den er resultatet av en sofistikert, kvantitativ flerfaktormodell som identifiserer selskaper med de høyeste nivåene av institusjonell akkumulering. Beregningsmodellen for poeng bruker en kombinasjon av den totale økningen i antall offentliggjorte eiere, endringer i porteføljeallokeringen til disse eierne og andre beregninger. Tallet går fra 0 til 100, der høyere tall indikerer en høyere grad av akkumulering i forhold til sammenlignbare selskaper, der 50 er gjennomsnittet.
Oppdateringsfrekvens: Daglig
Sjekk ut Ownership Explorer, som inneholder en liste over de høyest rangerte selskapene.
Institusjonell Put/Call-forhold
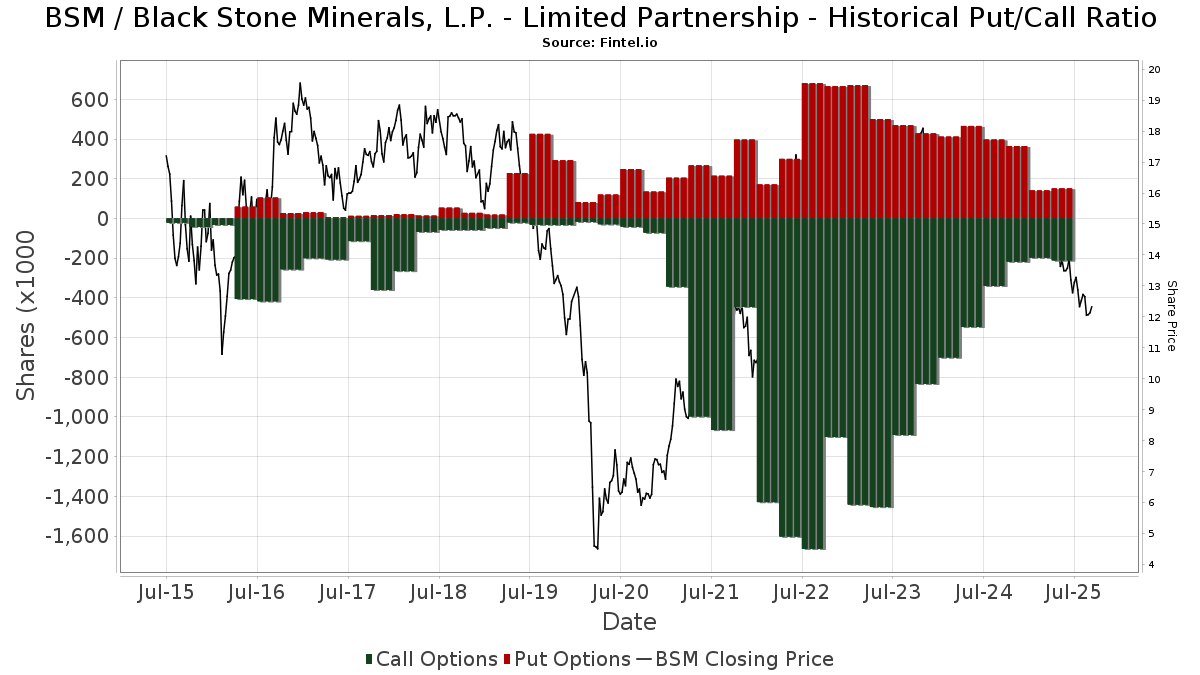
I tillegg til å rapportere standard aksje- og gjeldsemisjoner må institusjoner med mer enn 100 millioner kroner i forvaltningskapital også oppgi beholdningen av put- og callopsjoner. Siden put-opsjoner generelt indikerer et negativt sentiment, og call-opsjoner indikerer et positivt sentiment, kan vi få et inntrykk av det generelle institusjonelle sentimentet ved å plotte forholdet mellom put- og call-opsjoner. Diagrammet til høyre viser det historiske forholdet mellom put- og call-opsjoner for dette instrumentet.
Ved å bruke Put/Call-forholdet som en indikator på investorsentimentet kan man overvinne en av de viktigste svakhetene ved å bruke totalt institusjonelt eierskap, nemlig at en betydelig andel av forvaltningskapitalen investeres passivt for å følge indekser. Passivt forvaltede fond kjøper vanligvis ikke opsjoner, slik at indikatoren for put/call-forhold i større grad gjenspeiler stemningen i aktivt forvaltede fond.
13D/G-arkiveringer
Vi presenterer 13D/G-arkiveringene separat fra 13F-arkiveringene fordi de behandles forskjellig av SEC. 13D/G-arkiveringene kan sendes inn av grupper av investorer (med én leder), mens 13D/G-arkiveringene ikke kan sendes inn. Dette fører til situasjoner der en investor kan sende inn en 13D/G-rapport med én verdi for alle aksjene (som representerer alle aksjene som eies av investorgruppen), men deretter sende inn en 13F-melding med en annen verdi for alle aksjene (som kun representerer deres eget eierskap). Dette betyr at aksjeeierskap i 13D/G-arkiveringene og 13F-arkiveringene ofte ikke er direkte sammenlignbare, og vi presenterer dem derfor separat.
Merk: Fra og med 16. mai 2021 viser vi ikke lenger eiere som ikke har sendt inn en 13D/G i løpet av det siste året. Tidligere viste vi hele historikken for 13D/G-arkiveringer. Generelt må enheter som er pålagt å sende inn 13D/G-arkiveringer, sende inn minst én gang i året før de sender inn en avsluttende rapport. Det hender imidlertid at fond trekker seg ut av posisjoner uten å sende inn en avsluttende innlevering (dvs. at de avvikler), slik at visning av hele historikken av og til fører til forvirring om det nåværende eierskapet. For å unngå forvirring viser vi nå bare "nåværende" eiere, det vil si eiere som har sendt inn informasjon i løpet av det siste året.
Upgrade to unlock premium data.
| Fildato | Skjema | Investor | Tidligere aksjer |
Siste aksjer |
Δ Aksjer (prosent) |
Eierandel (prosent) |
Δ Eierandel (prosent) |
|
|---|---|---|---|---|---|---|---|---|
| 2025-05-13 | Carlyle Group Inc. | 14,711,219 | 0 | -100.00 | 0.00 | -100.00 |
13F- og NPORT-arkiveringer
Detaljer om 13F-arkiveringer er gratis. Detaljer om NP-arkiveringer krever et premium-medlemskap. Grønne rader indikerer nye posisjoner. Røde rader indikerer lukkede posisjoner. Klikk på lenke ikonet for å se hele transaksjonshistorikken.
Oppgrader
for å låse opp premiedata og eksportere til Excel. ![]() .
.
| Fildato | Kilde | Investor | Type | Gjennomsnittlig pris (estimert) |
Aksjer | Δ Aksjer (%) |
Rapportert verdi ($1000) | Verdi (%) | Portallokering (%) | |
|---|---|---|---|---|---|---|---|---|---|---|
| 2025-07-11 | 13F | Farther Finance Advisors, LLC | 1 475 | 0,00 | 19 | −13,64 | ||||
| 2025-07-15 | 13F | Kempner Capital Management Inc. | 759 343 | 52,29 | 9 932 | 141 785,71 | ||||
| 2025-07-25 | 13F | Hazlett, Burt & Watson, Inc. | 14 | 0,00 | 0 | |||||
| 2025-08-12 | 13F | Franklin Resources Inc | 67 018 | −7,38 | 877 | −20,65 | ||||
| 2025-07-16 | 13F | William Marsh Rice University | 5 663 476 | 0,00 | 74 078 | −14,34 | ||||
| 2025-08-13 | 13F | Beacon Pointe Advisors, LLC | 99 903 | 0,13 | 1 307 | −14,25 | ||||
| 2025-08-14 | 13F | Hilltop Holdings Inc. | 12 900 | 0,00 | 169 | −14,29 | ||||
| 2025-04-07 | 13F | AdvisorNet Financial, Inc | 0 | −100,00 | 0 | |||||
| 2025-08-01 | 13F | Motco | 3 650 | 46 | ||||||
| 2025-07-14 | 13F | Clear Harbor Asset Management, LLC | 52 032 | 0,00 | 681 | −14,36 | ||||
| 2025-07-10 | 13F | Redhawk Wealth Advisors, Inc. | 10 489 | 137 | ||||||
| 2025-08-13 | 13F | Northern Trust Corp | 298 164 | −1,65 | 3 900 | −15,77 | ||||
| 2025-09-04 | 13F/A | Advisor Group Holdings, Inc. | 33 567 | −20,01 | 439 | −31,41 | ||||
| 2025-05-16 | 13F | Coppell Advisory Solutions LLC | 0 | −100,00 | 0 | |||||
| 2025-08-14 | 13F | Mariner, LLC | 14 057 | −71,53 | 184 | −75,73 | ||||
| 2025-08-04 | 13F | Flagship Harbor Advisors, Llc | 26 323 | 1,32 | 344 | −13,13 | ||||
| 2025-07-08 | 13F | Baker Ellis Asset Management LLC | 11 000 | −8,33 | 144 | −21,86 | ||||
| 2025-08-11 | 13F | Rahlfs Capital, Llc | 84 267 | 0,00 | 1 102 | −14,31 | ||||
| 2025-08-12 | 13F | BlackRock, Inc. | 700 | 16,67 | 9 | 0,00 | ||||
| 2025-08-06 | 13F | Pekin Hardy Strauss, Inc. | 18 000 | 0,00 | 235 | −14,23 | ||||
| 2025-08-12 | 13F | Holderness Investments Co | 10 650 | 139 | ||||||
| 2025-05-12 | 13F | Virtu Financial LLC | 0 | −100,00 | 0 | |||||
| 2025-05-13 | 13F | Aptus Capital Advisors, LLC | 0 | −100,00 | 0 | |||||
| 2025-07-16 | 13F | Eagle Global Advisors Llc | 89 122 | 0,00 | 1 166 | −14,34 | ||||
| 2025-05-13 | 13F | Lee Financial Co | 0 | −100,00 | 0 | |||||
| 2025-08-14 | 13F | Bank Of America Corp /de/ | 2 543 814 | 0,69 | 33 273 | −13,74 | ||||
| 2025-08-12 | 13F | Indie Asset Partners, LLC | 15 500 | −1,27 | 203 | −15,48 | ||||
| 2025-08-14 | 13F | Evergreen Capital Management Llc | 260 190 | −1,11 | 3 403 | −15,29 | ||||
| 2025-07-10 | 13F | Wealth Enhancement Advisory Services, Llc | 10 281 | 135 | ||||||
| 2025-08-06 | 13F | Adviser Investments LLC | 58 873 | 0,00 | 770 | −14,25 | ||||
| 2025-08-14 | 13F | Vident Advisory, LLC | 0 | −100,00 | 0 | |||||
| 2025-07-31 | 13F | Sumitomo Mitsui Trust Holdings, Inc. | 68 000 | 0,00 | 889 | −14,35 | ||||
| 2025-08-12 | 13F | MAI Capital Management | 11 509 | −23,20 | 151 | −34,21 | ||||
| 2025-07-15 | 13F | Penn Davis Mcfarland Inc | 1 851 892 | −0,53 | 24 223 | −14,80 | ||||
| 2025-06-25 | NP | VRAI - Virtus Real Asset Income ETF | 10 196 | −3,73 | 144 | −6,54 | ||||
| 2025-08-18 | 13F | Geneos Wealth Management Inc. | 5 180 | 0,00 | 68 | −15,19 | ||||
| 2025-06-25 | NP | FTLS - First Trust Long/Short Equity ETF This fund is a listed as child fund of First Trust Advisors Lp and if that institution has disclosed ownership in this security, then these positions will not be double counted when calculating total shares and total value | 26 114 | −84,67 | 368 | −86,83 | ||||
| 2025-08-14 | 13F | Sunbelt Securities, Inc. | 21 294 | −0,34 | 311 | −4,91 | ||||
| 2025-05-27 | NP | AZBAX - AllianzGI Small-Cap Fund Class A | 15 285 | 98,89 | 233 | 395,74 | ||||
| 2025-08-13 | 13F | Virtus Investment Advisers, Inc. | 12 987 | 21,29 | 170 | 3,68 | ||||
| 2025-07-24 | 13F | Us Bancorp \de\ | 19 775 | 10,17 | 259 | −5,84 | ||||
| 2025-07-28 | 13F | Kiker Wealth Management, LLC | 10 750 | 0,00 | 141 | −14,63 | ||||
| 2025-07-22 | 13F | MAS Advisors LLC | 26 176 | 4,14 | 342 | −10,70 | ||||
| 2025-08-13 | 13F | Fiduciary Group LLC | 25 120 | 18,39 | 329 | 1,55 | ||||
| 2025-08-20 | NP | LSPAX - LoCorr Spectrum Income Fund Class A | 61 024 | 0,00 | 798 | −14,29 | ||||
| 2025-06-26 | NP | GYLD - Arrow Dow Jones Global Yield ETF | 8 868 | −5,55 | 125 | −7,41 | ||||
| 2025-08-11 | 13F | Annis Gardner Whiting Capital Advisors, LLC | 500 | 0,00 | 7 | −14,29 | ||||
| 2025-08-14 | 13F | IHT Wealth Management, LLC | 22 598 | 5,14 | 296 | −10,06 | ||||
| 2025-08-20 | NP | CONWX - Concorde Wealth Management Fund | 100 336 | 0,00 | 1 312 | −14,36 | ||||
| 2025-07-11 | 13F | Caldwell Securities, Inc | 55 790 | 0,00 | 730 | −14,34 | ||||
| 2025-06-25 | NP | CCNR - ALPS | CoreCommodity Natural Resources ETF | 45 177 | 13,46 | 637 | 10,59 | ||||
| 2025-07-29 | 13F | Regions Financial Corp | 395 999 | 1,41 | 5 180 | −13,13 | ||||
| 2025-07-31 | 13F | Cambridge Investment Research Advisors, Inc. | 399 907 | 1,02 | 5 | −16,67 | ||||
| 2025-08-14 | 13F | Icon Wealth Advisors, LLC | 84 263 | 2,71 | 1 102 | −11,98 | ||||
| 2025-04-15 | 13F | SJS Investment Consulting Inc. | 0 | −100,00 | 0 | −100,00 | ||||
| 2025-08-11 | 13F | Strategic Wealth Partners, Ltd. | 534 | 7 | ||||||
| 2025-07-17 | 13F | Sound Income Strategies, LLC | 1 300 | 17 | ||||||
| 2025-08-13 | 13F | Van Hulzen Asset Management, LLC | 0 | −100,00 | 0 | |||||
| 2025-08-13 | 13F | ARGI Investment Services, LLC | 157 | −3,09 | 315 | −14,40 | ||||
| 2025-08-28 | NP | KVLE - KFA Value Line(R) Dynamic Core Equity Index ETF | 0 | −100,00 | 0 | −100,00 | ||||
| 2025-08-01 | 13F | Chilton Capital Management Llc | 209 | 0,00 | 3 | −33,33 | ||||
| 2025-07-31 | 13F | Mcdaniel Terry & Co | 119 987 | 0,00 | 1 569 | 156 800,00 | ||||
| 2025-08-06 | 13F | O'Brien Greene & Co. Inc | 100 000 | 0,00 | 1 308 | −14,34 | ||||
| 2025-07-10 | 13F | Exchange Traded Concepts, Llc | 20 855 | 173,58 | 273 | 134,48 | ||||
| 2025-08-14 | 13F | BancorpSouth Bank | 40 097 | 2,72 | 524 | −12,08 | ||||
| 2025-07-30 | NP | SOAEX - Spirit of America Energy Fund Class A | 164 999 | −27,31 | 2 203 | −35,14 | ||||
| 2025-07-21 | 13F | Hilltop National Bank | 11 900 | 3,48 | 156 | −7,19 | ||||
| 2025-08-12 | 13F | AlphaCore Capital LLC | 93 980 | 18,99 | 1 229 | 1,91 | ||||
| 2025-08-12 | 13F | SRS Capital Advisors, Inc. | 2 303 | 2,72 | 30 | −11,76 | ||||
| 2025-08-05 | 13F | Chase Investment Counsel Corp | 34 914 | 0,00 | 0 | |||||
| 2025-05-15 | 13F | Hrt Financial Lp | 0 | −100,00 | 0 | |||||
| 2025-08-14 | 13F | UBS Group AG | 1 253 920 | 29,20 | 16 401 | 10,68 | ||||
| 2025-07-15 | 13F | Colonial River Wealth Management, LLC | 19 050 | −3,05 | 253 | −16,00 | ||||
| 2025-07-28 | 13F | Harbour Investments, Inc. | 2 | 0 | ||||||
| 2025-08-06 | 13F | Moors & Cabot, Inc. | 63 000 | 1,45 | 824 | −13,08 | ||||
| 2025-08-11 | 13F | Lummis Asset Management, LP | 340 513 | 0,00 | 4 268 | −11,23 | ||||
| 2025-08-14 | 13F | Mercer Global Advisors Inc /adv | 93 592 | −1,34 | 1 224 | −15,47 | ||||
| 2025-07-01 | 13F | Cullen Investment Group, Ltd. | 15 667 | 2,71 | 205 | −12,07 | ||||
| 2025-08-11 | 13F | HighTower Advisors, LLC | 655 630 | 62,73 | 8 576 | 39,39 | ||||
| 2025-08-06 | 13F | Ing Groep Nv | 161 000 | 2 106 | ||||||
| 2025-08-08 | 13F | Hartland & Co., LLC | 0 | −100,00 | 0 | |||||
| 2025-08-07 | 13F | Zions Bancorporation, National Association /ut/ | 82 533 | 0,00 | 1 080 | −14,37 | ||||
| 2025-05-29 | NP | DSMC - Distillate Small/Mid Cash Flow ETF | 30 452 | −4,05 | 465 | 0,43 | ||||
| 2025-08-14 | 13F | Mudita Advisors LLP | 760 877 | 0,00 | 9 952 | −14,34 | ||||
| 2025-07-25 | 13F | Cwm, Llc | 538 | 0,00 | 0 | |||||
| 2025-07-29 | 13F | LMG Wealth Partners, LLC | 150 245 | 0,00 | 1 965 | −14,34 | ||||
| 2025-08-04 | 13F | Savvy Advisors, Inc. | 15 420 | 202 | ||||||
| 2025-08-14 | 13F | Jane Street Group, Llc | Call | 47 400 | 620 | |||||
| 2025-08-06 | 13F | Savant Capital, LLC | 90 742 | 0,00 | 1 187 | −14,37 | ||||
| 2025-08-19 | 13F | State of Wyoming | 31 657 | −8,22 | 414 | −21,29 | ||||
| 2025-08-12 | 13F | CIBC Private Wealth Group, LLC | 125 295 | −19,72 | 1 639 | −19,94 | ||||
| 2025-08-12 | 13F | Horizon Kinetics Asset Management Llc | 268 638 | 0,00 | 3 514 | −14,36 | ||||
| 2025-07-30 | 13F | Avidian Wealth Solutions, LLC | 29 000 | 0,00 | 379 | −14,25 | ||||
| 2025-08-12 | 13F | Jpmorgan Chase & Co | 17 982 | −84,55 | 235 | −86,77 | ||||
| 2025-08-14 | 13F | Bramshill Investments, LLC | 66 594 | 2,87 | 871 | −11,84 | ||||
| 2025-08-13 | 13F | SCS Capital Management LLC | 0 | −100,00 | 0 | |||||
| 2025-07-21 | 13F | Franklin Street Advisors Inc /nc | 20 000 | 0,00 | 0 | |||||
| 2025-08-04 | 13F | Creekmur Asset Management LLC | 12 | 0 | ||||||
| 2025-08-05 | 13F | Magnolia Capital Advisors Llc | 10 000 | 0,00 | 131 | −14,47 | ||||
| 2025-08-07 | 13F | Cypress Capital Management LLC (WY) | 600 | 0,00 | 8 | −22,22 | ||||
| 2025-08-12 | 13F | Bahl & Gaynor Inc | 61 500 | 0,00 | 804 | −14,38 | ||||
| 2025-07-14 | 13F | U.S. Capital Wealth Advisors, LLC | 21 956 | 0,86 | 287 | −13,55 | ||||
| 2025-08-12 | 13F | Clear Street Markets Llc | 0 | −100,00 | 0 | |||||
| 2025-07-21 | 13F | Vaughan Nelson Investment Management, L.p. | 5 600 | 0,00 | 73 | |||||
| 2025-07-10 | 13F | Moody National Bank Trust Division | 19 136 | 1,18 | 250 | −13,19 | ||||
| 2025-06-27 | NP | ZIG - The Acquirers Fund | 78 737 | −18,52 | 1 111 | −23,61 | ||||
| 2025-07-28 | 13F | Axxcess Wealth Management, Llc | 19 050 | −3,05 | 249 | −17,00 | ||||
| 2025-08-28 | NP | Amplify ETF Trust - Amplify Natural Resources Dividend Income ETF | 12 537 | −55,83 | 164 | −62,36 | ||||
| 2025-08-14 | 13F | EP Wealth Advisors, Inc. | 11 438 | 0,01 | 150 | −14,37 | ||||
| 2025-08-06 | 13F | Commonwealth Equity Services, Llc | 34 411 | 2,36 | 0 | |||||
| 2025-07-21 | 13F | F&V Capital Management, LLC | 0 | −100,00 | 0 | |||||
| 2025-08-13 | 13F | Invesco Ltd. | 94 180 | 10,22 | 1 232 | −5,60 | ||||
| 2025-07-24 | 13F | WMG Financial Advisors, LLC | 15 750 | 206 | ||||||
| 2025-08-13 | 13F | Aristides Capital LLC | 34 396 | 0,00 | 450 | −14,48 | ||||
| 2025-08-13 | 13F | Twin Peaks Wealth Advisors, LLC | 30 | 0 | ||||||
| 2025-08-13 | 13F | Cresset Asset Management, LLC | 596 853 | 0,00 | 7 807 | −14,34 | ||||
| 2025-08-13 | 13F | Natixis | 1 457 000 | −1,40 | 19 058 | −15,43 | ||||
| 2025-08-06 | 13F | North Capital, Inc. | 3 000 | 0,00 | 39 | −13,33 | ||||
| 2025-05-06 | 13F | Corps Capital Advisors, LLC | 0 | −100,00 | 0 | |||||
| 2025-07-29 | 13F | LB Partners LLC | 10 000 | 0,00 | 131 | −14,47 | ||||
| 2025-08-14 | 13F | Goldman Sachs Group Inc | 37 352 | 489 | ||||||
| 2025-08-14 | 13F | Avenir Corp | 73 900 | 0,00 | 967 | −14,36 | ||||
| 2025-08-18 | 13F | Wolverine Trading, Llc | Put | 0 | −100,00 | 0 | ||||
| 2025-08-05 | 13F | Simplex Trading, Llc | 3 513 | 0 | ||||||
| 2025-08-05 | 13F | Simplex Trading, Llc | Call | 56 000 | −7,13 | 1 | ||||
| 2025-08-06 | 13F | First Eagle Investment Management, LLC | 14 564 | 0,00 | 190 | −14,41 | ||||
| 2025-07-08 | 13F | Parallel Advisors, LLC | 381 | 2,70 | 5 | −20,00 | ||||
| 2025-07-11 | 13F | Arrow Investment Advisors, LLC | 10 943 | 143 | ||||||
| 2025-04-21 | 13F | ORG Partners LLC | 0 | −100,00 | 0 | |||||
| 2025-08-05 | 13F | Simplex Trading, Llc | Put | 10 900 | 67,69 | 0 | ||||
| 2025-08-11 | 13F | Krane Funds Advisors LLC | 0 | −100,00 | 0 | |||||
| 2025-08-14 | 13F | Wells Fargo & Company/mn | 127 301 | 42,19 | 1 665 | 21,80 | ||||
| 2025-08-12 | 13F | DiMeo Schneider & Associates, L.L.C. | 477 189 | −35,98 | 6 242 | −45,17 | ||||
| 2025-07-31 | 13F | Anthracite Investment Company, Inc. | 88 104 | 0,00 | 1 152 | −14,35 | ||||
| 2025-07-08 | 13F | Nbc Securities, Inc. | 2 053 | 1,38 | 0 | |||||
| 2025-08-01 | 13F | Envestnet Asset Management Inc | 58 036 | 0,00 | 759 | −14,33 | ||||
| 2025-05-12 | 13F | Fmr Llc | 0 | −100,00 | 0 | |||||
| 2025-08-15 | 13F | Tower Research Capital LLC (TRC) | 7 289 | 7 822,83 | 95 | 9 400,00 | ||||
| 2025-07-29 | NP | FIKDX - Kempner Multi-Cap Deep Value Fund Institutional Class | 169 300 | 2 260 | ||||||
| 2025-07-11 | 13F | Kingstone Capital Partners Texas, LLC | 13 434 351 | 226 | ||||||
| 2025-07-15 | 13F | Financial Management Professionals, Inc. | 1 418 | 2,68 | 19 | −14,29 | ||||
| 2025-08-14 | 13F | Fayez Sarofim & Co | 515 045 | 4,95 | 6 737 | −10,10 | ||||
| 2025-07-15 | 13F | BCS Wealth Management | 17 213 | 16,42 | 0 | |||||
| 2025-07-02 | 13F | Doliver Advisors, Lp | 31 374 | −1,13 | 410 | −15,29 | ||||
| 2025-08-15 | 13F | Morgan Stanley | 3 876 819 | −5,62 | 50 709 | −19,16 | ||||
| 2025-07-15 | 13F | Clarus Group, Inc. | 333 996 | 0,00 | 4 369 | −14,35 | ||||
| 2025-08-08 | 13F/A | Sterling Capital Management LLC | 13 483 | 1,34 | 176 | −13,30 | ||||
| 2025-08-26 | NP | MDIV - Multi-Asset Diversified Income Index Fund This fund is a listed as child fund of First Trust Advisors Lp and if that institution has disclosed ownership in this security, then these positions will not be double counted when calculating total shares and total value | 315 949 | −9,95 | 4 133 | −22,87 | ||||
| 2025-08-14 | 13F | Susquehanna International Group, Llp | 36 638 | 51,52 | 479 | 29,81 | ||||
| 2025-08-14 | 13F | Susquehanna International Group, Llp | Put | 52 900 | 71,75 | 692 | 47,02 | |||
| 2025-08-14 | 13F | Susquehanna International Group, Llp | Call | 23 500 | −61,22 | 307 | −66,81 | |||
| 2025-08-12 | 13F | Jefferies Financial Group Inc. | 62 400 | 0,00 | 816 | −14,29 | ||||
| 2025-08-13 | 13F | Epacria Capital Partners, Llc | 578 422 | 0,00 | 7 566 | −14,35 | ||||
| 2025-08-13 | 13F | Rsm Us Wealth Management Llc | 13 205 | 1,07 | 173 | −13,57 | ||||
| 2025-08-14 | 13F | CoreCap Advisors, LLC | 1 021 | 2,51 | 13 | −13,33 | ||||
| 2025-08-12 | 13F | TCTC Holdings, LLC | 6 666 | 0,00 | 87 | −13,86 | ||||
| 2025-07-11 | 13F | LongView Wealth Management | 12 681 | −12,95 | 166 | −25,68 | ||||
| 2025-07-15 | 13F | Mather Group, Llc. | 0 | −100,00 | 0 | |||||
| 2025-08-15 | 13F | Kestra Advisory Services, LLC | 12 598 | 11,24 | 165 | −4,65 | ||||
| 2025-08-12 | 13F | Global Retirement Partners, LLC | 29 450 | 385 | ||||||
| 2025-08-14 | 13F | CoreCommodity Management, LLC | 49 725 | −3,22 | 650 | −17,09 | ||||
| 2025-08-15 | 13F | CI Private Wealth, LLC | 174 476 | 50,15 | 2 282 | 28,64 | ||||
| 2025-07-17 | 13F | GraniteShares Advisors LLC | 191 917 | 6,66 | 2 510 | −8,63 | ||||
| 2025-08-13 | 13F | Jones Financial Companies Lllp | 2 000 | −34,21 | 26 | −43,48 | ||||
| 2025-07-30 | 13F | Cullen/frost Bankers, Inc. | 67 359 | 0,00 | 881 | −14,30 | ||||
| 2025-08-13 | 13F | Brown Advisory Inc | 896 934 | 0,00 | 11 732 | −14,35 | ||||
| 2025-08-05 | 13F | Welch & Forbes Llc | 58 966 | 0,00 | 771 | −14,33 | ||||
| 2025-08-14 | 13F | Family Management Corp | 39 767 | 0,00 | 520 | −14,33 | ||||
| 2025-08-08 | 13F | Pnc Financial Services Group, Inc. | 500 | −73,68 | 7 | −79,31 | ||||
| 2025-07-22 | 13F | Autumn Glory Partners, LLC | 31 600 | 0,00 | 413 | −14,32 | ||||
| 2025-06-30 | NP | CVY - Invesco Zacks Multi-Asset Income ETF This fund is a listed as child fund of Invesco Ltd. and if that institution has disclosed ownership in this security, then these positions will not be double counted when calculating total shares and total value | 84 689 | 3,50 | 1 195 | 0,84 | ||||
| 2025-08-14 | 13F | Stifel Financial Corp | 137 887 | −19,80 | 1 804 | −31,31 | ||||
| 2025-05-13 | 13F | Wealthedge Investment Advisors, Llc | 0 | −100,00 | 0 | |||||
| 2025-07-23 | 13F | Mraz, Amerine & Associates, Inc. | 132 598 | 7,58 | 1 734 | −7,62 | ||||
| 2025-08-14 | 13F | Boston Private Wealth Llc | 0 | −100,00 | 0 | |||||
| 2025-05-13 | 13F | Clear Street Markets Llc | Put | 0 | −100,00 | 0 | ||||
| 2025-07-18 | 13F | Truist Financial Corp | 22 288 | 0,00 | 292 | −14,41 | ||||
| 2025-07-17 | 13F | Nicholson Meyer Capital Management, Inc. | 14 687 | 0,00 | 192 | −14,29 | ||||
| 2025-07-16 | 13F | ORG Wealth Partners, LLC | 14 238 | 0,00 | 187 | −14,22 | ||||
| 2025-05-08 | 13F | Clark Estates Inc/ny | 0 | −100,00 | 0 | |||||
| 2025-07-24 | 13F | IFP Advisors, Inc | 1 353 | 32,00 | 18 | 13,33 | ||||
| 2025-07-17 | 13F | Wolff Wiese Magana Llc | 1 000 | 0,00 | 13 | −13,33 | ||||
| 2025-08-12 | 13F | Skopos Labs, Inc. | 51 | 0,00 | 1 | |||||
| 2025-07-29 | 13F | Stratos Wealth Partners, LTD. | 10 113 | 132 | ||||||
| 2025-08-12 | 13F | Waterloo Capital, L.P. | 21 000 | 0,00 | 275 | −14,37 | ||||
| 2025-08-13 | 13F | Virtus ETF Advisers LLC | 0 | −100,00 | 0 | |||||
| 2025-08-11 | 13F | Independent Advisor Alliance | 74 998 | 2,06 | 981 | −12,66 | ||||
| 2025-08-14 | 13F | Royal Bank Of Canada | 142 886 | 19,18 | 1 869 | 2,08 | ||||
| 2025-08-14 | 13F | Concorde Financial Corp | 601 495 | −0,31 | 7 868 | −14,61 | ||||
| 2025-07-29 | 13F | Tweedy, Browne Co LLC | 20 855 | 273 | ||||||
| 2025-08-13 | 13F | Annandale Capital, LLC | 14 382 | 0,00 | 0 | |||||
| 2025-08-19 | 13F | Newbridge Financial Services Group, Inc. | 2 981 | 71,72 | 39 | 46,15 | ||||
| 2025-08-14 | 13F | Peak6 Llc | Call | 12 400 | 0,00 | 162 | −14,29 | |||
| 2025-08-04 | 13F | Investment Management Associates Inc /adv | 1 577 887 | 2,77 | 20 639 | −11,97 | ||||
| 2025-06-27 | NP | DIV - Global X SuperDividend U.S. ETF This fund is a listed as child fund of Mirae Asset Global Investments Co., Ltd. and if that institution has disclosed ownership in this security, then these positions will not be double counted when calculating total shares and total value | 899 843 | 15,20 | 12 697 | 1,91 | ||||
| 2025-07-31 | 13F | Board of Trustees of The Leland Stanford Junior University | 147 852 | 0,00 | 1 934 | −14,36 | ||||
| 2025-05-14 | 13F | Custom Index Systems, Llc | 0 | −100,00 | 0 | |||||
| 2025-08-08 | 13F | Creative Planning | 13 685 | 2,01 | 179 | −12,75 | ||||
| 2025-08-13 | 13F | Jump Financial, LLC | 94 025 | 1 230 | ||||||
| 2025-08-14 | 13F | Ancora Advisors, LLC | 41 899 | −9,19 | 548 | −22,16 | ||||
| 2025-07-21 | 13F | Empirical Financial Services, LLC d.b.a. Empirical Wealth Management | 17 000 | 0,00 | 222 | −14,29 | ||||
| 2025-08-05 | 13F | Gruss & Co., LLC | 71 016 | 0,00 | 929 | −14,39 | ||||
| 2025-08-12 | 13F | Proequities, Inc. | Put | 0 | 0 | |||||
| 2025-08-12 | 13F | Proequities, Inc. | Call | 0 | 0 | |||||
| 2025-08-12 | 13F | Proequities, Inc. | 0 | 0 | ||||||
| 2025-07-18 | 13F | Bartlett & Co. Wealth Management Llc | 32 746 | 0,00 | 428 | −14,40 | ||||
| 2025-07-29 | 13F | Private Trust Co Na | 500 | 0,00 | 7 | −14,29 | ||||
| 2025-07-24 | 13F | Jfs Wealth Advisors, Llc | 32 747 | 0,00 | 428 | −14,40 | ||||
| 2025-08-12 | 13F | Steward Partners Investment Advisory, Llc | 20 290 | −25,79 | 265 | −36,45 | ||||
| 2025-08-08 | 13F | Grandfield & Dodd, Llc | 30 382 | 397 | ||||||
| 2025-08-14 | 13F | Group One Trading, L.p. | Call | 39 700 | −8,31 | 519 | −21,48 | |||
| 2025-08-19 | 13F | Advisory Services Network, LLC | 48 375 | 207,63 | 606 | 152,50 | ||||
| 2025-08-14 | 13F | Wealth Preservation Advisors, LLC | 0 | −100,00 | 0 | |||||
| 2025-08-14 | 13F | Guardian Wealth Management, Inc. | 12 082 | 0,60 | 158 | −13,66 | ||||
| 2025-08-14 | 13F | Group One Trading, L.p. | Put | 1 700 | −69,64 | 22 | −74,12 | |||
| 2025-07-07 | 13F | Thurston, Springer, Miller, Herd & Titak, Inc. | 300 | 0,00 | 4 | −25,00 | ||||
| 2025-05-14 | 13F | Group One Trading, L.p. | 0 | −100,00 | 0 | −100,00 | ||||
| 2025-07-22 | 13F | Belpointe Asset Management LLC | 14 975 | 8,02 | 196 | −7,58 | ||||
| 2025-07-22 | 13F | Gsa Capital Partners Llp | 36 463 | 0 | ||||||
| 2025-08-14 | 13F | Jane Street Group, Llc | 0 | −100,00 | 0 | |||||
| 2025-05-29 | NP | PMEFX - PENN MUTUAL AM 1847 INCOME FUND I Shares | 0 | −100,00 | 0 | −100,00 | ||||
| 2025-08-06 | 13F | Golden State Wealth Management, LLC | 515 | 0,00 | 7 | −14,29 | ||||
| 2025-08-12 | 13F | LPL Financial LLC | 175 728 | 19,13 | 2 299 | 2,04 | ||||
| 2025-08-04 | 13F | Bristlecone Advisors, LLC | 0 | −100,00 | 0 | |||||
| 2025-08-27 | NP | TPDAX - Timothy Plan Defensive Strategies Fund Class A | 1 128 | 0,00 | 15 | −17,65 | ||||
| 2025-06-27 | NP | FERRX - First Eagle Global Real Assets Fund Class R6 | 14 564 | 154,84 | 205 | 150,00 | ||||
| 2025-07-30 | 13F | Bogart Wealth, LLC | 1 623 | 0,00 | 21 | −12,50 | ||||
| 2025-08-26 | NP | GAFCX - Virtus AlphaSimplex Global Alternatives Fund Class C | 7 667 | 92,30 | 100 | 66,67 | ||||
| 2025-08-14 | 13F | Citadel Advisors Llc | Call | 32 100 | 52,86 | 420 | 30,94 | |||
| 2025-07-29 | 13F | Spirit Of America Management Corp/ny | 142 999 | −34,70 | 1 870 | −44,08 | ||||
| 2025-08-14 | 13F | Citadel Advisors Llc | 114 864 | −16,25 | 1 502 | −28,27 | ||||
| 2025-07-29 | NP | COPY - Tweedy, Browne Insider + Value ETF | 12 936 | 146,54 | 173 | 120,51 | ||||
| 2025-08-14 | 13F | Citadel Advisors Llc | Put | 86 000 | 1,18 | 1 125 | −13,34 | |||
| 2025-08-08 | 13F | Cetera Investment Advisers | 71 222 | −2,17 | 932 | −16,20 | ||||
| 2025-08-14 | 13F | Toroso Investments, LLC | 12 537 | −88,30 | 164 | −90,03 | ||||
| 2025-05-06 | 13F | Venturi Wealth Management, LLC | 0 | −100,00 | 0 | |||||
| 2025-07-02 | 13F | Howard Financial Services, Ltd. | 91 882 | 0,24 | 1 202 | −14,15 | ||||
| 2025-08-14 | 13F/A | Barclays Plc | 1 632 | −25,24 | 0 | |||||
| 2025-05-13 | 13F | Penn Mutual Asset Management, LLC | 0 | −100,00 | 0 | |||||
| 2025-08-14 | 13F | Raymond James Financial Inc | 263 307 | 6,57 | 3 444 | −8,70 | ||||
| 2025-08-29 | NP | GraniteShares ETF Trust - GraniteShares HIPS US High Income ETF | 191 917 | 6,66 | 2 510 | −8,63 | ||||
| 2025-08-14 | 13F | Fwl Investment Management, Llc | 285 | 0,00 | 4 | −25,00 | ||||
| 2025-07-08 | 13F | Arlington Trust Co LLC | 6 250 | 0,00 | 82 | −14,74 | ||||
| 2025-08-12 | 13F | Bokf, Na | 0 | −100,00 | 0 | |||||
| 2025-08-12 | 13F | Hill Investment Group Partners, LLC | 177 487 | 0,00 | 2 322 | −14,35 | ||||
| 2025-07-11 | 13F | Diversified Trust Co | 16 787 | 0,00 | 220 | −14,45 | ||||
| 2025-08-14 | 13F | MIRAE ASSET GLOBAL ETFS HOLDINGS Ltd. | 963 313 | 5,45 | 12 600 | −9,67 | ||||
| 2025-08-11 | 13F | Citigroup Inc | 255 007 | 53,63 | 3 335 | 31,61 | ||||
| 2025-08-13 | 13F | Fort Sheridan Advisors Llc | 36 540 | −34,36 | 478 | −43,88 | ||||
| 2025-08-13 | 13F | First Trust Advisors Lp | 333 834 | −11,33 | 4 367 | −24,06 | ||||
| 2025-07-30 | 13F/A | Alpha Wealth Funds, LLC | 11 200 | −20,00 | 146 | −31,46 | ||||
| 2025-06-26 | NP | HMSFX - Hennessy BP Midstream Fund Investor Class | 25 000 | 353 | ||||||
| 2025-05-12 | 13F | Linscomb & Williams, Inc. | 0 | −100,00 | 0 | −100,00 | ||||
| 2025-07-28 | 13F | Cypress Wealth Services, LLC | 21 437 | 0,00 | 280 | −14,37 | ||||
| 2025-07-30 | NP | ALTY - Global X SuperDividend Alternatives ETF This fund is a listed as child fund of Mirae Asset Global Investments Co., Ltd. and if that institution has disclosed ownership in this security, then these positions will not be double counted when calculating total shares and total value | 29 184 | 3,55 | 390 | −7,60 |