Grunnleggende statistikk
| Institusjonelle eiere | 387 total, 346 long only, 8 short only, 33 long/short - change of −2,27% MRQ |
| Gjennomsnittlig porteføljeallokering | 0.2525 % - change of −13,63% MRQ |
| Institusjonelle aksjer (Long) | 28 907 665 (ex 13D/G) - change of 4,03MM shares 16,21% MRQ |
| Institusjonell verdi (Long) | $ 3 244 297 USD ($1000) |
Institusjonelt eierskap og aksjonærer
SPDR Series Trust - SPDR S&P Oil & Gas Exploration & Production ETF (US:XOP) har 387 institusjonelle eiere og aksjonærer som har sendt inn 13D/G- eller 13F-skjemaer til Securities Exchange Commission (SEC). Disse institusjonene eier til sammen 28,915,025 aksjer. De største aksjonærene inkluderer Goldman Sachs Group Inc, Susquehanna International Group, Llp, Healthcare Of Ontario Pension Plan Trust Fund, Bank Of America Corp /de/, Jpmorgan Chase & Co, Morgan Stanley, Citigroup Inc, Jane Street Group, Llc, Susquehanna International Group, Llp, and UBS Group AG .
SPDR Series Trust - SPDR S&P Oil & Gas Exploration & Production ETF (ARCA:XOP) institusjonell eierstruktur viser nåværende posisjoner i selskapet fordelt på institusjoner og fond, samt de siste endringene i posisjonsstørrelse. De største aksjonærene kan være individuelle investorer, verdipapirfond, hedgefond eller institusjoner. Schedule 13D indikerer at investoren eier (eller har eid) mer enn 5 % av selskapet og har til hensikt (eller hadde til hensikt) å aktivt forfølge en endring i forretningsstrategien. Schedule 13G indikerer en passiv investering på over 5 %.
The share price as of September 11, 2025 is 131,37 / share. Previously, on September 12, 2024, the share price was 127,25 / share. This represents an increase of 3,24% over that period.

Fondssentiment-score
Fondssentiment Score (også kjent som akkumulering av eierskap poengsum) viser hvilke aksjer som er mest kjøpt av fond. Den er resultatet av en sofistikert, kvantitativ flerfaktormodell som identifiserer selskaper med de høyeste nivåene av institusjonell akkumulering. Beregningsmodellen for poeng bruker en kombinasjon av den totale økningen i antall offentliggjorte eiere, endringer i porteføljeallokeringen til disse eierne og andre beregninger. Tallet går fra 0 til 100, der høyere tall indikerer en høyere grad av akkumulering i forhold til sammenlignbare selskaper, der 50 er gjennomsnittet.
Oppdateringsfrekvens: Daglig
Sjekk ut Ownership Explorer, som inneholder en liste over de høyest rangerte selskapene.
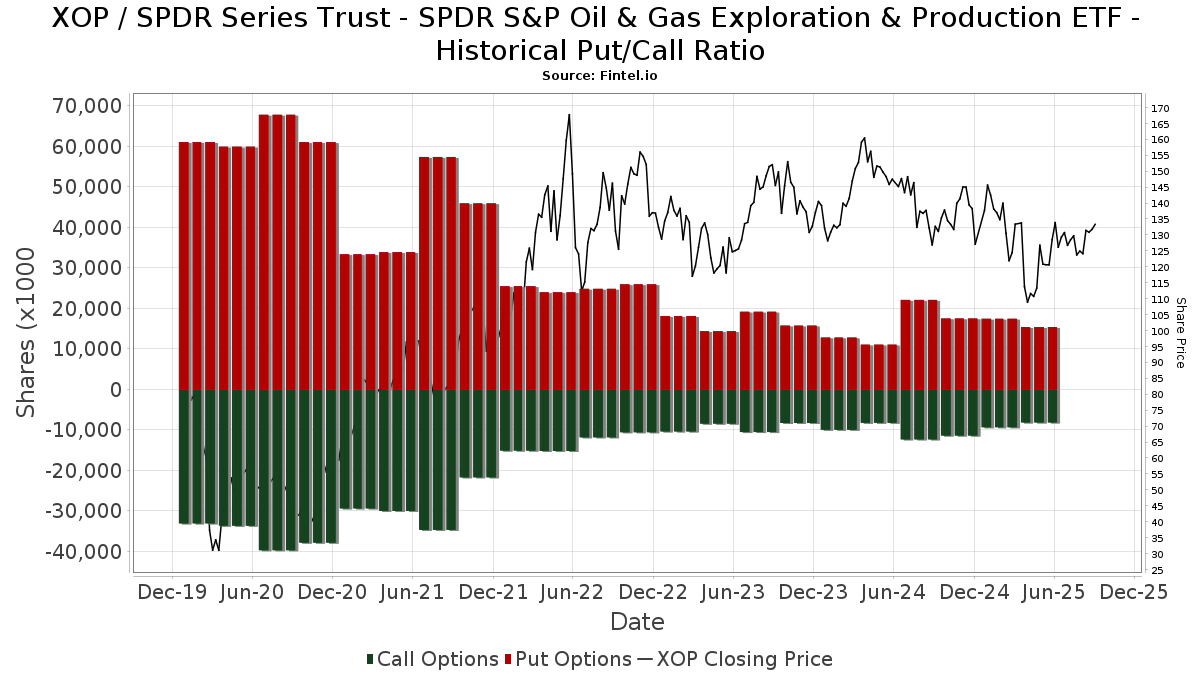
Institusjonell Put/Call-forhold
I tillegg til å rapportere standard aksje- og gjeldsemisjoner må institusjoner med mer enn 100 millioner kroner i forvaltningskapital også oppgi beholdningen av put- og callopsjoner. Siden put-opsjoner generelt indikerer et negativt sentiment, og call-opsjoner indikerer et positivt sentiment, kan vi få et inntrykk av det generelle institusjonelle sentimentet ved å plotte forholdet mellom put- og call-opsjoner. Diagrammet til høyre viser det historiske forholdet mellom put- og call-opsjoner for dette instrumentet.
Ved å bruke Put/Call-forholdet som en indikator på investorsentimentet kan man overvinne en av de viktigste svakhetene ved å bruke totalt institusjonelt eierskap, nemlig at en betydelig andel av forvaltningskapitalen investeres passivt for å følge indekser. Passivt forvaltede fond kjøper vanligvis ikke opsjoner, slik at indikatoren for put/call-forhold i større grad gjenspeiler stemningen i aktivt forvaltede fond.
13D/G-arkiveringer
Vi presenterer 13D/G-arkiveringene separat fra 13F-arkiveringene fordi de behandles forskjellig av SEC. 13D/G-arkiveringene kan sendes inn av grupper av investorer (med én leder), mens 13D/G-arkiveringene ikke kan sendes inn. Dette fører til situasjoner der en investor kan sende inn en 13D/G-rapport med én verdi for alle aksjene (som representerer alle aksjene som eies av investorgruppen), men deretter sende inn en 13F-melding med en annen verdi for alle aksjene (som kun representerer deres eget eierskap). Dette betyr at aksjeeierskap i 13D/G-arkiveringene og 13F-arkiveringene ofte ikke er direkte sammenlignbare, og vi presenterer dem derfor separat.
Merk: Fra og med 16. mai 2021 viser vi ikke lenger eiere som ikke har sendt inn en 13D/G i løpet av det siste året. Tidligere viste vi hele historikken for 13D/G-arkiveringer. Generelt må enheter som er pålagt å sende inn 13D/G-arkiveringer, sende inn minst én gang i året før de sender inn en avsluttende rapport. Det hender imidlertid at fond trekker seg ut av posisjoner uten å sende inn en avsluttende innlevering (dvs. at de avvikler), slik at visning av hele historikken av og til fører til forvirring om det nåværende eierskapet. For å unngå forvirring viser vi nå bare "nåværende" eiere, det vil si eiere som har sendt inn informasjon i løpet av det siste året.
Upgrade to unlock premium data.
| Fildato | Skjema | Investor | Tidligere aksjer |
Siste aksjer |
Δ Aksjer (prosent) |
Eierandel (prosent) |
Δ Eierandel (prosent) |
|
|---|---|---|---|---|---|---|---|---|
| 2024-10-07 | BlackRock, Inc. | 400,000 | 2.00 |
13F- og NPORT-arkiveringer
Detaljer om 13F-arkiveringer er gratis. Detaljer om NP-arkiveringer krever et premium-medlemskap. Grønne rader indikerer nye posisjoner. Røde rader indikerer lukkede posisjoner. Klikk på lenke ikonet for å se hele transaksjonshistorikken.
Oppgrader
for å låse opp premiedata og eksportere til Excel. ![]() .
.
| Fildato | Kilde | Investor | Type | Gjennomsnittlig pris (estimert) |
Aksjer | Δ Aksjer (%) |
Rapportert verdi ($1000) | Verdi (%) | Portallokering (%) | |
|---|---|---|---|---|---|---|---|---|---|---|
| 2025-08-14 | 13F | Hrt Financial Lp | 12 292 | −69,29 | 2 | −80,00 | ||||
| 2025-05-13 | 13F | Heck Capital Advisors, LLC | 0 | −100,00 | 0 | −100,00 | ||||
| 2025-08-28 | NP | RQEAX - RESQ Dynamic Allocation Fund RESQ Dynamic Allocation Class A Shares | 13 800 | 0,00 | 1 736 | −4,46 | ||||
| 2025-07-21 | 13F | Vanderbilt University | 357 073 | 0,61 | 44 920 | −3,90 | ||||
| 2025-05-14 | 13F | Caitlin John, LLC | 0 | −100,00 | 0 | |||||
| 2025-08-14 | 13F | Graham Capital Management, L.P. | 23 950 | 432,22 | 3 013 | 408,78 | ||||
| 2025-08-14 | 13F | Qube Research & Technologies Ltd | 7 367 | 1 641,61 | 927 | 1 583,64 | ||||
| 2025-08-04 | 13F | Creekmur Asset Management LLC | 226 | 0,00 | 28 | −3,45 | ||||
| 2025-07-11 | 13F | Shelton Wealth Management, Llc | 4 353 | −15,59 | 548 | −19,44 | ||||
| 2025-08-14 | 13F | Ancora Advisors, LLC | 600 | 0,00 | 75 | −5,06 | ||||
| 2025-08-13 | 13F | GeoWealth Management, LLC | 0 | −100,00 | 0 | |||||
| 2025-07-21 | 13F | Crews Bank & Trust | 119 | 0,00 | 15 | −6,67 | ||||
| 2025-05-02 | 13F | Fortis Group Advisors, LLC | 0 | −100,00 | 0 | |||||
| 2025-08-08 | 13F | Gts Securities Llc | 56 264 | 7 078 | ||||||
| 2025-05-01 | 13F | Caas Capital Management Lp | Put | 1 700 | 224 | |||||
| 2025-05-14 | 13F | Stonehage Fleming Financial Services Holdings Ltd | 0 | −100,00 | 0 | |||||
| 2025-08-01 | 13F | Chilton Capital Management Llc | 168 | 24,44 | 21 | 23,53 | ||||
| 2025-08-14 | 13F | Royal Bank Of Canada | 372 602 | 70,77 | 46 874 | 63,10 | ||||
| 2025-07-16 | 13F | One + One Wealth Management, Llc | 20 588 | −7,15 | 2 590 | −11,34 | ||||
| 2025-07-17 | 13F | HB Wealth Management, LLC | 9 968 | 1 254 | ||||||
| 2025-08-14 | 13F | Royal Bank Of Canada | Put | 110 200 | 980,39 | 13 863 | 932,24 | |||
| 2025-07-22 | 13F | IMC-Chicago, LLC | 20 969 | 2 638 | ||||||
| 2025-07-23 | 13F | Sunbeam Capital Management, LLC | 2 029 | 0,05 | 255 | −4,49 | ||||
| 2025-08-14 | 13F | Wealth Preservation Advisors, LLC | 0 | −100,00 | 0 | |||||
| 2025-08-26 | 13F/A | Thrivent Financial For Lutherans | 5 495 | −93,57 | 1 | −100,00 | ||||
| 2025-05-15 | 13F | BlueCrest Capital Management Ltd | 0 | −100,00 | 0 | |||||
| 2025-08-14 | 13F | Man Group plc | Put | 0 | −100,00 | 0 | ||||
| 2025-08-14 | 13F | BCS Private Wealth Management, Inc. | 2 000 | 0 | ||||||
| 2025-08-14 | 13F | Soros Fund Management Llc | Put | 0 | −100,00 | 0 | ||||
| 2025-07-28 | 13F | Kiker Wealth Management, LLC | 70 | 0,00 | 9 | −11,11 | ||||
| 2025-08-04 | 13F | Roble, Belko & Company, Inc | 52 | 0 | ||||||
| 2025-08-14 | 13F | SoftVest Advisors, LLC | Call | 450 000 | 0,00 | 56 610 | −4,49 | |||
| 2025-05-28 | NP | THRIVENT SERIES FUND INC - Thrivent Moderately Conservative Allocation Portfolio Class A | 723 | 0,00 | 95 | 0,00 | ||||
| 2025-07-24 | 13F | IFP Advisors, Inc | 63 | 50,00 | 8 | 40,00 | ||||
| 2025-08-11 | 13F | TD Waterhouse Canada Inc. | 149 | 204,08 | 19 | 200,00 | ||||
| 2025-07-16 | 13F | Signaturefd, Llc | 713 | 0,00 | 90 | −4,30 | ||||
| 2025-08-08 | 13F | Avantax Advisory Services, Inc. | 2 284 | 287 | ||||||
| 2025-08-13 | 13F | Walleye Capital LLC | Call | 8 300 | 0,00 | 1 044 | −4,48 | |||
| 2025-08-13 | 13F | Walleye Capital LLC | Put | 31 600 | 0,00 | 3 975 | −4,49 | |||
| 2025-08-13 | 13F | Natixis | 3 591 | 1 963,79 | 452 | 1 950,00 | ||||
| 2025-08-13 | 13F | EverSource Wealth Advisors, LLC | 1 744 | 0,00 | 219 | −4,37 | ||||
| 2025-08-14 | 13F | Jain Global LLC | 48 000 | 223,91 | 6 038 | 209,48 | ||||
| 2025-08-13 | 13F | Walleye Capital LLC | 634 | 80 | ||||||
| 2025-08-14 | 13F | AYAL Capital Advisors Ltd | Put | 0 | −100,00 | 0 | ||||
| 2025-08-14 | 13F | Jain Global LLC | Call | 10 000 | 1 258 | |||||
| 2025-08-14 | 13F | Jain Global LLC | Put | 10 000 | 1 258 | |||||
| 2025-05-09 | 13F | Fairfield Financial Advisors, LTD | 0 | −100,00 | 0 | |||||
| 2025-07-29 | 13F | Harbor Asset Planning, Inc. | 4 | 1 | ||||||
| 2025-08-05 | 13F | Harel Insurance Investments & Financial Services Ltd. | 0 | −100,00 | 0 | |||||
| 2025-08-14 | 13F | Bank Of America Corp /de/ | Put | 668 800 | 314,89 | 84 135 | 296,28 | |||
| 2025-08-14 | 13F | Bank Of America Corp /de/ | Call | 183 500 | 46,80 | 23 084 | 40,22 | |||
| 2025-08-14 | 13F | Bank Of America Corp /de/ | 3 060 372 | 78,87 | 384 995 | 70,84 | ||||
| 2025-08-14 | 13F | Transamerica Financial Advisors, Inc. | 4 716 | −1,36 | 593 | |||||
| 2025-08-14 | 13F | Colony Group, LLC | 7 829 | −21,51 | 985 | −25,06 | ||||
| 2025-05-14 | 13F | OMERS ADMINISTRATION Corp | 0 | −100,00 | 0 | |||||
| 2025-07-09 | 13F | Fermata Advisors, LLC | 0 | −100,00 | 0 | |||||
| 2025-08-15 | 13F | Kestra Advisory Services, LLC | 4 414 | −8,21 | 555 | −12,32 | ||||
| 2025-05-15 | 13F | Paloma Partners Management Co | 0 | −100,00 | 0 | |||||
| 2025-08-01 | 13F | Rossby Financial, LCC | 2 647 | 0,04 | 333 | 11,00 | ||||
| 2025-07-09 | 13F | Krilogy Financial LLC | 40 375 | 4,59 | 5 079 | −0,10 | ||||
| 2025-08-08 | 13F | Paragon Capital Management LLC | 6 459 | −4,42 | 813 | −8,76 | ||||
| 2025-08-06 | 13F | Mascagni Wealth Management, Inc. | 1 957 | 0,00 | 246 | −4,28 | ||||
| 2025-08-12 | 13F | Steward Partners Investment Advisory, Llc | 2 477 | 2,23 | 312 | −2,51 | ||||
| 2025-08-08 | 13F | Creative Planning | 3 495 | −3,96 | 440 | −8,35 | ||||
| 2025-08-04 | 13F | Creative Financial Designs Inc /adv | 0 | −100,00 | 0 | |||||
| 2025-08-01 | 13F | Bessemer Group Inc | 511 340 | −0,22 | 64 | −4,48 | ||||
| 2025-08-13 | 13F | Argyle Capital Partners, LLC | 1 662 | 209 | ||||||
| 2025-08-14 | 13F | Frisch Financial Group, Inc. | 22 410 | −46,76 | 3 | −60,00 | ||||
| 2025-04-23 | 13F | Oppenheimer & Co Inc | 0 | −100,00 | 0 | |||||
| 2025-08-11 | 13F | Sierra Capital LLC | 0 | −100,00 | 0 | |||||
| 2025-08-13 | 13F | D L Carlson Investment Group Inc | 2 273 | −47,11 | 286 | −49,65 | ||||
| 2025-08-14 | 13F | Jane Street Group, Llc | Put | 1 636 900 | 56,51 | 205 922 | 49,48 | |||
| 2025-08-14 | 13F | Integrated Wealth Concepts LLC | 13 410 | −19,09 | 1 687 | −22,69 | ||||
| 2025-05-15 | 13F | Royal Bank Of Canada | Call | 0 | −100,00 | 0 | −100,00 | |||
| 2025-08-14 | 13F | Jane Street Group, Llc | Call | 542 400 | −63,17 | 68 234 | −64,83 | |||
| 2025-07-28 | 13F | Allianz Asset Management GmbH | Put | 178 300 | 8,00 | 22 430 | 3,15 | |||
| 2025-08-11 | 13F | Aptus Capital Advisors, LLC | 937 | 0,21 | 118 | −4,88 | ||||
| 2025-08-14 | 13F | Daiwa Securities Group Inc. | 1 825 | 0,00 | 0 | |||||
| 2025-08-13 | 13F | Quantbot Technologies LP | 5 290 | 665 | ||||||
| 2025-08-12 | 13F | Jpmorgan Chase & Co | 2 975 222 | 280,02 | 374 283 | 262,97 | ||||
| 2025-05-15 | 13F | Pickering Energy Partners Lp | 0 | −100,00 | 0 | |||||
| 2025-04-28 | 13F | Strategic Financial Concepts, LLC | 0 | −100,00 | 0 | −100,00 | ||||
| 2025-05-09 | 13F | Cary Street Partners Financial Llc | 0 | −100,00 | 0 | |||||
| 2025-08-12 | 13F | SRS Capital Advisors, Inc. | 79 | −28,83 | 10 | −35,71 | ||||
| 2025-05-15 | 13F | Moore Capital Management, Lp | Call | 0 | −100,00 | 0 | ||||
| 2025-08-14 | 13F | Van Den Berg Management I, Inc | 3 780 | −4,95 | 475 | −9,18 | ||||
| 2025-08-08 | 13F | Your Advocates Ltd., LLP | 222 | 0,00 | 28 | −6,90 | ||||
| 2025-08-14 | 13F | Scopus Asset Management, L.p. | Put | 246 000 | 146,00 | 30 947 | 134,96 | |||
| 2025-08-14 | 13F | Quarry LP | 4 000 | 503 | ||||||
| 2025-08-14 | 13F | Emmett Investment Management, LP | 0 | −100,00 | 0 | |||||
| 2025-08-14 | 13F | Aqr Capital Management Llc | 3 292 | 0,00 | 414 | −4,39 | ||||
| 2025-08-06 | 13F | Hallmark Capital Management Inc | 279 | −54,71 | 35 | −56,79 | ||||
| 2025-05-14 | 13F | SPX Equities Gestao de Recursos Ltda | 0 | −100,00 | 0 | |||||
| 2025-07-15 | 13F | Heritage Oak Wealth Advisors Llc | 15 798 | 0,43 | 1 987 | −4,06 | ||||
| 2025-08-14 | 13F | Volterra Technologies LP | Put | 800 | 101 | |||||
| 2025-05-15 | 13F | Centiva Capital, LP | Call | 0 | −100,00 | 0 | ||||
| 2025-08-14 | 13F | Volterra Technologies LP | Call | 12 800 | 1 610 | |||||
| 2025-07-17 | 13F | Venture Visionary Partners LLC | 13 500 | 93,22 | 1 698 | 84,57 | ||||
| 2025-07-31 | 13F | Carrera Capital Advisors | 14 373 | 10,66 | 1 808 | 5,73 | ||||
| 2025-05-15 | 13F | StoneX Group Inc. | 0 | −100,00 | 0 | −100,00 | ||||
| 2025-07-21 | 13F | Mirae Asset Global Investments Co., Ltd. | 9 750 | 29,14 | 1 227 | 24,34 | ||||
| 2025-05-06 | 13F | Guild Investment Management, Inc. | 0 | −100,00 | 0 | |||||
| 2025-08-11 | 13F | Capital Square, LLC | 3 071 | −5,97 | 409 | −5,12 | ||||
| 2025-08-11 | 13F | Greenland Capital Management LP | 0 | −100,00 | 0 | |||||
| 2025-07-16 | 13F | Octavia Wealth Advisors, LLC | 2 212 | −18,23 | 278 | −21,91 | ||||
| 2025-08-11 | 13F | Hexagon Capital Partners LLC | 0 | −100,00 | 0 | |||||
| 2025-08-14 | 13F | Silvercrest Asset Management Group Llc | 12 265 | −6,02 | 1 543 | −10,24 | ||||
| 2025-07-17 | 13F | ERn Financial, LLC | 0 | −100,00 | 0 | |||||
| 2025-08-14 | 13F | GWM Advisors LLC | 2 593 | −59,44 | 326 | −61,28 | ||||
| 2025-05-15 | 13F | EHP Funds Inc. | 0 | −100,00 | 0 | |||||
| 2025-07-31 | 13F | Waldron Private Wealth LLC | 3 247 | 32,86 | 409 | 27,10 | ||||
| 2025-08-14 | 13F | Polymer Capital Management (US) LLC | Call | 15 000 | 1 887 | |||||
| 2025-05-28 | NP | THRIVENT SERIES FUND INC - Thrivent Moderately Aggressive Allocation Portfolio Class A | 2 457 | 0,00 | 324 | −0,62 | ||||
| 2025-08-14 | 13F | Stifel Financial Corp | 29 398 | −13,80 | 3 698 | −17,66 | ||||
| 2025-08-13 | 13F | Botty Investors LLC | 24 933 | 0,00 | 3 137 | −4,48 | ||||
| 2025-05-15 | 13F | Toronto Dominion Bank | Call | 0 | −100,00 | 0 | −100,00 | |||
| 2025-08-01 | 13F | Envestnet Asset Management Inc | 18 795 | 11,33 | 2 364 | 6,34 | ||||
| 2025-08-05 | 13F | W.G. Shaheen & Associates DBA Whitney & Co | 52 694 | 6 629 | ||||||
| 2025-08-13 | 13F | Healthcare Of Ontario Pension Plan Trust Fund | 3 230 000 | 20,52 | 406 334 | 15,11 | ||||
| 2025-07-08 | 13F | Mirabaud & Cie SA | 5 000 | 0,00 | 629 | −4,41 | ||||
| 2025-07-11 | 13F | Farther Finance Advisors, LLC | 1 096 | 1,95 | 138 | −3,52 | ||||
| 2025-08-12 | 13F | AlphaCore Capital LLC | 171 | 22 | ||||||
| 2025-07-10 | 13F | Oliver Lagore Vanvalin Investment Group | 0 | −100,00 | 0 | |||||
| 2025-08-14 | 13F | Headlands Technologies LLC | 1 277 | 102,38 | 161 | 92,77 | ||||
| 2025-07-28 | 13F | Twin Tree Management, LP | Call | 78 400 | 9 863 | |||||
| 2025-07-28 | 13F | Twin Tree Management, LP | 123 964 | 597,25 | 15 595 | 566,13 | ||||
| 2025-08-11 | 13F | Private Advisor Group, LLC | 6 074 | −30,23 | 764 | −33,33 | ||||
| 2025-08-15 | 13F | Caz Investments Lp | 15 000 | 1 887 | ||||||
| 2025-08-14 | 13F | Jane Street Group, Llc | 204 648 | 25 745 | ||||||
| 2025-08-14 | 13F | Two Sigma Securities, Llc | 19 606 | −35,27 | 2 466 | −38,18 | ||||
| 2025-04-30 | 13F | Sofos Investments, Inc. | 219 | 2 637,50 | 29 | 2 700,00 | ||||
| 2025-08-04 | 13F | HBK Sorce Advisory LLC | 11 855 | −1,04 | 1 491 | −5,45 | ||||
| 2025-05-14 | 13F | Ieq Capital, Llc | 0 | −100,00 | 0 | |||||
| 2025-08-14 | 13F | Federation des caisses Desjardins du Quebec | 1 450 | 1 350,00 | 182 | 1 300,00 | ||||
| 2025-08-04 | 13F | Pensionmark Financial Group, Llc | 6 314 | −18,15 | 794 | −21,77 | ||||
| 2025-08-05 | 13F | Carolinas Wealth Consulting Llc | 0 | −100,00 | 0 | −100,00 | ||||
| 2025-08-14 | 13F | Point72 Asset Management, L.P. | Put | 69 900 | 8 793 | |||||
| 2025-08-14 | 13F | Point72 Asset Management, L.P. | Call | 19 900 | 2 503 | |||||
| 2025-08-05 | 13F | Simplex Trading, Llc | 0 | −100,00 | 0 | |||||
| 2025-08-14 | 13F | Man Group plc | Call | 0 | −100,00 | 0 | ||||
| 2025-08-14 | 13F | Whitebox Advisors Llc | Put | 150 000 | −57,14 | 18 870 | −59,07 | |||
| 2025-07-08 | 13F | Parallel Advisors, LLC | 2 369 | 0,00 | 298 | −4,49 | ||||
| 2025-07-22 | 13F | Appleton Partners Inc/ma | 9 553 | −8,25 | 1 | 0,00 | ||||
| 2025-08-14 | 13F | Whitebox Advisors Llc | 32 903 | 4 139 | ||||||
| 2025-05-15 | 13F | Arosa Capital Management LP | Call | 0 | −100,00 | 0 | ||||
| 2025-03-27 | NP | TCAAX - Thrivent Moderately Conservative Allocation Fund Class A | 182 | 24 | ||||||
| 2025-08-14 | 13F | Aristeia Capital Llc | Put | 618 600 | −2,83 | 77 820 | −7,19 | |||
| 2025-07-28 | 13F | Pettinga Financial Advisors, LLC | 15 567 | −1,42 | 1 958 | −5,82 | ||||
| 2025-08-13 | 13F | Fisher Asset Management, LLC | 11 379 | 8,32 | 1 431 | 3,47 | ||||
| 2025-08-14 | 13F | LMR Partners LLP | Put | 0 | −100,00 | 0 | ||||
| 2025-08-12 | 13F | J.w. Cole Advisors, Inc. | 8 092 | 1 018 | ||||||
| 2025-08-12 | 13F | Twin Focus Capital Partners, Llc | 2 523 | −16,04 | 317 | −19,75 | ||||
| 2025-08-14 | 13F | Group One Trading, L.p. | 55 202 | 6 944 | ||||||
| 2025-08-06 | 13F | Commonwealth Equity Services, Llc | 27 816 | −2,05 | 3 | 0,00 | ||||
| 2025-07-23 | 13F | Gainplan LLC | 6 032 | −43,57 | 759 | −46,13 | ||||
| 2025-07-07 | 13F | Modus Advisors, LLC | 42 700 | −1,49 | 5 372 | −5,90 | ||||
| 2025-08-08 | 13F | Banco Bilbao Vizcaya Argentaria, S.a. | 12 523 | −14,03 | 1 588 | −17,42 | ||||
| 2025-08-12 | 13F | Proequities, Inc. | 0 | 0 | ||||||
| 2025-08-06 | 13F | Pekin Hardy Strauss, Inc. | 3 760 | 23,64 | 473 | 18,25 | ||||
| 2025-07-29 | 13F | TrueMark Investments, LLC | 0 | −100,00 | 0 | |||||
| 2025-08-13 | 13F | VestGen Advisors, LLC | 3 206 | −36,93 | 403 | −39,76 | ||||
| 2025-08-14 | 13F | SummitTX Capital, L.P. | 7 942 | 999 | ||||||
| 2025-07-28 | 13F | Private Wealth Asset Management, LLC | 1 582 | 0,00 | 199 | −4,33 | ||||
| 2025-05-14 | 13F | Summit Financial, LLC | 0 | −100,00 | 0 | |||||
| 2025-08-14 | 13F | DRW Securities, LLC | Put | 0 | −100,00 | 0 | −100,00 | |||
| 2025-08-14 | 13F | Evercore Wealth Management, LLC | 12 968 | −0,31 | 1 631 | −4,79 | ||||
| 2025-05-15 | 13F | Gendell Jeffrey L | 0 | −100,00 | 0 | |||||
| 2025-07-23 | 13F | Vontobel Holding Ltd. | 4 792 | 14,83 | 603 | 9,65 | ||||
| 2025-07-18 | 13F | Founders Capital Management | 252 | 0,00 | 32 | −6,06 | ||||
| 2025-08-14 | 13F | Glen Eagle Advisors, LLC | 2 240 | 0,04 | 282 | −4,42 | ||||
| 2025-08-13 | 13F | Cerity Partners LLC | 11 355 | 24,17 | 1 428 | 18,60 | ||||
| 2025-05-13 | 13F | Fca Corp /tx | 0 | −100,00 | 0 | |||||
| 2025-07-14 | 13F | AdvisorNet Financial, Inc | 1 145 | −20,76 | 144 | −24,21 | ||||
| 2025-08-11 | 13F | First American Trust, Fsb | 0 | −100,00 | 0 | |||||
| 2025-08-08 | 13F | SG Americas Securities, LLC | 28 413 | −10,76 | 4 | −25,00 | ||||
| 2025-08-13 | 13F | Quadrature Capital Ltd | 93 001 | 730,74 | 11 700 | 693,69 | ||||
| 2025-08-13 | 13F | Capital Fund Management S.a. | Put | 48 100 | −75,31 | 6 051 | −76,42 | |||
| 2025-05-28 | NP | THRIVENT SERIES FUND INC - Thrivent Mid Cap Growth Portfolio Class A | 1 340 | 0,00 | 176 | −0,56 | ||||
| 2025-08-14 | 13F | Kovitz Investment Group Partners, LLC | 1 687 | 212 | ||||||
| 2025-08-12 | 13F | Jaffetilchin Investment Partners, LLC | 21 151 | −12,71 | 2 661 | −16,64 | ||||
| 2025-08-12 | 13F | Argent Trust Co | 5 828 | 0,00 | 733 | −4,43 | ||||
| 2025-08-11 | 13F | Brown Brothers Harriman & Co | 870 | −21,97 | 109 | −25,34 | ||||
| 2025-07-14 | 13F | U.S. Capital Wealth Advisors, LLC | 5 602 | −59,50 | 705 | −61,34 | ||||
| 2025-08-07 | 13F/A | Credit Industriel Et Commercial | 25 267 | 468,69 | 3 179 | 443,25 | ||||
| 2025-03-21 | NP | PASIX - PACE Alternative Strategies Investments Class A | Short | −343 | −46 | |||||
| 2025-07-09 | 13F | Massmutual Trust Co Fsb/adv | 300 | 38 | ||||||
| 2025-03-27 | NP | AALGX - Thrivent Global Stock Fund Class A | 1 383 | −20,79 | 186 | −27,45 | ||||
| 2025-08-07 | 13F/A | Credit Industriel Et Commercial | Put | 80 000 | 300,00 | 10 064 | 282,08 | |||
| 2025-08-13 | 13F | Twin Peaks Wealth Advisors, LLC | 70 | 9 | ||||||
| 2025-08-14 | 13F | Atom Investors LP | 45 217 | 287,10 | 5 688 | 269,83 | ||||
| 2025-08-14 | 13F | Alaska Permanent Fund Corp | 0 | −100,00 | 0 | |||||
| 2025-07-17 | 13F | SeaBridge Investment Advisors LLC | 2 945 | 0,00 | 370 | −4,39 | ||||
| 2025-08-12 | 13F | Nemes Rush Group LLC | 3 | 0,00 | 0 | |||||
| 2025-05-12 | 13F | Providence First Trust Co | 0 | −100,00 | 0 | |||||
| 2025-08-11 | 13F | Pin Oak Investment Advisors Inc | 135 | 0,00 | 0 | |||||
| 2025-05-09 | 13F | Belvedere Trading LLC | 0 | −100,00 | 0 | |||||
| 2025-08-14 | 13F | Cinctive Capital Management LP | 0 | −100,00 | 0 | |||||
| 2025-08-14 | 13F | Capstone Investment Advisors, Llc | 51 523 | 6 482 | ||||||
| 2025-07-30 | 13F | Whittier Trust Co | 1 060 | 0,00 | 133 | −4,32 | ||||
| 2025-08-14 | 13F | Holt Capital Advisors, L.L.C. dba Holt Capital Partners, L.P. | 3 782 | −29,96 | 476 | −33,19 | ||||
| 2025-04-10 | 13F | Maltin Wealth Management, Inc. | 0 | −100,00 | 0 | |||||
| 2025-08-14 | 13F | Capstone Investment Advisors, Llc | Call | 336 000 | −51,09 | 42 269 | −53,29 | |||
| 2025-05-20 | 13F | Belpointe Asset Management LLC | 0 | −100,00 | 0 | |||||
| 2025-08-14 | 13F | Capstone Investment Advisors, Llc | Put | 547 200 | −27,57 | 68 838 | −30,82 | |||
| 2025-08-15 | 13F | Morgan Stanley | 2 619 495 | −11,25 | 329 533 | −15,23 | ||||
| 2025-05-14 | 13F | GM Advisory Group, Inc. | 0 | −100,00 | 0 | |||||
| 2025-08-12 | 13F | Howe & Rusling Inc | 35 | 0,00 | 4 | 0,00 | ||||
| 2025-08-08 | 13F | Skylands Capital, LLC | 43 815 | −6,83 | 5 512 | −11,01 | ||||
| 2025-08-14 | 13F | Verition Fund Management LLC | 2 318 | 292 | ||||||
| 2025-07-30 | NP | EMPB - Efficient Market Portfolio Plus ETF | Short | −7 017 | 41,36 | −839 | 29,12 | |||
| 2025-08-05 | 13F | Westside Investment Management, Inc. | 200 | 0,00 | 25 | −3,85 | ||||
| 2025-08-14 | 13F | Crestmont Private Wealth LLC | 1 856 | −2,52 | 234 | −6,80 | ||||
| 2025-07-25 | 13F | We Are One Seven, LLC | 5 070 | 1,18 | 638 | −3,34 | ||||
| 2025-08-15 | 13F | Equitable Holdings, Inc. | 1 903 | −18,01 | 239 | −21,64 | ||||
| 2025-09-04 | 13F/A | Advisor Group Holdings, Inc. | 18 262 | −14,17 | 2 300 | −17,98 | ||||
| 2025-08-08 | 13F | Fiduciary Counselling Inc | 2 022 | 0,00 | 254 | −4,51 | ||||
| 2025-08-06 | 13F | Savant Capital, LLC | 5 279 | 0,00 | 664 | −4,46 | ||||
| 2025-08-14 | 13F | Citadel Advisors Llc | Call | 682 700 | −16,76 | 85 884 | −20,50 | |||
| 2025-08-13 | 13F | Edgestream Partners, L.P. | 0 | −100,00 | 0 | |||||
| 2025-08-14 | 13F | Citadel Advisors Llc | 301 167 | 127,11 | 37 887 | 116,91 | ||||
| 2025-05-15 | 13F | Advisory Services Network, LLC | 0 | −100,00 | 0 | |||||
| 2025-08-14 | 13F | Citadel Advisors Llc | Put | 1 052 400 | −25,82 | 132 392 | −29,15 | |||
| 2025-07-16 | 13F/A | CX Institutional | 3 105 | 0 | ||||||
| 2025-08-12 | 13F | Insigneo Advisory Services, Llc | 1 885 | 0,59 | 237 | −3,66 | ||||
| 2025-08-12 | 13F | Eisler Capital Management Ltd. | Call | 0 | −100,00 | 0 | −100,00 | |||
| 2025-08-08 | 13F | Itau Unibanco Holding S.A. | 0 | −100,00 | 0 | |||||
| 2025-04-21 | 13F | Ronald Blue Trust, Inc. | 0 | −100,00 | 0 | |||||
| 2025-08-14 | 13F | Quantinno Capital Management LP | 4 895 | −6,83 | 616 | −11,13 | ||||
| 2025-08-04 | 13F | Assetmark, Inc | 92 | 0,00 | 12 | −8,33 | ||||
| 2025-07-07 | 13F | Insight Wealth Strategies, LLC | 1 720 | −97,83 | 218 | −97,91 | ||||
| 2025-08-12 | 13F | O'shaughnessy Asset Management, Llc | 288 | −33,49 | 36 | −36,84 | ||||
| 2025-08-14 | 13F | Lombard Odier Asset Management (USA) Corp | 29 000 | 11,54 | 3 648 | 6,54 | ||||
| 2025-07-28 | 13F | Copia Wealth Management | 375 | 476,92 | 47 | 487,50 | ||||
| 2025-08-05 | 13F | EPG Wealth Management LLC | 500 | 0,00 | 63 | −4,62 | ||||
| 2025-08-14 | 13F | Lombard Odier Asset Management (USA) Corp | Put | 400 000 | −20,00 | 50 320 | −23,59 | |||
| 2025-08-15 | 13F | Captrust Financial Advisors | 4 235 | 11,01 | 533 | 5,98 | ||||
| 2025-04-17 | 13F | Life Planning Partners, Inc | 0 | −100,00 | 0 | −100,00 | ||||
| 2025-05-15 | 13F/A | Weiss Asset Management LP | 0 | −100,00 | 0 | |||||
| 2025-08-11 | 13F | Insight 2811, Inc. | 1 949 | 0,00 | 245 | −4,30 | ||||
| 2025-08-08 | 13F | Kingsview Wealth Management, LLC | 5 690 | 716 | ||||||
| 2025-07-30 | 13F | Strategic Blueprint, LLC | 2 250 | −1,01 | 283 | −5,35 | ||||
| 2025-08-12 | 13F | Clear Street Markets Llc | 100 | 13 | ||||||
| 2025-07-09 | 13F | Dynamic Advisor Solutions LLC | 10 965 | 0,51 | 1 379 | −3,97 | ||||
| 2025-08-12 | 13F | Cornerstone Wealth Management, LLC | 1 641 | −4,15 | 206 | −8,44 | ||||
| 2025-07-15 | 13F | Missouri Trust & Investment Co | 30 | 0,00 | 4 | 0,00 | ||||
| 2025-08-06 | 13F | Convergence Financial, LLC | 9 542 | 2,22 | 1 200 | −2,36 | ||||
| 2025-04-14 | 13F | Abacus Planning Group, Inc. | 0 | −100,00 | 0 | |||||
| 2025-08-13 | 13F | Everstar Asset Management, LLC | 0 | −100,00 | 0 | −100,00 | ||||
| 2025-08-11 | 13F | HighTower Advisors, LLC | 17 624 | −8,48 | 2 217 | −12,58 | ||||
| 2025-08-14 | 13F | Hilltop Holdings Inc. | 2 253 | 14,13 | 283 | 9,27 | ||||
| 2025-05-08 | 13F | Jefferies Financial Group Inc. | Put | 0 | −100,00 | 0 | −100,00 | |||
| 2025-05-16 | 13F | Coppell Advisory Solutions LLC | 0 | −100,00 | 0 | |||||
| 2025-08-13 | 13F | Northwestern Mutual Wealth Management Co | 6 451 | −44,11 | 811 | −46,64 | ||||
| 2025-07-14 | 13F | Toth Financial Advisory Corp | 15 | 0,00 | 2 | 0,00 | ||||
| 2025-08-14 | 13F | MGB Wealth Management, LLC | 1 005 | 0,20 | 126 | −4,55 | ||||
| 2025-08-05 | 13F | Fourth Dimension Wealth, LLC | 655 | −5,48 | 82 | −9,89 | ||||
| 2025-08-13 | 13F | Flow Traders U.s. Llc | 8 600 | −70,93 | 1 | −66,67 | ||||
| 2025-08-14 | 13F | Caption Management, LLC | 13 050 | 1 642 | ||||||
| 2025-07-10 | 13F | Wealth Enhancement Advisory Services, Llc | 4 701 | 0,53 | 607 | −1,30 | ||||
| 2025-08-08 | 13F | Financial Gravity Companies, Inc. | 219 | 0,00 | 28 | −3,57 | ||||
| 2025-07-09 | 13F | Key Client Fiduciary Advisors, LLC | 2 700 | 0,00 | 340 | −4,51 | ||||
| 2025-07-29 | 13F | Burford Brothers, Inc. | 0 | −100,00 | 0 | |||||
| 2025-08-18 | 13F | Pacific Center for Financial Services | 39 | 2,63 | 5 | −20,00 | ||||
| 2025-08-04 | 13F | Arkadios Wealth Advisors | 26 793 | −23,17 | 3 371 | −26,63 | ||||
| 2025-08-14 | 13F | State Of Wisconsin Investment Board | 88 800 | 11 171 | ||||||
| 2025-08-14 | 13F | Susquehanna International Group, Llp | Put | 3 675 500 | 6,04 | 462 378 | 1,28 | |||
| 2025-08-14 | 13F | Susquehanna International Group, Llp | 261 435 | 52,48 | 32 889 | 45,64 | ||||
| 2025-08-13 | 13F | ExodusPoint Capital Management, LP | 73 434 | 9 | ||||||
| 2025-08-14 | 13F | Susquehanna International Group, Llp | Call | 1 620 100 | −21,25 | 203 809 | −24,78 | |||
| 2025-07-15 | 13F | Financial Management Professionals, Inc. | 96 | 0,00 | 12 | 0,00 | ||||
| 2025-08-11 | 13F | Cladis Investment Advisory, LLC | 2 662 | 0,00 | 335 | −4,57 | ||||
| 2025-07-16 | 13F | Strategic Investment Solutions, Inc. /IL | 200 | 0,00 | 25 | −3,85 | ||||
| 2025-07-11 | 13F | Seacrest Wealth Management, Llc | 0 | −100,00 | 0 | |||||
| 2025-08-08 | 13F | Smithfield Trust Co | 145 | 0,00 | 0 | |||||
| 2025-05-15 | 13F | Brevan Howard Capital Management LP | 0 | −100,00 | 0 | −100,00 | ||||
| 2025-07-22 | 13F | Grimes & Company, Inc. | 2 982 | 375 | ||||||
| 2025-07-31 | 13F | Wealthfront Advisers Llc | 16 544 | −1,79 | 2 081 | −6,18 | ||||
| 2025-08-19 | 13F | Slocum, Gordon & Co LLP | 0 | −100,00 | 0 | |||||
| 2025-08-08 | 13F | Cetera Investment Advisers | 52 417 | −33,58 | 6 594 | −36,57 | ||||
| 2025-08-12 | 13F | Pathstone Holdings, LLC | 11 518 | −23,53 | 1 449 | −26,98 | ||||
| 2025-08-14 | 13F | Two Sigma Investments, Lp | 0 | −100,00 | 0 | |||||
| 2025-05-12 | 13F | Independent Advisor Alliance | 0 | −100,00 | 0 | |||||
| 2025-08-12 | 13F | Global Retirement Partners, LLC | 84 | 0,00 | 11 | −9,09 | ||||
| 2025-08-11 | 13F | ARS Investment Partners, LLC | 25 956 | 39,17 | 3 265 | 32,29 | ||||
| 2025-08-14 | 13F | IHT Wealth Management, LLC | 1 621 | 204 | ||||||
| 2025-08-08 | 13F | Pnc Financial Services Group, Inc. | 10 311 | −0,42 | 1 297 | −4,84 | ||||
| 2025-08-11 | 13F | FSA Wealth Management LLC | 703 | 0,14 | 88 | −4,35 | ||||
| 2025-08-14 | 13F | Peak6 Llc | Call | 1 393 600 | 403,47 | 175 315 | 380,88 | |||
| 2025-08-14 | 13F | Raymond James Financial Inc | 38 257 | −9,12 | 4 813 | −13,20 | ||||
| 2025-08-14 | 13F | Peak6 Llc | Put | 127 400 | 3,33 | 16 027 | −1,31 | |||
| 2025-05-02 | 13F | Capital A Wealth Management, LLC | 120 | −25,00 | 16 | −28,57 | ||||
| 2025-08-07 | 13F | Kestra Private Wealth Services, Llc | 8 574 | −11,54 | 1 079 | −15,52 | ||||
| 2025-08-07 | 13F | Amica Retiree Medical Trust | 1 804 | 0,00 | 0 | |||||
| 2025-08-05 | 13F | Cherry Tree Wealth Management, LLC | 36 | 0,00 | 5 | 0,00 | ||||
| 2025-08-13 | 13F | Marshall Wace, Llp | Put | 32 600 | −83,06 | 4 101 | −83,83 | |||
| 2025-08-14 | 13F | Goldman Sachs Group Inc | Call | 99 900 | −85,00 | 12 567 | −85,68 | |||
| 2025-08-15 | 13F | Tower Research Capital LLC (TRC) | 12 | −99,84 | 2 | −99,90 | ||||
| 2025-04-25 | 13F | New Wave Wealth Advisors Llc | 0 | −100,00 | 0 | |||||
| 2025-07-18 | 13F | Client 1st Advisory Group, Llc | 0 | −100,00 | 0 | |||||
| 2025-08-11 | 13F | Banque Cantonale Vaudoise | 32 318 | −22,90 | 4 | −20,00 | ||||
| 2025-08-14 | 13F | DRW Securities, LLC | Call | 170 000 | 21 386 | |||||
| 2025-05-14 | 13F | Thomist Capital Management, LP | 0 | −100,00 | 0 | |||||
| 2025-08-06 | 13F | Black Swift Group, LLC | 0 | −100,00 | 0 | |||||
| 2025-08-13 | 13F | Marshall Wace, Llp | 10 580 | −66,10 | 1 331 | −67,65 | ||||
| 2025-08-14 | 13F | Goldman Sachs Group Inc | Put | 238 400 | −59,10 | 29 991 | −60,94 | |||
| 2025-08-15 | 13F | Ctc Llc | Call | 3 600 | −86,52 | 453 | −87,14 | |||
| 2025-07-24 | 13F | Stonebridge Financial Group, LLC | 0 | −100,00 | 0 | |||||
| 2025-05-28 | NP | THRIVENT SERIES FUND INC - Thrivent Global Stock Portfolio Class A | 1 077 | 0,00 | 142 | −0,70 | ||||
| 2025-07-10 | 13F | Rfg Holdings, Inc. | 11 465 | −11,81 | 1 442 | −15,87 | ||||
| 2025-06-26 | NP | OWSMX - Old Westbury Small & Mid Cap Strategies Fund | 102 937 | −3,61 | 11 396 | −20,45 | ||||
| 2025-08-05 | 13F | GPS Wealth Strategies Group, LLC | 200 | 0,00 | 25 | −3,85 | ||||
| 2025-08-13 | 13F | Baird Financial Group, Inc. | 0 | −100,00 | 0 | |||||
| 2025-08-08 | 13F | Capital Investment Counsel, Inc | 190 | 0,00 | 24 | −8,00 | ||||
| 2025-07-21 | 13F | Ping Capital Management, Inc. | 22 000 | 120,00 | 2 768 | 110,10 | ||||
| 2025-05-15 | 13F | Css Llc/il | Call | 0 | −100,00 | 0 | ||||
| 2025-08-13 | 13F | Renaissance Technologies Llc | 0 | −100,00 | 0 | |||||
| 2025-03-27 | NP | THMAX - Thrivent Moderate Allocation Fund Class A | 1 135 | −26,25 | 152 | −32,44 | ||||
| 2025-07-16 | 13F | Meridian Investment Counsel Inc. | 5 855 | 0,00 | 737 | −4,54 | ||||
| 2025-07-31 | 13F | Cambridge Investment Research Advisors, Inc. | 20 971 | −5,66 | 3 | 0,00 | ||||
| 2025-07-16 | 13F | ORG Wealth Partners, LLC | 11 523 | 24,34 | 1 465 | 19,01 | ||||
| 2025-08-05 | 13F | Wellington Shields Capital Management, LLC | 9 190 | 0,00 | 1 156 | −4,46 | ||||
| 2025-08-15 | 13F | Ctc Llc | Put | 5 000 | −92,60 | 629 | −92,93 | |||
| 2025-08-18 | 13F/A | National Bank Of Canada /fi/ | 10 321 | 31,41 | 1 298 | 25,53 | ||||
| 2025-05-28 | NP | GHTA - Goose Hollow Tactical Allocation ETF | 12 169 | 1 603 | ||||||
| 2025-08-04 | 13F | Bristlecone Advisors, LLC | 0 | −100,00 | 0 | |||||
| 2025-04-22 | 13F | Castleview Partners, Llc | 0 | −100,00 | 0 | |||||
| 2025-08-14 | 13F | Millennium Management Llc | Call | 491 400 | −21,83 | 61 818 | −25,33 | |||
| 2025-08-14 | 13F | Hara Capital LLC | 5 000 | 0,00 | 629 | −4,41 | ||||
| 2025-07-18 | 13F | TruNorth Capital Management, LLC | 1 300 | 0,00 | 164 | −4,68 | ||||
| 2025-05-14 | 13F | Van Hulzen Asset Management, LLC | 0 | −100,00 | 0 | −100,00 | ||||
| 2025-07-31 | 13F | Cardinal Point Capital Management, ULC | 2 150 | 270 | ||||||
| 2025-03-27 | NP | TMAAX - Thrivent Moderately Aggressive Allocation Fund Class A | 1 720 | −21,35 | 231 | −28,12 | ||||
| 2025-08-13 | 13F | Hbk Investments L P | Call | 83 300 | 10 479 | |||||
| 2025-08-13 | 13F | Hbk Investments L P | Put | 869 000 | 244,84 | 109 320 | 229,38 | |||
| 2025-08-19 | 13F | Anchor Investment Management, LLC | 331 | 0,00 | 42 | −4,65 | ||||
| 2025-04-22 | 13F | Verde Servicos Internacionais S.A. | 0 | −100,00 | 0 | |||||
| 2025-07-10 | 13F | Focus Financial Network, Inc. | 0 | −100,00 | 0 | |||||
| 2025-08-01 | 13F | Mizuho Markets Americas Llc | 5 697 | −12,10 | 717 | −16,06 | ||||
| 2025-08-01 | 13F | Centerpoint Advisors, LLC | 175 | 0,00 | 0 | |||||
| 2025-08-05 | 13F | Connable Office Inc | 0 | −100,00 | 0 | |||||
| 2025-05-28 | NP | THRIVENT SERIES FUND INC - Thrivent Moderate Allocation Portfolio Class A | 2 785 | 0,00 | 367 | −0,54 | ||||
| 2025-07-30 | 13F | Atlantic Edge Private Wealth Management, LLC | 171 | 0,00 | 22 | −4,55 | ||||
| 2025-07-28 | 13F | Harbour Investments, Inc. | 1 685 | 36,88 | 212 | 30,25 | ||||
| 2025-08-07 | 13F | Runnymede Capital Advisors, Inc. | 0 | −100,00 | 0 | |||||
| 2025-08-14 | 13F | Lazard Asset Management Llc | 7 463 | 1 | ||||||
| 2025-08-13 | 13F | Mackenzie Financial Corp | 6 000 | −4,76 | 755 | −9,05 | ||||
| 2025-08-01 | 13F | Banco Santander, S.A. | 10 282 | 24,00 | 1 293 | 18,41 | ||||
| 2025-08-14 | 13F | Elliott Investment Management L.P. | Put | 0 | −100,00 | 0 | −100,00 | |||
| 2025-05-13 | 13F | SFI Advisors, LLC | 0 | −100,00 | 0 | |||||
| 2025-08-12 | 13F | Ameritas Investment Partners, Inc. | 0 | −100,00 | 0 | |||||
| 2025-07-31 | 13F | Schneider Downs Wealth Management Advisors, LP | 2 361 | 297 | ||||||
| 2025-07-17 | 13F | Global Trust Asset Management, LLC | 1 030 | 130 | ||||||
| 2025-08-14 | 13F | Sig Brokerage, Lp | 0 | −100,00 | 0 | −100,00 | ||||
| 2025-05-30 | NP | ERNZ - TrueShares Active Yield ETF | 1 591 | 210 | ||||||
| 2025-07-18 | 13F | Access Financial Services, Inc. | 7 382 | −5,02 | 929 | −9,29 | ||||
| 2025-04-21 | 13F | Beacon Capital Management, LLC | 0 | −100,00 | 0 | |||||
| 2025-08-07 | 13F | Amica Mutual Insurance Co | 19 606 | 0,00 | 2 | 0,00 | ||||
| 2025-08-11 | 13F | Western Wealth Management, LLC | 1 824 | −22,68 | 229 | −26,13 | ||||
| 2025-07-22 | 13F | Rockingstone Advisors LLC | 5 660 | −7,44 | 712 | −11,55 | ||||
| 2025-07-07 | 13F | Kings Path Partners LLC | 1 280 | 0,00 | 161 | −4,17 | ||||
| 2025-07-23 | 13F | Massachusetts Wealth Management | 1 995 | −14,93 | 251 | −18,83 | ||||
| 2025-08-14 | 13F | Comerica Bank | 5 186 | 54,53 | 652 | 47,51 | ||||
| 2025-05-14 | 13F | Credit Agricole S A | 438 | −15,77 | 58 | −16,18 | ||||
| 2025-08-14 | 13F | Quantitative Investment Management, LLC | 4 922 | −95,15 | 1 | −100,00 | ||||
| 2025-08-14 | 13F | Stamos Capital Partners, L.p. | 29 427 | 91,57 | 3 702 | 82,95 | ||||
| 2025-07-18 | 13F | Truist Financial Corp | 22 275 | 10,85 | 2 802 | 5,90 | ||||
| 2025-08-14 | 13F | Murphy & Mullick Capital Management Corp | 10 | 1 | ||||||
| 2025-08-14 | 13F | Nomura Holdings Inc | Put | 0 | −100,00 | 0 | ||||
| 2025-08-14 | 13F | Goldman Sachs Group Inc | 3 738 398 | −1,45 | 470 290 | −5,87 | ||||
| 2025-07-21 | 13F | Ameritas Advisory Services, LLC | 4 815 | −17,80 | 606 | −21,83 | ||||
| 2025-08-04 | 13F | Prairie Wealth Advisors, Inc. | 1 857 | −3,88 | 234 | −8,27 | ||||
| 2025-07-15 | 13F | EWG Elevate Inc. | 14 363 | 1 807 | ||||||
| 2025-08-14 | 13F | Heritage Wealth Management, Inc. | 6 696 | 842 | ||||||
| 2025-08-14 | 13F | Nomura Holdings Inc | Call | 0 | −100,00 | 0 | ||||
| 2025-08-18 | 13F | Wolverine Trading, Llc | 12 252 | −45,75 | 1 558 | −47,20 | ||||
| 2025-08-14 | 13F/A | Barclays Plc | Put | 36 100 | −95,58 | 5 | −96,26 | |||
| 2025-06-26 | NP | OWACX - Old Westbury All Cap Core Fund | 54 048 | −5,41 | 5 984 | −21,95 | ||||
| 2025-08-14 | 13F/A | Barclays Plc | Call | 762 200 | 4 134,44 | 96 | 4 650,00 | |||
| 2025-08-14 | 13F | Sunbelt Securities, Inc. | 1 340 | −0,59 | 177 | 0,00 | ||||
| 2025-07-16 | 13F | Essex Financial Services, Inc. | 7 789 | −2,45 | 980 | −6,85 | ||||
| 2025-08-15 | 13F | Earnest Partners Llc | 40 094 | 0,00 | 5 044 | −4,49 | ||||
| 2025-08-14 | 13F/A | Barclays Plc | 1 298 655 | 8,54 | 163 | 3,82 | ||||
| 2025-07-21 | 13F | CenterStar Asset Management, LLC | 0 | −100,00 | 0 | |||||
| 2025-04-09 | 13F | Sanders Morris Harris Llc | 0 | −100,00 | 0 | |||||
| 2025-06-26 | NP | OWTEX - Old Westbury Total Equity Fund | 4 165 | 461 | ||||||
| 2025-05-13 | 13F | Franklin Resources Inc | 0 | −100,00 | 0 | |||||
| 2025-08-13 | 13F | Jones Financial Companies Lllp | 8 955 | 1,99 | 1 139 | −0,70 | ||||
| 2025-07-29 | 13F | International Assets Investment Management, Llc | 5 306 | −1,87 | 667 | −6,32 | ||||
| 2025-08-14 | 13F | Mariner, LLC | 7 590 | −10,42 | 955 | −14,44 | ||||
| 2025-08-18 | 13F | Wolverine Trading, Llc | Put | 553 100 | 94,62 | 70 354 | 89,43 | |||
| 2025-07-25 | 13F | RoundAngle Advisors LLC | 4 357 | −38,84 | 548 | −41,58 | ||||
| 2025-08-18 | 13F | Wolverine Trading, Llc | Call | 206 100 | −37,81 | 26 216 | −39,47 | |||
| 2025-08-27 | 13F/A | Squarepoint Ops LLC | 158 335 | 33,66 | 19 919 | 27,66 | ||||
| 2025-07-22 | 13F | Miracle Mile Advisors, LLC | 0 | −100,00 | 0 | |||||
| 2025-04-22 | 13F | Synergy Financial Management, LLC | 0 | −100,00 | 0 | |||||
| 2025-05-12 | 13F | Hirtle Callaghan & Co LLC | 0 | −100,00 | 0 | |||||
| 2025-08-27 | 13F/A | Squarepoint Ops LLC | Call | 31 500 | −18,39 | 3 963 | −22,07 | |||
| 2025-08-27 | 13F/A | Squarepoint Ops LLC | Put | 16 600 | −54,52 | 2 088 | −56,56 | |||
| 2025-08-07 | 13F | Allworth Financial LP | 636 | 759,46 | 80 | 900,00 | ||||
| 2025-08-04 | 13F | Kovack Advisors, Inc. | 0 | −100,00 | 0 | |||||
| 2025-08-19 | 13F | Marex Group plc | 66 889 | 8 415 | ||||||
| 2025-08-14 | 13F | Sig Brokerage, Lp | Call | 18 800 | 2 365 | |||||
| 2025-08-14 | 13F | Price T Rowe Associates Inc /md/ | 953 455 | 120 | ||||||
| 2025-08-07 | 13F | Zurcher Kantonalbank (Zurich Cantonalbank) | 2 107 | −2,00 | 268 | −4,29 | ||||
| 2025-08-14 | 13F | Balyasny Asset Management Llc | Call | 67 500 | −81,63 | 8 492 | −82,46 | |||
| 2025-08-14 | 13F | Millennium Management Llc | 22 000 | −80,18 | 2 768 | −81,07 | ||||
| 2025-08-14 | 13F | Balyasny Asset Management Llc | Put | 75 800 | −66,55 | 9 536 | −68,05 | |||
| 2025-05-08 | 13F | Menard Financial Group LLC | 0 | −100,00 | 0 | |||||
| 2025-08-14 | 13F | Millennium Management Llc | Put | 820 400 | 12,52 | 103 206 | 7,47 | |||
| 2025-07-01 | 13F | Harbor Investment Advisory, Llc | 800 | 0,00 | 101 | −4,76 | ||||
| 2025-04-21 | 13F | ORG Partners LLC | 0 | −100,00 | 0 | |||||
| 2025-08-14 | 13F | Waters Parkerson & Co., Llc | 2 500 | 0,00 | 314 | −4,56 | ||||
| 2025-05-06 | 13F | Genoa Capital Gestora de Recursos Ltda. | 0 | −100,00 | 0 | −100,00 | ||||
| 2025-08-13 | 13F | Scotia Capital Inc. | 5 825 | −6,49 | 733 | −10,73 | ||||
| 2025-07-30 | 13F | Brookstone Capital Management | 14 466 | −1,59 | 1 820 | −5,99 | ||||
| 2025-08-04 | 13F | Spire Wealth Management | 162 | −4,71 | 20 | −9,09 | ||||
| 2025-08-08 | 13F | Capital Investment Advisory Services, LLC | 417 | 0,00 | 52 | −3,70 | ||||
| 2025-08-14 | 13F | CTC Alternative Strategies, Ltd. | 0 | −100,00 | 0 | |||||
| 2025-08-14 | 13F | LMR Partners LLP | 0 | −100,00 | 0 | |||||
| 2025-08-05 | 13F | Dunhill Financial, LLC | 0 | −100,00 | 0 | |||||
| 2025-08-12 | 13F | Jefferies Financial Group Inc. | 3 218 | 0,00 | 405 | −4,49 | ||||
| 2025-08-13 | 13F | Global Endowment Management, LP | 2 700 | −32,50 | 340 | −35,55 | ||||
| 2025-08-14 | 13F | Balyasny Asset Management Llc | 0 | −100,00 | 0 | |||||
| 2025-05-08 | 13F | Jefferies Financial Group Inc. | Call | 0 | −100,00 | 0 | −100,00 | |||
| 2025-07-22 | 13F | Merit Financial Group, LLC | 7 547 | −0,11 | 949 | −4,62 | ||||
| 2025-04-25 | 13F | WASHINGTON TRUST Co | 0 | −100,00 | 0 | |||||
| 2025-07-31 | 13F | Optimum Investment Advisors | 100 | 0,00 | 13 | −7,69 | ||||
| 2025-08-08 | 13F | Allianz Se | 51 025 | 33,49 | 6 419 | 27,49 | ||||
| 2025-08-14 | 13F | DRW Securities, LLC | 0 | −100,00 | 0 | −100,00 | ||||
| 2025-08-11 | 13F | Y.D. More Investments Ltd | 12 000 | 0,00 | 1 510 | −4,49 | ||||
| 2025-08-12 | 13F | Eisler Capital Management Ltd. | Put | 52 800 | −34,08 | 6 646 | −37,01 | |||
| 2025-08-14 | 13F | Warren Averett Asset Management, LLC | 1 885 | −10,32 | 237 | −14,13 | ||||
| 2025-07-14 | 13F | Armstrong Advisory Group, Inc | 430 | −67,98 | 54 | −69,49 | ||||
| 2025-08-12 | 13F | Eisler Capital Management Ltd. | 15 132 | −60,75 | 1 905 | −62,50 | ||||
| 2025-08-06 | 13F | AE Wealth Management LLC | 2 617 | −6,10 | 329 | −10,35 | ||||
| 2025-08-12 | 13F | Park Square Financial Group, LLC | 150 | 0,00 | 19 | −5,26 | ||||
| 2025-05-01 | 13F | Quest 10 Wealth Builders, Inc. | 14 | 0,00 | 2 | 0,00 | ||||
| 2025-08-14 | 13F | Alpine Global Management, LLC | 3 081 | 388 | ||||||
| 2025-08-11 | 13F | Rothschild Investment Llc | 253 | 0,00 | 32 | −6,06 | ||||
| 2025-05-08 | 13F | Private Advisory Group LLC | 0 | −100,00 | 0 | −100,00 | ||||
| 2025-08-14 | 13F | UBS Group AG | 1 538 586 | 7,11 | 193 554 | 2,30 | ||||
| 2025-08-14 | 13F | UBS Group AG | Call | 139 900 | −36,64 | 17 599 | −39,48 | |||
| 2025-07-23 | 13F | Tyche Wealth Partners LLC | 0 | −100,00 | 0 | |||||
| 2025-08-11 | 13F | Perennial Investment Advisors, LLC | 0 | −100,00 | 0 | |||||
| 2025-08-14 | 13F | Tudor Investment Corp Et Al | 44 279 | −43,23 | 5 570 | −45,78 | ||||
| 2025-05-16 | 13F | Empowered Funds, LLC | 0 | −100,00 | 0 | |||||
| 2025-08-01 | 13F | Advisory Alpha, LLC | 2 423 | −4,72 | 305 | −8,98 | ||||
| 2025-08-08 | 13F | MTM Investment Management, LLC | 10 | 0,00 | 1 | 0,00 | ||||
| 2025-08-14 | 13F | Tudor Investment Corp Et Al | Put | 105 000 | 0,00 | 13 209 | −4,48 | |||
| 2025-08-14 | 13F | Toronto Dominion Bank | 5 051 | −30,33 | 635 | −33,44 | ||||
| 2025-03-27 | NP | TMCGX - Thrivent Mid Cap Growth Fund Class S | 515 | −13,15 | 69 | −19,77 | ||||
| 2025-07-29 | 13F | Stratos Wealth Partners, LTD. | 0 | −100,00 | 0 | |||||
| 2025-08-14 | 13F | Toronto Dominion Bank | Put | 400 000 | 0,00 | 50 320 | −4,46 | |||
| 2025-08-14 | 13F | UBS Group AG | Put | 317 700 | 37,53 | 39 967 | 31,36 | |||
| 2025-08-14 | 13F | Parallax Volatility Advisers, L.P. | Put | 84 800 | −76,22 | 10 668 | −77,29 | |||
| 2025-04-29 | 13F | Lee Danner & Bass Inc | 0 | −100,00 | 0 | −100,00 | ||||
| 2025-08-14 | 13F | SWAN Capital LLC | 20 | 0,00 | 3 | 0,00 | ||||
| 2025-08-14 | 13F | CoreCap Advisors, LLC | 123 | 0,00 | 15 | −6,25 | ||||
| 2025-07-17 | 13F | Sound Income Strategies, LLC | 39 | 95,00 | 5 | 100,00 | ||||
| 2025-08-14 | 13F | State Of Wisconsin Investment Board | Call | 166 400 | 20 933 | |||||
| 2025-07-24 | 13F | Us Bancorp \de\ | 4 521 | 5,98 | 569 | 1,25 | ||||
| 2025-08-14 | 13F | Parallax Volatility Advisers, L.P. | 1 | −100,00 | 0 | −100,00 | ||||
| 2025-08-07 | 13F | Winthrop Capital Management, LLC | 236 | 84,38 | 0 | |||||
| 2025-08-13 | 13F | Luminist Capital LLC | 74 | 0,00 | 9 | 0,00 | ||||
| 2025-05-15 | 13F | Discovery Capital Management, Llc / Ct | 0 | −100,00 | 0 | |||||
| 2025-08-14 | 13F | First Manhattan Co | 0 | −100,00 | 0 | |||||
| 2025-08-14 | 13F | Boothbay Fund Management, Llc | 17 951 | −12,43 | 2 258 | −16,37 | ||||
| 2025-07-30 | 13F | Phoenix Holdings Ltd. | 0 | −100,00 | 0 | |||||
| 2025-08-05 | 13F | Bank Of Montreal /can/ | 63 496 | 12,54 | 7 988 | 7,48 | ||||
| 2025-08-14 | 13F | Ausdal Financial Partners, Inc. | 10 385 | 3,60 | 1 306 | −1,06 | ||||
| 2025-06-10 | 13F/A | Militia Capital Partners, LP | Put | 0 | −100,00 | 0 | −100,00 | |||
| 2025-05-15 | 13F | Claar Advisors LLC | 0 | −100,00 | 0 | |||||
| 2025-08-14 | 13F | Parallax Volatility Advisers, L.P. | Call | 105 500 | 78,51 | 13 272 | 70,49 | |||
| 2025-07-24 | 13F | Blair William & Co/il | 289 | −19,72 | 36 | −23,40 | ||||
| 2025-08-14 | 13F | Wells Fargo & Company/mn | 716 345 | −15,29 | 90 116 | −19,09 | ||||
| 2025-07-14 | 13F | E&G Advisors, LP | 7 230 | −0,14 | 910 | −4,62 | ||||
| 2025-08-11 | 13F | Nations Financial Group Inc, /ia/ /adv | 3 073 | −4,83 | 387 | −9,18 | ||||
| 2025-05-14 | 13F | Trexquant Investment LP | 0 | −100,00 | 0 | |||||
| 2025-08-14 | 13F/A | Perritt Capital Management Inc | 9 | 0,00 | 1 | 0,00 | ||||
| 2025-08-14 | 13F | Great Valley Advisor Group, Inc. | 4 188 | −8,84 | 526 | −13,06 | ||||
| 2025-08-13 | 13F | Level Four Advisory Services, Llc | 1 595 | −12,60 | 201 | −16,67 | ||||
| 2025-03-27 | NP | TAAAX - Thrivent Aggressive Allocation Fund Class A | 1 735 | −17,62 | 233 | −24,68 | ||||
| 2025-08-01 | 13F | Transcend Wealth Collective, Llc | 0 | −100,00 | 0 | |||||
| 2025-08-14 | 13F | Ameriprise Financial Inc | 6 243 | −30,22 | 785 | −33,19 | ||||
| 2025-04-11 | 13F | Lake Hills Wealth Management, LLC | 0 | −100,00 | 0 | −100,00 | ||||
| 2025-05-14 | 13F | HAP Trading, LLC | Call | 0 | −100,00 | 0 | −100,00 | |||
| 2025-08-13 | 13F | Walleye Trading LLC | Call | 169 600 | −45,85 | 21 336 | −48,28 | |||
| 2025-08-05 | 13F | Wakefield Asset Management LLLP | 2 504 | 315 | ||||||
| 2025-08-13 | 13F | Walleye Trading LLC | Put | 269 200 | 64,95 | 33 865 | 57,55 | |||
| 2025-08-13 | 13F | Walleye Trading LLC | 22 162 | 2 788 | ||||||
| 2025-04-28 | 13F | First Horizon Advisors, Inc. | 0 | −100,00 | 0 | −100,00 | ||||
| 2025-05-07 | 13F/A | Symmetry Investments LP | 0 | −100,00 | 0 | |||||
| 2025-07-29 | 13F | Calamos Wealth Management LLC | 6 600 | 0,00 | 830 | −4,49 | ||||
| 2025-04-22 | 13F | Woodmont Investment Counsel Llc | 0 | −100,00 | 0 | |||||
| 2025-07-30 | 13F | Whittier Trust Co Of Nevada Inc | 1 670 | 0,00 | 210 | −4,11 | ||||
| 2025-08-11 | 13F | Citigroup Inc | 2 106 198 | −5,00 | 264 960 | −9,26 | ||||
| 2025-08-11 | 13F | Citigroup Inc | Put | 103 200 | −61,28 | 12 983 | −63,01 | |||
| 2025-08-11 | 13F | Citigroup Inc | Call | 150 900 | 201,80 | 18 983 | 188,28 | |||
| 2025-08-13 | 13F | Continuum Advisory, LLC | 0 | −100,00 | 0 | |||||
| 2025-05-15 | 13F | Rokos Capital Management LLP | 0 | −100,00 | 0 | −100,00 | ||||
| 2025-08-05 | 13F | Mirae Asset Securities (usa) Inc. | 650 000 | 0,00 | 81 770 | −4,49 | ||||
| 2025-07-08 | 13F | Nbc Securities, Inc. | 351 | 51,29 | 0 | |||||
| 2025-04-21 | 13F | PSI Advisors, LLC | 0 | −100,00 | 0 | |||||
| 2025-05-15 | 13F | Rokos Capital Management LLP | Put | 0 | −100,00 | 0 | −100,00 | |||
| 2025-05-14 | 13F | Barometer Capital Management Inc. | 0 | −100,00 | 0 | |||||
| 2025-08-12 | 13F | Founders Financial Alliance, LLC | 2 526 | −0,16 | 318 | −4,80 | ||||
| 2025-07-10 | 13F | Secure Asset Management, LLC | 3 028 | 381 | ||||||
| 2025-08-14 | 13F | J. Goldman & Co LP | 3 369 | −61,31 | 424 | −63,09 | ||||
| 2025-08-12 | 13F | CIBC Private Wealth Group, LLC | 152 | −40,62 | 19 | −26,92 | ||||
| 2025-07-17 | 13F | Janney Montgomery Scott LLC | 9 558 | 31,00 | 1 | |||||
| 2025-08-14 | 13F | Condire Management, LP | 0 | −100,00 | 0 | |||||
| 2025-07-25 | 13F | Cwm, Llc | 2 666 | −87,44 | 0 | −100,00 | ||||
| 2025-08-12 | 13F | MAI Capital Management | 1 339 | 7,46 | 168 | 2,44 | ||||
| 2025-07-24 | 13F | Acima Private Wealth, Llc | 17 944 | 0,00 | 2 257 | −4,49 | ||||
| 2025-08-13 | 13F | Cresset Asset Management, LLC | 2 037 | 21,03 | 256 | 15,84 | ||||
| 2025-05-06 | 13F | Venturi Wealth Management, LLC | 0 | −100,00 | 0 | |||||
| 2025-07-24 | 13F | Ulland Investment Advisors, LLC | 25 | −46,81 | 0 | |||||
| 2025-08-14 | 13F | Maven Securities LTD | 4 568 | −83,67 | 575 | −84,41 | ||||
| 2025-07-18 | 13F | Provident Wealth Management, LLC | 455 | −1,52 | 57 | −5,00 | ||||
| 2025-07-16 | 13F | Cresta Advisors, Ltd. | 2 100 | 0,00 | 264 | −4,35 | ||||
| 2025-08-14 | 13F | York Capital Management Global Advisors, LLC | Put | 150 000 | 0,00 | 18 870 | −4,48 | |||
| 2025-08-18 | 13F | N.E.W. Advisory Services LLC | 28 | −50,00 | 4 | −57,14 | ||||
| 2025-05-02 | 13F | BlackRock, Inc. | 0 | −100,00 | 0 | −100,00 | ||||
| 2025-08-25 | 13F/A | Neuberger Berman Group LLC | 6 561 | 63,58 | 825 | 56,25 | ||||
| 2025-08-13 | 13F | Willis Johnson & Associates, Inc. | 2 436 | −4,92 | 306 | −9,20 | ||||
| 2025-08-07 | 13F | BOK Financial Private Wealth, Inc. | 0 | −100,00 | 0 | |||||
| 2025-08-01 | 13F | Mizuho Markets Cayman LP | 2 566 | 323 | ||||||
| 2025-08-18 | 13F | Geneos Wealth Management Inc. | 226 | −37,74 | 28 | −40,43 | ||||
| 2025-08-12 | 13F | Southeast Asset Advisors Inc. | 59 960 | 8,74 | 7 543 | 3,86 | ||||
| 2025-07-17 | 13F/A | RK Capital Management, LLC/FL | 0 | −100,00 | 0 | −100,00 | ||||
| 2025-07-08 | 13F | Lowe Wealth Advisors, LLC | 612 | −51,27 | 77 | −53,94 | ||||
| 2025-08-11 | 13F | Principal Securities, Inc. | 8 714 | 54,09 | 1 096 | 46,52 | ||||
| 2025-08-14 | 13F | Mercer Global Advisors Inc /adv | 12 565 | −46,20 | 1 581 | −48,63 | ||||
| 2025-05-05 | 13F | Transce3nd, LLC | 0 | −100,00 | 0 | |||||
| 2025-08-11 | 13F | Waratah Capital Advisors Ltd. | Call | 100 000 | 12 580 | |||||
| 2025-08-14 | 13F | Optiver Holding B.V. | 8 311 | −42,13 | 1 046 | −44,74 | ||||
| 2025-08-07 | 13F | LOM Asset Management Ltd | 880 | 0 | ||||||
| 2025-07-07 | 13F | Global Wealth Strategies & Associates | 160 | 0,00 | 20 | −4,76 | ||||
| 2025-07-23 | 13F | Friedenthal Financial | 22 | 83,33 | 3 | 100,00 | ||||
| 2025-08-05 | 13F | Huntington National Bank | 0 | |||||||
| 2025-08-14 | 13F | Concorde Financial Corp | 3 462 | 0,00 | 436 | −4,40 | ||||
| 2025-08-15 | 13F | CI Private Wealth, LLC | 37 142 | 496,66 | 4 673 | 469,76 | ||||
| 2025-07-25 | 13F | Stephens Consulting, LLC | 118 | 293,33 | 15 | 366,67 | ||||
| 2025-08-14 | 13F | SoftVest Advisors, LLC | Put | 868 000 | −50,68 | 109 194 | −52,89 | |||
| 2025-07-18 | 13F | Parkside Investments, LLC | 2 500 | −33,77 | 314 | −36,82 | ||||
| 2025-08-13 | 13F | Marshall Wace, Llp | Call | 0 | −100,00 | 0 | −100,00 | |||
| 2025-08-12 | 13F | Inscription Capital, LLC | 0 | −100,00 | 0 | |||||
| 2025-08-12 | 13F | XTX Topco Ltd | 19 745 | 2 484 | ||||||
| 2025-07-15 | 13F | North Star Investment Management Corp. | 597 | 0,17 | 75 | −3,85 | ||||
| 2025-08-11 | 13F | Strategic Wealth Partners, Ltd. | 146 | 18 | ||||||
| 2025-05-15 | 13F | Tudor Investment Corp Et Al | Call | 0 | −100,00 | 0 | −100,00 | |||
| 2025-04-24 | 13F | Cushing Asset Management, Lp | Call | 0 | −100,00 | 0 | ||||
| 2025-08-13 | 13F | Satovsky Asset Management Llc | 57 730 | 1,88 | 7 262 | −2,69 | ||||
| 2025-08-14 | 13F | EP Wealth Advisors, Inc. | 292 149 | 0,91 | 36 752 | −3,62 | ||||
| 2025-08-19 | 13F | National Asset Management, Inc. | 1 807 | 227 | ||||||
| 2025-08-14 | 13F | Mml Investors Services, Llc | 40 086 | −38,11 | 5 | −37,50 | ||||
| 2025-05-15 | 13F | Verition Fund Management LLC | Call | 0 | −100,00 | 0 | −100,00 | |||
| 2025-08-14 | 13F | Boothbay Fund Management, Llc | Put | 7 000 | 881 | |||||
| 2025-08-01 | 13F | Ashton Thomas Private Wealth, LLC | 28 492 | 1 703,29 | 3 584 | 1 623,08 | ||||
| 2025-08-29 | 13F | Centaurus Financial, Inc. | 3 222 | −3,91 | 0 | |||||
| 2025-08-14 | 13F | Fmr Llc | 1 170 | −8,02 | 147 | −11,98 | ||||
| 2025-08-06 | 13F | Walkner Condon Financial Advisors LLC | 1 960 | 0,00 | 247 | −4,65 | ||||
| 2025-08-12 | 13F | Bokf, Na | 200 | 0,00 | 25 | −3,85 | ||||
| 2025-07-17 | 13F | Oakworth Capital, Inc. | 232 | −99,88 | 29 | −99,89 | ||||
| 2025-08-14 | 13F | Wells Fargo & Company/mn | Call | 30 000 | −92,94 | 3 774 | −93,25 | |||
| 2025-08-14 | 13F | Wells Fargo & Company/mn | Put | 748 200 | −8,34 | 94 124 | −12,46 | |||
| 2025-07-22 | 13F | Coastal Investment Advisors, Inc. | 0 | −100,00 | 0 | |||||
| 2025-08-18 | 13F | Hollencrest Capital Management | 283 | 0,71 | 36 | −5,41 | ||||
| 2025-08-14 | 13F | Sourcerock Group LLC | 17 951 | −12,43 | 2 258 | −16,37 | ||||
| 2025-08-08 | 13F | Ogorek Anthony Joseph /ny/ /adv | 253 | 0,40 | 0 | |||||
| 2025-08-12 | 13F | Archer Investment Corp | 121 | 0,00 | 15 | 0,00 | ||||
| 2025-08-12 | 13F | Cadence Wealth Management LLC | 25 526 | 3,88 | 3 211 | −0,77 | ||||
| 2025-08-05 | 13F | Arrowroot Family Office, LLC | 7 837 | 1,01 | 986 | −4,00 | ||||
| 2025-08-12 | 13F | LPL Financial LLC | 190 876 | −9,07 | 24 012 | −13,15 | ||||
| 2025-08-01 | 13F | Anson Capital, Inc. | 9 992 | 56,96 | 1 257 | 50,00 | ||||
| 2025-07-03 | 13F | Fiduciary Financial Group, Llc | 2 026 | 0,85 | 257 | 22,97 | ||||
| 2025-08-11 | 13F | Wealthspire Advisors, LLC | 1 696 | 213 | ||||||
| 2025-07-17 | 13F | Enclave Advisors LLC | 0 | −100,00 | 0 | |||||
| 2025-08-13 | 13F | Congress Wealth Management LLC / DE / | 9 202 | 4,68 | 1 158 | −0,09 | ||||
| 2025-05-13 | 13F | Ground Swell Capital, LLC | 0 | −100,00 | 0 | |||||
| 2025-07-18 | 13F | Centricity Wealth Management, LLC | 21 | 0,00 | 3 | 0,00 | ||||
| 2025-07-08 | 13F/A | Salem Investment Counselors Inc | 2 295 | 0,00 | 289 | −4,64 | ||||
| 2025-08-11 | 13F | Private Advisor Group, LLC | Put | 0 | −100,00 | 0 | ||||
| 2025-08-15 | 13F | Nikulski Financial, Inc. | 2 945 | 370 | ||||||
| 2025-05-28 | NP | THRIVENT SERIES FUND INC - Thrivent Aggressive Allocation Portfolio Class A | 1 435 | 0,00 | 189 | 0,00 | ||||
| 2025-08-26 | NP | PRAFX - T. Rowe Price Real Assets Fund, Inc. This fund is a listed as child fund of Price T Rowe Associates Inc /md/ and if that institution has disclosed ownership in this security, then these positions will not be double counted when calculating total shares and total value | 371 526 | 116,64 | 46 738 | 107,21 | ||||
| 2025-04-21 | 13F | Nelson, Van Denburg & Campbell Wealth Management Group, LLC | 0 | −100,00 | 0 | |||||
| 2025-08-14 | 13F | Aster Capital Management (DIFC) Ltd | 26 065 | 3 279 | ||||||
| 2025-08-13 | 13F | Capital Fund Management S.a. | 0 | −100,00 | 0 | −100,00 | ||||
| 2025-07-08 | 13F | Ballew Advisors, Inc | 0 | −100,00 | 0 | |||||
| 2025-08-13 | 13F | Capital Fund Management S.a. | Call | 0 | −100,00 | 0 | −100,00 | |||
| 2025-08-04 | 13F | MeadowBrook Investment Advisors LLC | 0 | −100,00 | 0 |
Other Listings
| MX:XOP |