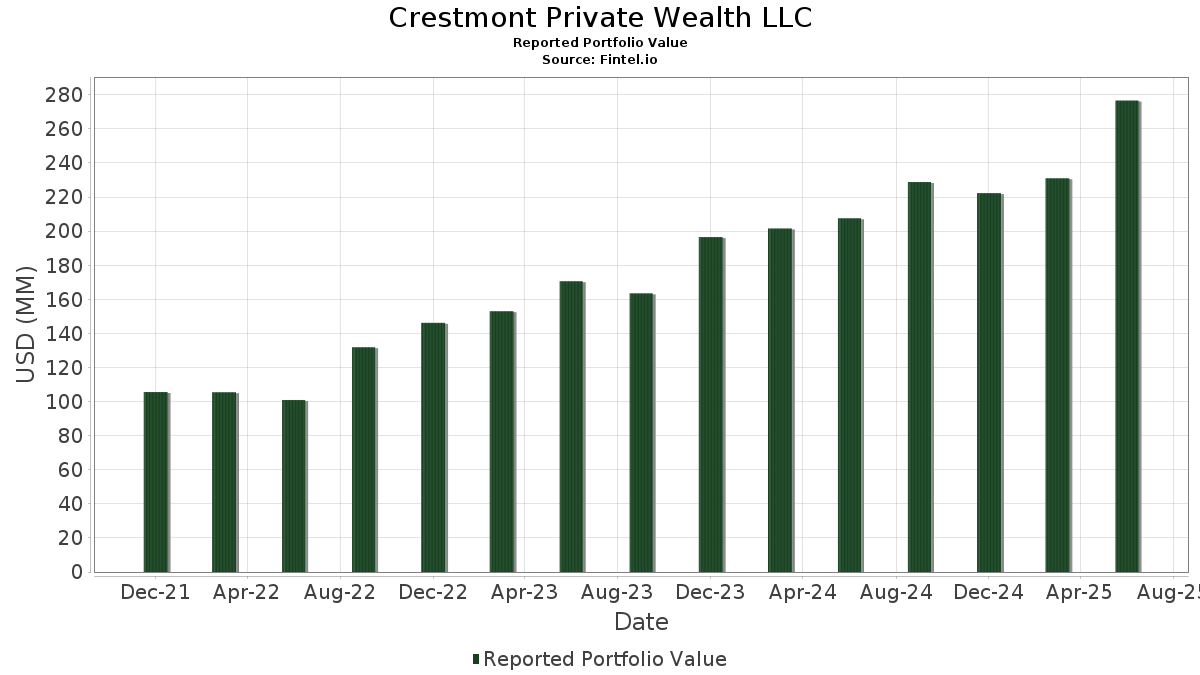
Grunnleggende statistikk
| Porteføljeverdi | $ 276 610 660 |
| Nåværende posisjoner | 83 |
Siste beholdninger, prestasjoner, forvaltet kapital (fra 13F, 13D)
Crestmont Private Wealth LLC har oppgitt 83 totale beholdninger i sine siste SEC-arkiveringer. Siste porteføljeverdi er beregnet til 276 610 660 USD. Faktisk forvaltet kapital (AUM) er denne verdien pluss kontanter (som ikke er oppgitt). Crestmont Private Wealth LLCs største beholdninger er iShares Trust - iShares Core S&P 500 ETF (US:IVV) , Vanguard Index Funds - Vanguard S&P 500 ETF (US:VOO) , PIMCO ETF Trust - PIMCO Multisector Bond Active Exchange-Traded Fund (US:PYLD) , PIMCO ETF Trust - PIMCO Active Bond Exchange-Traded Fund (US:BOND) , and Vanguard International Equity Index Funds - Vanguard FTSE Emerging Markets ETF (US:VWO) . Crestmont Private Wealth LLCs nye posisjoner inkluderer PIMCO ETF Trust - PIMCO Active Bond Exchange-Traded Fund (US:BOND) , PIMCO ETF Trust - PIMCO Intermediate Municipal Bond Active Exchange-Traded Fund (US:MUNI) , iShares Trust - iShares Russell 1000 ETF (US:IWB) , .
De største økningene dette kvartalet
Vi bruker endringen i porteføljeallokeringen fordi dette er det mest meningsfulle målet. Endringer kan skyldes handler eller endringer i aksjekursene.
| Verdipapirer | Aksjer (MM) |
Verdi (MM$) |
Portefølje % | ΔPortefølje % |
|---|---|---|---|---|
| 0,18 | 16,61 | 6,0036 | 6,0036 | |
| 0,18 | 9,30 | 3,3607 | 3,3607 | |
| 0,00 | 1,54 | 0,5551 | 0,5551 | |
| 0,00 | 0,25 | 0,0895 | 0,0895 | |
| 0,00 | 0,23 | 0,0846 | 0,0846 | |
| 0,00 | 0,23 | 0,0833 | 0,0833 | |
| 0,00 | 0,22 | 0,0800 | 0,0800 | |
| 0,00 | 0,22 | 0,0789 | 0,0789 | |
| 0,00 | 0,22 | 0,0781 | 0,0781 | |
| 0,00 | 0,21 | 0,0767 | 0,0767 |
De største reduksjonene dette kvartalet
Vi bruker endringen i porteføljeallokeringen fordi dette er det mest meningsfulle målet. Endringer kan skyldes handler eller endringer i aksjekurser.
| Verdipapirer | Aksjer (MM) |
Verdi (MM$) |
Portefølje % | ΔPortefølje % |
|---|---|---|---|---|
| 0,10 | 61,63 | 22,2790 | −2,3234 | |
| 1,09 | 28,91 | 10,4506 | −1,8657 | |
| 0,09 | 53,71 | 19,4185 | −1,1497 | |
| 0,23 | 11,61 | 4,1987 | −0,7537 | |
| 0,33 | 7,73 | 2,7928 | −0,6837 | |
| 0,19 | 10,07 | 3,6406 | −0,5257 | |
| 0,29 | 14,27 | 5,1578 | −0,4848 | |
| 0,11 | 6,96 | 2,5169 | −0,3525 | |
| 0,25 | 14,05 | 5,0776 | −0,3230 | |
| 0,04 | 4,59 | 1,6600 | −0,2835 |
13F- og Fondsarkiveringer
Dette skjemaet ble sendt inn den 2025-08-14 for rapporteringsperioden 2025-06-30. Klikk på lenkeikonet for å se hele transaksjonshistorikken.
Oppgradere for å låse opp premiedata og eksportere til Excel![]() .
.
| Verdipapirer | Type | Gjennomsnittlig aksjekurs | Aksjer (MM) |
ΔAksjer (%) |
ΔAksjer (%) |
Verdi ($MM) |
Portefølje (%) |
ΔPortefølje (%) |
|
|---|---|---|---|---|---|---|---|---|---|
| IVV / iShares Trust - iShares Core S&P 500 ETF | 0,10 | −1,87 | 61,63 | 8,44 | 22,2790 | −2,3234 | |||
| VOO / Vanguard Index Funds - Vanguard S&P 500 ETF | 0,09 | 2,28 | 53,71 | 13,05 | 19,4185 | −1,1497 | |||
| PYLD / PIMCO ETF Trust - PIMCO Multisector Bond Active Exchange-Traded Fund | 1,09 | 0,88 | 28,91 | 1,61 | 10,4506 | −1,8657 | |||
| BOND / PIMCO ETF Trust - PIMCO Active Bond Exchange-Traded Fund | 0,18 | 16,61 | 6,0036 | 6,0036 | |||||
| VWO / Vanguard International Equity Index Funds - Vanguard FTSE Emerging Markets ETF | 0,29 | 0,16 | 14,27 | 9,46 | 5,1578 | −0,4848 | |||
| VEA / Vanguard Tax-Managed Funds - Vanguard FTSE Developed Markets ETF | 0,25 | 0,38 | 14,05 | 12,59 | 5,0776 | −0,3230 | |||
| JPST / J.P. Morgan Exchange-Traded Fund Trust - JPMorgan Ultra-Short Income ETF | 0,23 | 1,42 | 11,61 | 1,52 | 4,1987 | −0,7537 | |||
| DFAT / Dimensional ETF Trust - Dimensional U.S. Targeted Value ETF | 0,19 | −0,15 | 10,07 | 4,65 | 3,6406 | −0,5257 | |||
| MUNI / PIMCO ETF Trust - PIMCO Intermediate Municipal Bond Active Exchange-Traded Fund | 0,18 | 9,30 | 3,3607 | 3,3607 | |||||
| DFAR / Dimensional ETF Trust - Dimensional US Real Estate ETF | 0,33 | −2,53 | 7,73 | −3,80 | 2,7928 | −0,6837 | |||
| IJH / iShares Trust - iShares Core S&P Mid-Cap ETF | 0,11 | −1,18 | 6,96 | 5,04 | 2,5169 | −0,3525 | |||
| IJR / iShares Trust - iShares Core S&P Small-Cap ETF | 0,04 | −2,14 | 4,59 | 2,27 | 1,6600 | −0,2835 | |||
| IBDQ / iShares Trust - iShares iBonds Dec 2025 Term Corporate ETF | 0,07 | 2,32 | 1,86 | 2,42 | 0,6731 | −0,1137 | |||
| IBTF / iShares Trust - iShares iBonds Dec 2025 Term Treasury ETF | 0,08 | 2,05 | 1,85 | 1,99 | 0,6678 | −0,1161 | |||
| IWB / iShares Trust - iShares Russell 1000 ETF | 0,00 | 1,54 | 0,5551 | 0,5551 | |||||
| V / Visa Inc. | 0,00 | 7,05 | 0,99 | 8,42 | 0,3585 | −0,0373 | |||
| GOOGL / Alphabet Inc. | 0,01 | 6,51 | 0,94 | 21,47 | 0,3396 | 0,0046 | |||
| GDXJ / VanEck ETF Trust - VanEck Junior Gold Miners ETF | 0,01 | −2,55 | 0,89 | 15,19 | 0,3210 | −0,0128 | |||
| SPGI / S&P Global Inc. | 0,00 | 2,19 | 0,89 | 5,98 | 0,3206 | −0,0414 | |||
| VRSN / VeriSign, Inc. | 0,00 | 7,80 | 0,89 | 22,71 | 0,3204 | 0,0075 | |||
| NDAQ / Nasdaq, Inc. | 0,01 | 5,86 | 0,87 | 24,86 | 0,3142 | 0,0127 | |||
| ICE / Intercontinental Exchange, Inc. | 0,00 | 6,60 | 0,82 | 13,36 | 0,2976 | −0,0167 | |||
| BRK.B / Berkshire Hathaway Inc. | 0,00 | 9,35 | 0,78 | −0,26 | 0,2813 | −0,0564 | |||
| MKL / Markel Group Inc. | 0,00 | 10,54 | 0,77 | 17,99 | 0,2802 | −0,0039 | |||
| ITW / Illinois Tool Works Inc. | 0,00 | 6,80 | 0,77 | 6,48 | 0,2794 | −0,0348 | |||
| MLI / Mueller Industries, Inc. | 0,01 | 1,99 | 0,77 | 6,50 | 0,2786 | −0,0348 | |||
| AAPL / Apple Inc. | 0,00 | 8,42 | 0,75 | 0,13 | 0,2695 | −0,0528 | |||
| DGX / Quest Diagnostics Incorporated | 0,00 | 10,38 | 0,74 | 17,25 | 0,2680 | −0,0059 | |||
| VRSK / Verisk Analytics, Inc. | 0,00 | 10,16 | 0,70 | 15,35 | 0,2528 | −0,0098 | |||
| MCO / Moody's Corporation | 0,00 | 8,48 | 0,70 | 16,89 | 0,2528 | −0,0063 | |||
| HD / The Home Depot, Inc. | 0,00 | 7,13 | 0,69 | 7,26 | 0,2509 | −0,0294 | |||
| NVDA / NVIDIA Corporation | 0,00 | −37,09 | 0,69 | −8,36 | 0,2500 | −0,0765 | |||
| AZO / AutoZone, Inc. | 0,00 | 9,88 | 0,66 | 6,97 | 0,2389 | −0,0285 | |||
| MA / Mastercard Incorporated | 0,00 | 4,47 | 0,66 | 7,01 | 0,2375 | −0,0280 | |||
| TH / Target Hospitality Corp. | 0,09 | 0,00 | 0,64 | 8,11 | 0,2316 | −0,0247 | |||
| AVGO / Broadcom Inc. | 0,00 | 1,73 | 0,63 | 67,37 | 0,2284 | 0,0651 | |||
| ROP / Roper Technologies, Inc. | 0,00 | 14,08 | 0,62 | 9,67 | 0,2258 | −0,0207 | |||
| CVX / Chevron Corporation | 0,00 | 0,00 | 0,62 | −14,48 | 0,2244 | −0,0895 | |||
| STEL / Stellar Bancorp, Inc. | 0,02 | −15,55 | 0,61 | −14,63 | 0,2198 | −0,0883 | |||
| ADSK / Autodesk, Inc. | 0,00 | 2,34 | 0,58 | 21,00 | 0,2106 | 0,0022 | |||
| QCOM / QUALCOMM Incorporated | 0,00 | 4,52 | 0,53 | 8,38 | 0,1916 | −0,0201 | |||
| NVR / NVR, Inc. | 0,00 | 10,94 | 0,52 | 13,17 | 0,1896 | −0,0111 | |||
| MSCI / MSCI Inc. | 0,00 | 12,03 | 0,52 | 14,29 | 0,1883 | −0,0090 | |||
| COP / ConocoPhillips | 0,01 | 0,02 | 0,50 | −14,55 | 0,1805 | −0,0724 | |||
| LRCX / Lam Research Corporation | 0,01 | 6,28 | 0,49 | 42,32 | 0,1776 | 0,0281 | |||
| IDXX / IDEXX Laboratories, Inc. | 0,00 | 5,46 | 0,49 | 34,63 | 0,1761 | 0,0195 | |||
| SCHX / Schwab Strategic Trust - Schwab U.S. Large-Cap ETF | 0,02 | 7,02 | 0,48 | 18,34 | 0,1753 | −0,0019 | |||
| ADBE / Adobe Inc. | 0,00 | 3,93 | 0,46 | 4,78 | 0,1666 | −0,0237 | |||
| GLD / SPDR Gold Trust | 0,00 | −2,51 | 0,44 | 3,06 | 0,1585 | −0,0255 | |||
| GDX / VanEck ETF Trust - VanEck Gold Miners ETF | 0,01 | −2,56 | 0,43 | 10,43 | 0,1571 | −0,0134 | |||
| PH / Parker-Hannifin Corporation | 0,00 | 0,00 | 0,39 | 14,87 | 0,1427 | −0,0060 | |||
| NEM / Newmont Corporation | 0,01 | −2,42 | 0,38 | 17,76 | 0,1369 | −0,0023 | |||
| CAT / Caterpillar Inc. | 0,00 | 0,33 | 0,35 | 18,18 | 0,1270 | −0,0018 | |||
| GILD / Gilead Sciences, Inc. | 0,00 | −19,52 | 0,32 | −20,35 | 0,1162 | −0,0585 | |||
| RING / iShares, Inc. - iShares MSCI Global Gold Miners ETF | 0,01 | −2,54 | 0,32 | 11,23 | 0,1147 | −0,0088 | |||
| EMR / Emerson Electric Co. | 0,00 | 0,47 | 0,31 | 22,18 | 0,1138 | 0,0023 | |||
| HAS / Hasbro, Inc. | 0,00 | 1,19 | 0,31 | 21,43 | 0,1108 | 0,0016 | |||
| NFLX / Netflix, Inc. | 0,00 | 4,65 | 0,30 | 50,50 | 0,1089 | 0,0221 | |||
| EOG / EOG Resources, Inc. | 0,00 | 0,90 | 0,30 | −5,73 | 0,1071 | −0,0292 | |||
| SNA / Snap-on Incorporated | 0,00 | 0,64 | 0,30 | −7,23 | 0,1069 | −0,0309 | |||
| PSA / Public Storage | 0,00 | 0,31 | 0,28 | −1,39 | 0,1024 | −0,0223 | |||
| PKG / Packaging Corporation of America | 0,00 | 0,47 | 0,28 | −4,44 | 0,1015 | −0,0256 | |||
| LMT / Lockheed Martin Corporation | 0,00 | 0,51 | 0,27 | 4,21 | 0,0985 | −0,0147 | |||
| PG / The Procter & Gamble Company | 0,00 | 1,73 | 0,26 | −5,07 | 0,0950 | −0,0246 | |||
| AMGN / Amgen Inc. | 0,00 | 0,55 | 0,26 | −9,86 | 0,0926 | −0,0304 | |||
| RL / Ralph Lauren Corporation | 0,00 | 0,00 | 0,25 | 24,02 | 0,0918 | 0,0033 | |||
| PRU / Prudential Financial, Inc. | 0,00 | −0,93 | 0,25 | −4,53 | 0,0915 | −0,0235 | |||
| XOM / Exxon Mobil Corporation | 0,00 | 0,00 | 0,25 | −9,39 | 0,0910 | −0,0292 | |||
| TSLA / Tesla, Inc. | 0,00 | 0,25 | 0,0895 | 0,0895 | |||||
| META / Meta Platforms, Inc. | 0,00 | 0,23 | 0,0846 | 0,0846 | |||||
| XOP / SPDR Series Trust - SPDR S&P Oil & Gas Exploration & Production ETF | 0,00 | −2,52 | 0,23 | −6,80 | 0,0844 | −0,0242 | |||
| IBM / International Business Machines Corporation | 0,00 | 0,23 | 0,0833 | 0,0833 | |||||
| LYV / Live Nation Entertainment, Inc. | 0,00 | 0,22 | 0,0800 | 0,0800 | |||||
| CBRE / CBRE Group, Inc. | 0,00 | 0,22 | 0,0789 | 0,0789 | |||||
| GE / General Electric Company | 0,00 | 0,22 | 0,0781 | 0,0781 | |||||
| JPM / JPMorgan Chase & Co. | 0,00 | 0,21 | 0,0767 | 0,0767 | |||||
| UAL / United Airlines Holdings, Inc. | 0,00 | 0,21 | 0,0761 | 0,0761 | |||||
| UPS / United Parcel Service, Inc. | 0,00 | 9,56 | 0,21 | 0,98 | 0,0748 | −0,0143 | |||
| RSG / Republic Services, Inc. | 0,00 | 0,00 | 0,21 | 1,99 | 0,0742 | −0,0131 | |||
| PSX / Phillips 66 | 0,00 | 0,00 | 0,20 | −3,35 | 0,0732 | −0,0175 | |||
| GRMN / Garmin Ltd. | 0,00 | 0,00 | 0,20 | −3,83 | 0,0729 | −0,0179 | |||
| F_KZ / Ford Motor Company | 0,01 | −1,78 | 0,12 | 6,19 | 0,0434 | −0,0055 | |||
| EGY / VAALCO Energy, Inc. | 0,01 | 0,00 | 0,04 | −4,88 | 0,0143 | −0,0035 | |||
| CTRA / Coterra Energy Inc. | 0,00 | −100,00 | 0,00 | 0,0000 | |||||
| LYB / LyondellBasell Industries N.V. | 0,00 | −100,00 | 0,00 | 0,0000 | |||||
| TPL / Texas Pacific Land Corporation | 0,00 | −100,00 | 0,00 | −100,00 | −0,1073 | ||||
| FOX / Fox Corporation | 0,00 | −100,00 | 0,00 | 0,0000 | |||||
| TMUS / T-Mobile US, Inc. | 0,00 | −100,00 | 0,00 | 0,0000 |