Grunnleggende statistikk
| Institusjonelle eiere | 280 total, 280 long only, 0 short only, 0 long/short - change of 7,28% MRQ |
| Gjennomsnittlig porteføljeallokering | 0.9311 % - change of −3,62% MRQ |
| Institusjonelle aksjer (Long) | 98 999 349 (ex 13D/G) - change of 11,08MM shares 12,60% MRQ |
| Institusjonell verdi (Long) | $ 2 682 822 USD ($1000) |
Institusjonelt eierskap og aksjonærer
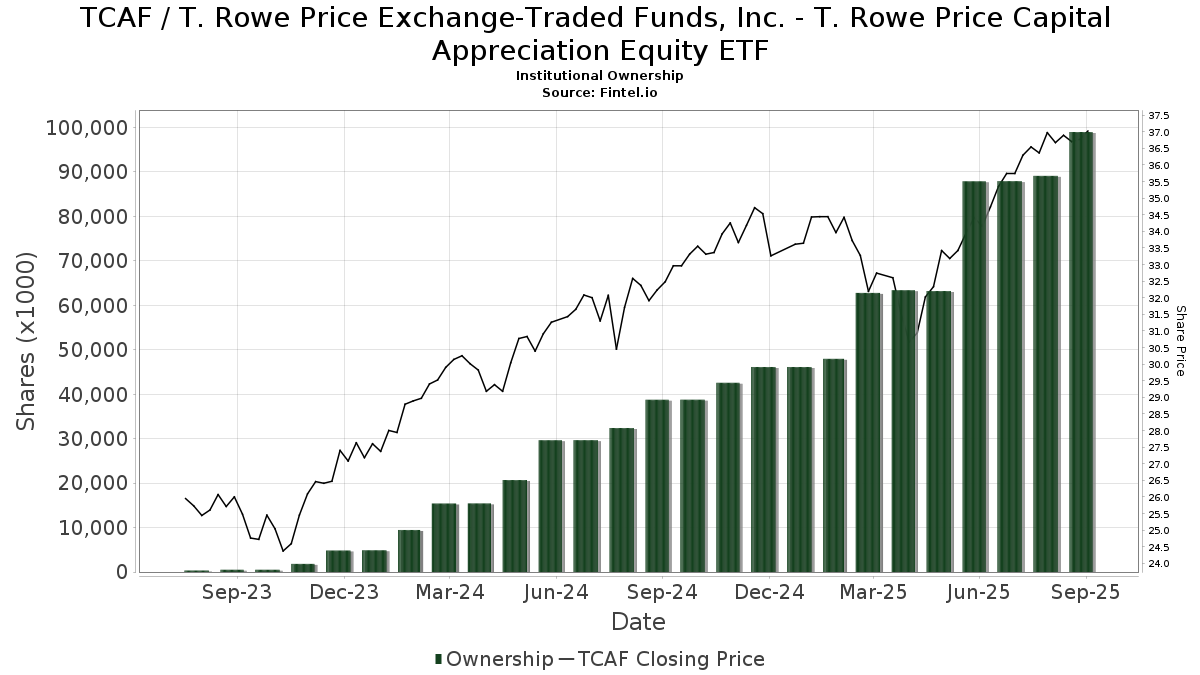
T. Rowe Price Exchange-Traded Funds, Inc. - T. Rowe Price Capital Appreciation Equity ETF (US:TCAF) har 280 institusjonelle eiere og aksjonærer som har sendt inn 13D/G- eller 13F-skjemaer til Securities Exchange Commission (SEC). Disse institusjonene eier til sammen 98,999,349 aksjer. De største aksjonærene inkluderer Price T Rowe Associates Inc /md/, LPL Financial LLC, Raymond James Financial Inc, Commonwealth Equity Services, Llc, Advisor Group Holdings, Inc., Morgan Stanley, Voya Investment Management Llc, Baird Financial Group, Inc., Wells Fargo & Company/mn, and Royal Bank Of Canada .
T. Rowe Price Exchange-Traded Funds, Inc. - T. Rowe Price Capital Appreciation Equity ETF (ARCA:TCAF) institusjonell eierstruktur viser nåværende posisjoner i selskapet fordelt på institusjoner og fond, samt de siste endringene i posisjonsstørrelse. De største aksjonærene kan være individuelle investorer, verdipapirfond, hedgefond eller institusjoner. Schedule 13D indikerer at investoren eier (eller har eid) mer enn 5 % av selskapet og har til hensikt (eller hadde til hensikt) å aktivt forfølge en endring i forretningsstrategien. Schedule 13G indikerer en passiv investering på over 5 %.
The share price as of September 10, 2025 is 36,77 / share. Previously, on September 11, 2024, the share price was 32,23 / share. This represents an increase of 14,09% over that period.
Fondssentiment-score
Fondssentiment Score (også kjent som akkumulering av eierskap poengsum) viser hvilke aksjer som er mest kjøpt av fond. Den er resultatet av en sofistikert, kvantitativ flerfaktormodell som identifiserer selskaper med de høyeste nivåene av institusjonell akkumulering. Beregningsmodellen for poeng bruker en kombinasjon av den totale økningen i antall offentliggjorte eiere, endringer i porteføljeallokeringen til disse eierne og andre beregninger. Tallet går fra 0 til 100, der høyere tall indikerer en høyere grad av akkumulering i forhold til sammenlignbare selskaper, der 50 er gjennomsnittet.
Oppdateringsfrekvens: Daglig
Sjekk ut Ownership Explorer, som inneholder en liste over de høyest rangerte selskapene.
Institusjonell Put/Call-forhold
I tillegg til å rapportere standard aksje- og gjeldsemisjoner må institusjoner med mer enn 100 millioner kroner i forvaltningskapital også oppgi beholdningen av put- og callopsjoner. Siden put-opsjoner generelt indikerer et negativt sentiment, og call-opsjoner indikerer et positivt sentiment, kan vi få et inntrykk av det generelle institusjonelle sentimentet ved å plotte forholdet mellom put- og call-opsjoner. Diagrammet til høyre viser det historiske forholdet mellom put- og call-opsjoner for dette instrumentet.
Ved å bruke Put/Call-forholdet som en indikator på investorsentimentet kan man overvinne en av de viktigste svakhetene ved å bruke totalt institusjonelt eierskap, nemlig at en betydelig andel av forvaltningskapitalen investeres passivt for å følge indekser. Passivt forvaltede fond kjøper vanligvis ikke opsjoner, slik at indikatoren for put/call-forhold i større grad gjenspeiler stemningen i aktivt forvaltede fond.
13F- og NPORT-arkiveringer
Detaljer om 13F-arkiveringer er gratis. Detaljer om NP-arkiveringer krever et premium-medlemskap. Grønne rader indikerer nye posisjoner. Røde rader indikerer lukkede posisjoner. Klikk på lenke ikonet for å se hele transaksjonshistorikken.
Oppgrader
for å låse opp premiedata og eksportere til Excel. ![]() .
.
| Fildato | Kilde | Investor | Type | Gjennomsnittlig pris (estimert) |
Aksjer | Δ Aksjer (%) |
Rapportert verdi ($1000) | Verdi (%) | Portallokering (%) | |
|---|---|---|---|---|---|---|---|---|---|---|
| 2025-08-01 | 13F | Liberty Wealth Management Llc | 109 914 | 0,14 | 3 878 | 9,37 | ||||
| 2025-08-05 | 13F | Plante Moran Financial Advisors, LLC | 0 | −100,00 | 0 | |||||
| 2025-08-14 | 13F | Hrt Financial Lp | 0 | −100,00 | 0 | |||||
| 2025-07-17 | 13F | Janney Montgomery Scott LLC | 397 391 | 3,86 | 14 | 16,67 | ||||
| 2025-07-29 | 13F | Stratos Wealth Partners, LTD. | 103 040 | 17,49 | 3 635 | 28,40 | ||||
| 2025-07-14 | 13F | Southland Equity Partners LLC | 134 514 | 1,28 | 4 746 | 10,68 | ||||
| 2025-08-04 | 13F | 4J Wealth Management LLC | 254 467 | 1,12 | 8 978 | 10,51 | ||||
| 2025-08-13 | 13F | Legacy Capital Wealth Partners, LLC | 48 587 | −2,16 | 1 714 | 6,92 | ||||
| 2025-07-24 | 13F | Financial Connections Group, Inc. | 3 501 | 0,00 | 0 | |||||
| 2025-07-29 | 13F | Wingate Wealth Advisors, Inc. | 88 772 | −2,97 | 3 132 | 6,03 | ||||
| 2025-07-25 | 13F | Envestnet Portfolio Solutions, Inc. | 29 395 | −40,54 | 1 037 | −34,98 | ||||
| 2025-08-08 | 13F | Cetera Investment Advisers | 777 031 | 12,89 | 27 414 | 23,38 | ||||
| 2025-07-10 | 13F | ARS Wealth Advisors Group, LLC | 319 889 | 18,94 | 11 286 | 30,00 | ||||
| 2025-05-13 | 13F | Freestone Capital Holdings, LLC | 0 | −100,00 | 0 | |||||
| 2025-08-14 | 13F | UBS Group AG | 679 837 | 38,10 | 23 985 | 50,94 | ||||
| 2025-07-30 | 13F | Roman Butler Fullerton & Co | 13 495 | 42,08 | 495 | 67,23 | ||||
| 2025-07-28 | 13F | Holistic Planning, LLC | 12 649 | 446 | ||||||
| 2025-08-14 | 13F | Raymond James Financial Inc | 5 351 355 | 19,28 | 188 796 | 30,37 | ||||
| 2025-08-05 | 13F | Tsfg, Llc | 17 737 | 0,00 | 1 | |||||
| 2025-08-06 | 13F | Souders Financial Advisors | 726 645 | 14,39 | 25 636 | 25,03 | ||||
| 2025-08-12 | 13F | MAI Capital Management | 48 527 | −5,94 | 1 712 | 2,82 | ||||
| 2025-07-15 | 13F | Cora Capital Advisors Llc | 812 962 | 2,58 | 28 681 | 12,11 | ||||
| 2025-07-22 | 13F | Gutierrez Wealth Advisory, LLC | 17 585 | 39,50 | 620 | 52,71 | ||||
| 2025-07-10 | 13F | Exchange Traded Concepts, Llc | 165 726 | 24,53 | 5 847 | 36,11 | ||||
| 2025-07-28 | 13F | Sagespring Wealth Partners, Llc | 19 388 | −0,79 | 684 | 8,57 | ||||
| 2025-07-09 | 13F | Lincoln Capital Corp | 77 134 | 3,15 | 2 721 | 12,76 | ||||
| 2025-08-07 | 13F | Flagship Wealth Advisors, Llc | 16 638 | 0,00 | 587 | 9,12 | ||||
| 2025-05-16 | 13F/A | Goldman Sachs Group Inc | 0 | −100,00 | 0 | −100,00 | ||||
| 2025-07-18 | 13F | Parsons Capital Management Inc/ri | 320 407 | −0,17 | 11 304 | 9,10 | ||||
| 2025-07-29 | 13F | Stratos Wealth Advisors, LLC | 160 080 | 2,52 | 5 648 | 12,04 | ||||
| 2025-08-08 | 13F | Wealth Alliance | 25 392 | 37,92 | 896 | 50,67 | ||||
| 2025-08-05 | 13F | Carson Advisory Inc. | 165 144 | 3,14 | 5 826 | 12,73 | ||||
| 2025-08-18 | 13F | Geneos Wealth Management Inc. | 1 595 | 243,01 | 56 | 273,33 | ||||
| 2025-08-11 | 13F | Lighthouse Financial LLC | 99 619 | 12,53 | 3 515 | 23,00 | ||||
| 2025-07-11 | 13F | SILVER OAK SECURITIES, Inc | 0 | −100,00 | 0 | |||||
| 2025-07-21 | 13F | Pacific Financial Group Inc | 6 057 | 214 | ||||||
| 2025-08-14 | 13F | Ameriprise Financial Inc | 6 510 | −64,12 | 230 | −60,85 | ||||
| 2025-07-14 | 13F | CJM Wealth Advisers, Ltd. | 46 515 | −1,85 | 1 641 | 7,33 | ||||
| 2025-07-11 | 13F | Ttp Investments, Inc. | 1 653 432 | 50,56 | 58 333 | 64,56 | ||||
| 2025-07-15 | 13F | McCarthy & Cox | 1 026 419 | 1,03 | 36 212 | 10,42 | ||||
| 2025-08-11 | 13F | Forge Financial Services LLC | 290 328 | 15,49 | 10 344 | 27,48 | ||||
| 2025-07-25 | 13F | Apollon Wealth Management, LLC | 15 071 | 532 | ||||||
| 2025-07-21 | 13F | Ameriflex Group, Inc. | 1 850 | −78,09 | 65 | −76,47 | ||||
| 2025-08-04 | 13F | Flagship Harbor Advisors, Llc | 14 455 | 34,13 | 510 | 46,69 | ||||
| 2025-08-14 | 13F | Susquehanna International Group, Llp | 0 | −100,00 | 0 | |||||
| 2025-07-10 | 13F | Wealth Enhancement Advisory Services, Llc | 1 779 596 | 5,68 | 63 389 | 16,61 | ||||
| 2025-07-21 | 13F | Tanglewood Wealth Management, Inc. | 127 588 | 3,78 | 4 501 | 13,43 | ||||
| 2025-08-12 | 13F/A | Cozad Asset Management Inc | 20 978 | 30,76 | 740 | 43,13 | ||||
| 2025-08-15 | 13F | Captrust Financial Advisors | 215 602 | 301,24 | 7 606 | 338,64 | ||||
| 2025-08-11 | 13F | Western Wealth Management, LLC | 10 620 | 375 | ||||||
| 2025-07-24 | 13F | Us Bancorp \de\ | 221 | 8 | ||||||
| 2025-07-18 | 13F | Consolidated Planning Corp | 1 355 981 | −1,46 | 47 839 | 7,69 | ||||
| 2025-07-24 | 13F | MSH Capital Advisors LLC | 19 881 | −6,75 | 701 | 1,89 | ||||
| 2025-08-14 | 13F | Mercer Global Advisors Inc /adv | 77 955 | 7,06 | 2 750 | 17,02 | ||||
| 2025-08-08 | 13F | Comprehensive Financial Planning, Inc./PA | 21 335 | 4,40 | 753 | 14,11 | ||||
| 2025-07-22 | 13F | Beacon Financial Advisory LLC | 205 303 | 16,14 | 7 243 | 26,94 | ||||
| 2025-08-05 | 13F | Atlas Wealth LLC | 92 197 | 121,20 | 3 250 | 141,56 | ||||
| 2025-08-12 | 13F | LPL Financial LLC | 10 728 693 | 22,05 | 378 508 | 33,40 | ||||
| 2025-08-13 | 13F | Ted Buchan & Co | 10 082 | 0,00 | 356 | 9,23 | ||||
| 2025-07-11 | 13F | Diversified Trust Co | 89 748 | 3 166 | ||||||
| 2025-07-30 | 13F | Studio Investment Management Llc | 32 144 | 0,26 | 1 134 | 9,67 | ||||
| 2025-08-06 | 13F | Prospera Financial Services Inc | 337 087 | 0,65 | 11 899 | 10,00 | ||||
| 2025-07-14 | 13F | Harbor Group, Inc. | 40 697 | 165,85 | 1 436 | 190,49 | ||||
| 2025-08-13 | 13F | Capital Analysts, Inc. | 283 743 | 85,98 | 10 | 150,00 | ||||
| 2025-08-14 | 13F | London & Capital Asset Management Ltd | 10 101 | 356 | ||||||
| 2025-07-11 | 13F | Compass Ion Advisors, LLC | 79 621 | −11,02 | 2 809 | −2,74 | ||||
| 2025-08-06 | 13F | Centerpoint Advisory Group | 97 734 | 2,87 | 3 448 | 12,46 | ||||
| 2025-08-12 | 13F | XTX Topco Ltd | 6 637 | 234 | ||||||
| 2025-08-05 | 13F | GPS Wealth Strategies Group, LLC | 3 573 | 51,33 | 126 | 65,79 | ||||
| 2025-08-08 | 13F | Tortoise Investment Management, LLC | 1 014 | 0,00 | 36 | 9,38 | ||||
| 2025-08-13 | 13F | CMC Financial Group | 13 892 | −3,34 | 490 | 5,83 | ||||
| 2025-08-14 | 13F | Wells Fargo & Company/mn | 2 600 129 | −8,34 | 91 733 | 0,18 | ||||
| 2025-08-14 | 13F | Gotham Asset Management, LLC | 22 730 | 0,00 | 802 | 9,28 | ||||
| 2025-08-06 | 13F | Mark Sheptoff Financial Planning, Llc | 89 | 0,00 | 3 | 50,00 | ||||
| 2025-08-05 | 13F | Strategic Financial Concepts, LLC | 105 671 | 8,12 | 3 728 | 18,20 | ||||
| 2025-08-11 | 13F | Annis Gardner Whiting Capital Advisors, LLC | 9 936 | 0,65 | 351 | 10,06 | ||||
| 2025-07-11 | 13F | Bond & Devick Financial Network, Inc. | 5 847 | 206 | ||||||
| 2025-07-17 | 13F | ERn Financial, LLC | 0 | −100,00 | 0 | |||||
| 2025-08-13 | 13F | Per Stirling Capital Management, LLC. | 27 513 | −27,81 | 971 | −21,14 | ||||
| 2025-08-14 | 13F | Comerica Bank | 60 657 | −1,56 | 2 140 | 7,54 | ||||
| 2025-07-29 | 13F | Private Trust Co Na | 14 661 | 14,65 | 517 | 25,49 | ||||
| 2025-08-14 | 13F | Modern Wealth Management, LLC | 1 278 309 | 1,15 | 45 099 | 10,55 | ||||
| 2025-04-25 | 13F | Verity Asset Management, Inc. | 0 | −100,00 | 0 | |||||
| 2025-07-24 | 13F | Financial Security Advisor, Inc. | 172 742 | −1,29 | 6 094 | 7,90 | ||||
| 2025-07-14 | 13F | CRA Financial Services, LLC | 62 642 | 9,96 | 2 210 | 20,24 | ||||
| 2025-07-25 | 13F | Hazlett, Burt & Watson, Inc. | 17 440 | 6 359,26 | 1 | |||||
| 2025-08-19 | 13F | Advisory Services Network, LLC | 129 390 | 4,24 | 4 741 | 18,32 | ||||
| 2025-07-25 | 13F | Northwest Capital Management Inc | 0 | −100,00 | 0 | |||||
| 2025-08-05 | 13F | Atlas Wealth Partners, LLC | 8 193 | −4,65 | 0 | |||||
| 2025-08-14 | 13F | Warren Averett Asset Management, LLC | 260 137 | 3,53 | 9 178 | 13,16 | ||||
| 2025-05-01 | 13F | Iron Horse Wealth Management, LLC | 0 | −100,00 | 0 | |||||
| 2025-07-29 | 13F | Arcus Capital Partners, LLC | 311 329 | −27,98 | 10 984 | −21,29 | ||||
| 2025-08-08 | 13F | Sittner & Nelson, Llc | 22 359 | 17,83 | 789 | 28,76 | ||||
| 2025-08-14 | 13F | Jane Street Group, Llc | 26 199 | 924 | ||||||
| 2025-08-14 | 13F | Voya Investment Management Llc | 2 762 859 | −0,79 | 97 474 | 8,43 | ||||
| 2025-08-08 | 13F | Avantax Advisory Services, Inc. | 44 651 | 56,35 | 1 575 | 71,01 | ||||
| 2025-08-11 | 13F | United Advisor Group, LLC | 21 617 | 232,06 | 763 | 262,86 | ||||
| 2025-08-13 | 13F | Baird Financial Group, Inc. | 2 725 494 | 7,71 | 96 155 | 17,72 | ||||
| 2025-08-11 | 13F | Principal Securities, Inc. | 48 958 | −2,92 | 1 727 | 2,98 | ||||
| 2025-08-06 | 13F | Legacy Investment Solutions, LLC | 677 | 0,00 | 24 | 0,00 | ||||
| 2025-08-06 | 13F | Wedbush Securities Inc | 74 465 | 11,58 | 3 | 0,00 | ||||
| 2025-07-07 | 13F | OMNI 360 Wealth, Inc. | 33 434 | 15,22 | 1 180 | 25,96 | ||||
| 2025-07-25 | 13F | Atria Wealth Solutions, Inc. | 379 262 | 15,04 | 13 498 | 26,84 | ||||
| 2025-07-21 | 13F | Ameritas Advisory Services, LLC | 4 945 | −56,89 | 174 | −53,60 | ||||
| 2025-08-14 | 13F | Sunbelt Securities, Inc. | 56 618 | 4,65 | 1 884 | 7,85 | ||||
| 2025-08-27 | NP | JNL SERIES TRUST - JNL iShares Tactical Moderate Fund (A) | 288 076 | 0,03 | 10 163 | 9,33 | ||||
| 2025-08-14 | 13F | Guardian Wealth Advisors, Llc / Nc | 12 285 | 0,00 | 433 | 9,34 | ||||
| 2025-07-16 | 13F | Essex Financial Services, Inc. | 147 281 | 15,72 | 5 196 | 26,48 | ||||
| 2025-08-14 | 13F/A | Rockefeller Capital Management L.P. | 319 921 | 6,61 | 11 287 | 16,51 | ||||
| 2025-08-08 | 13F | Pnc Financial Services Group, Inc. | 233 | 8 | ||||||
| 2025-08-07 | 13F | Allworth Financial LP | 269 620 | 1,93 | 9 512 | 13,77 | ||||
| 2025-08-12 | 13F | Weaver Consulting Group | 51 021 | 11,72 | 1 800 | 22,12 | ||||
| 2025-07-15 | 13F | DKM Wealth Management, Inc. | 387 863 | −1,51 | 13 684 | 7,65 | ||||
| 2025-07-25 | 13F | Concurrent Investment Advisors, LLC | 61 446 | 96,71 | 2 168 | 114,98 | ||||
| 2025-07-22 | 13F | Macroview Investment Management Llc | 15 972 | −1,41 | 563 | 7,85 | ||||
| 2025-07-21 | 13F | Warner Financial, Inc | 34 804 | 0,10 | 1 | 0,00 | ||||
| 2025-07-30 | 13F | Strategic Blueprint, LLC | 6 725 | −56,31 | 237 | −52,22 | ||||
| 2025-08-08 | 13F | Good Life Advisors, LLC | 83 999 | −4,94 | 2 963 | 3,89 | ||||
| 2025-07-31 | 13F | Cambridge Investment Research Advisors, Inc. | 1 765 583 | 6,11 | 62 | 16,98 | ||||
| 2025-08-14 | 13F | NCM Capital Management, LLC | 169 122 | 12,82 | 5 974 | 23,46 | ||||
| 2025-08-14 | 13F | Colony Group, LLC | 20 733 | 731 | ||||||
| 2025-08-15 | 13F | CI Private Wealth, LLC | 191 700 | 128,98 | 6 763 | 150,30 | ||||
| 2025-08-04 | 13F | IFG Advisory, LLC | 299 794 | 505,22 | 10 577 | 561,83 | ||||
| 2025-08-14 | 13F | D. E. Shaw & Co., Inc. | 7 856 | 277 | ||||||
| 2025-08-14 | 13F | Benjamin Edwards Inc | 62 019 | 511,99 | 2 188 | 569,11 | ||||
| 2025-08-11 | 13F | Aptus Capital Advisors, LLC | 12 360 | −0,20 | 436 | 9,27 | ||||
| 2025-04-23 | 13F | Creative Financial Designs Inc /adv | 0 | −100,00 | 0 | |||||
| 2025-07-22 | 13F | Confluence Wealth Services, Inc. | 6 615 | 233 | ||||||
| 2025-07-16 | 13F | Beaumont Financial Advisors, LLC | 551 269 | −2,94 | 19 449 | 6,08 | ||||
| 2025-08-13 | 13F | Certior Financial Group, Llc | 209 668 | 6,12 | 7 397 | 15,99 | ||||
| 2025-08-04 | 13F | Pensionmark Financial Group, Llc | 231 101 | 11,36 | 8 153 | 21,70 | ||||
| 2025-07-23 | 13F | GGM Financials LLC | 0 | −100,00 | 0 | |||||
| 2025-08-12 | 13F | J.w. Cole Advisors, Inc. | 43 884 | 83,98 | 1 548 | 101,30 | ||||
| 2025-07-25 | 13F | Priebe Wealth Holdings LLC | 16 300 | −8,43 | 575 | 0,17 | ||||
| 2025-08-05 | 13F | Carolinas Wealth Consulting Llc | 0 | −100,00 | 0 | −100,00 | ||||
| 2025-08-07 | 13F | Summit Asset Management, LLC | 6 981 | 0,00 | 246 | 9,33 | ||||
| 2025-07-18 | 13F | Truist Financial Corp | 81 822 | 7,92 | 2 887 | 17,94 | ||||
| 2025-05-01 | 13F | Grant/GrossMendelsohn, LLC | 248 089 | −9,19 | 7 879 | −13,30 | ||||
| 2025-07-22 | 13F | Miracle Mile Advisors, LLC | 358 277 | 12,04 | 12 640 | 22,46 | ||||
| 2025-08-14 | 13F | Marathon Capital Management | 8 775 | −9,30 | 310 | −0,96 | ||||
| 2025-08-15 | 13F | Kestra Advisory Services, LLC | 467 657 | 87,19 | 16 499 | 104,59 | ||||
| 2025-07-10 | 13F | Redhawk Wealth Advisors, Inc. | 41 365 | −0,33 | 1 459 | 8,96 | ||||
| 2025-07-17 | 13F | Sfm, Llc | 102 166 | 0,08 | 3 604 | 9,38 | ||||
| 2025-08-12 | 13F | Winnow Wealth Llc | 3 450 | 122 | ||||||
| 2025-07-23 | 13F | Capital Management Associates, Inc | 5 818 | 205 | ||||||
| 2025-08-14 | 13F | Qube Research & Technologies Ltd | 39 632 | 1 398 | ||||||
| 2025-07-17 | 13F | Patton Albertson Miller Group, Llc | 141 589 | −0,38 | 4 995 | 8,87 | ||||
| 2025-08-27 | NP | JNL SERIES TRUST - JNL iShares Tactical Moderate Growth Fund (I) | 659 779 | −0,16 | 23 277 | 9,12 | ||||
| 2025-08-08 | 13F | Fortis Group Advisors, LLC | 190 943 | −44,11 | 6 996 | −36,57 | ||||
| 2025-07-18 | 13F | Midwest Financial Group LLC | 11 344 | 29,56 | 400 | 41,84 | ||||
| 2025-07-30 | 13F | Schaper Benz & Wise Investment Counsel Inc/wi | 29 595 | 11,51 | 1 044 | 21,96 | ||||
| 2025-08-08 | 13F | Thoroughbred Financial Services, Llc | 90 911 | 63,98 | 3 | 200,00 | ||||
| 2025-07-29 | 13F | AssuredPartners Investment Advisors, LLC | 6 012 | 212 | ||||||
| 2025-07-30 | 13F | Bogart Wealth, LLC | 500 | 0,00 | 18 | 6,25 | ||||
| 2025-08-13 | 13F | Harfst & Associates, Inc. | 310 372 | 148,31 | 10 950 | 171,42 | ||||
| 2025-08-06 | 13F | Bensler, LLC | 9 067 | 320 | ||||||
| 2025-07-24 | 13F | Eastern Bank | 397 629 | 4,44 | 14 028 | 14,14 | ||||
| 2025-08-08 | 13F | MTM Investment Management, LLC | 288 967 | 35,61 | 10 195 | 47,65 | ||||
| 2025-08-18 | 13F | N.E.W. Advisory Services LLC | 28 643 | 1 011 | ||||||
| 2025-04-22 | 13F | World Equity Group, Inc. | 0 | −100,00 | 0 | |||||
| 2025-07-10 | 13F | High Net Worth Advisory Group LLC | 73 101 | −0,68 | 2 579 | 8,59 | ||||
| 2025-08-14 | 13F | GWM Advisors LLC | 89 066 | 4,76 | 3 142 | 14,50 | ||||
| 2025-07-11 | 13F | Sprinkle Financial Consultants LLC | 114 722 | 31,43 | 4 047 | 43,66 | ||||
| 2025-08-05 | 13F | Dahring | Cusmano Llc | 73 875 | −0,40 | 2 606 | 8,86 | ||||
| 2025-08-12 | 13F | OneAscent Financial Services LLC | 24 085 | 116,92 | 1 | |||||
| 2025-08-11 | 13F | Private Advisor Group, LLC | 577 628 | 7,28 | 20 379 | 17,26 | ||||
| 2025-08-13 | 13F | Keystone Financial Group | 240 362 | 7,23 | 8 480 | 17,19 | ||||
| 2025-08-06 | 13F | ORBA Wealth Advisors, L.L.C. | 54 138 | −47,67 | 1 910 | −42,83 | ||||
| 2025-07-01 | 13F | Private Client Services, Llc | 8 422 | −0,24 | 297 | 9,19 | ||||
| 2025-08-12 | 13F | Argent Trust Co | 13 768 | 16,23 | 486 | 26,96 | ||||
| 2025-08-14 | 13F | Aqr Capital Management Llc | 9 400 | 332 | ||||||
| 2025-07-24 | 13F | Jfs Wealth Advisors, Llc | 12 750 | 8,51 | 450 | 18,47 | ||||
| 2025-08-13 | 13F | WCG Wealth Advisors LLC | 128 687 | 33,67 | 4 540 | 46,12 | ||||
| 2025-05-15 | 13F | National Wealth Management Group, LLC | 317 222 | 5,56 | 10 240 | 2,42 | ||||
| 2025-07-30 | 13F | Principle Wealth Partners Llc | 334 480 | 1,64 | 11 800 | 11,09 | ||||
| 2025-08-18 | 13F | Tyler-Stone Wealth Management | 5 681 | 200 | ||||||
| 2025-08-12 | 13F | Ade, Llc | 509 206 | 4,16 | 17 965 | 13,83 | ||||
| 2025-08-04 | 13F | Mayflower Financial Advisors, LLC | 37 804 | 0,00 | 1 334 | 9,26 | ||||
| 2025-07-17 | 13F | Presper Financial Architects, LLC | 140 321 | 5 | ||||||
| 2025-08-07 | 13F | Kestra Private Wealth Services, Llc | 16 147 | 570 | ||||||
| 2025-08-14 | 13F | PYA Waltman Capital, LLC | 723 196 | 2,90 | 25 514 | 12,46 | ||||
| 2025-07-17 | 13F | Eclectic Associates Inc /adv | 99 765 | 38,12 | 3 520 | 50,97 | ||||
| 2025-08-08 | 13F | Capital Investment Advisory Services, LLC | 89 271 | 41,14 | 3 149 | 54,29 | ||||
| 2025-07-31 | 13F | Glass Jacobson Investment Advisors llc | 1 250 | 3,39 | 44 | 10,00 | ||||
| 2025-08-19 | 13F | Cape Investment Advisory, Inc. | 138 | 0,00 | 5 | 0,00 | ||||
| 2025-08-14 | 13F | Menora Mivtachim Holdings Ltd. | 325 727 | 54,36 | 11 492 | 68,71 | ||||
| 2025-08-04 | 13F | Northwest Financial Advisors | 15 606 | −7,17 | 551 | 1,48 | ||||
| 2025-08-05 | 13F | Sigma Planning Corp | 89 730 | 12,91 | 3 166 | 23,39 | ||||
| 2025-07-15 | 13F | Aspire Capital Advisors LLC | 7 125 | 251 | ||||||
| 2025-08-14 | 13F | Garden State Investment Advisory Services LLC | 206 666 | −6,91 | 7 295 | 1,73 | ||||
| 2025-07-28 | 13F | WealthPLAN Partners, LLC | 75 266 | 2,04 | 2 655 | 11,55 | ||||
| 2025-08-13 | 13F | Brown Advisory Inc | 6 124 | 216 | ||||||
| 2025-08-14 | 13F | Bank Of America Corp /de/ | 1 210 150 | 10,79 | 42 694 | 21,09 | ||||
| 2025-08-04 | 13F | Mesirow Financial Investment Management, Inc. | 973 312 | 10,28 | 34 339 | 20,53 | ||||
| 2025-08-12 | 13F | Accordant Advisory Group Inc | 3 450 | 122 | ||||||
| 2025-08-14 | 13F | Stifel Financial Corp | 1 397 256 | 82,11 | 49 295 | 99,04 | ||||
| 2025-04-25 | 13F | MidAtlantic Capital Management, Inc. | 0 | −100,00 | 0 | |||||
| 2025-08-14 | 13F | Great Valley Advisor Group, Inc. | 595 164 | 56,56 | 20 997 | 71,12 | ||||
| 2025-08-27 | NP | JNL SERIES TRUST - JNL iShares Tactical Growth Fund (A) | 856 138 | 0,59 | 30 205 | 9,94 | ||||
| 2025-07-10 | 13F | Sharkey, Howes & Javer | 146 498 | −5,08 | 5 168 | 3,75 | ||||
| 2025-07-30 | 13F | Onyx Bridge Wealth Group LLC | 279 053 | 5,43 | 9 845 | 15,23 | ||||
| 2025-08-08 | 13F | KM Capital Management Ltd. | 7 560 | 0,00 | 267 | 9,02 | ||||
| 2025-08-12 | 13F | Jpmorgan Chase & Co | 58 087 | 2 049 | ||||||
| 2025-08-13 | 13F | Level Four Advisory Services, Llc | 914 706 | 2,47 | 32 271 | 11,99 | ||||
| 2025-07-22 | 13F | Merit Financial Group, LLC | 82 600 | −13,98 | 2 914 | −5,97 | ||||
| 2025-07-10 | 13F | Focus Financial Network, Inc. | 111 106 | −2,15 | 3 920 | 6,93 | ||||
| 2025-07-11 | 13F | Farther Finance Advisors, LLC | 2 083 | 4,41 | 73 | 14,06 | ||||
| 2025-08-06 | 13F | Founders Financial Securities Llc | 45 358 | 1 600 | ||||||
| 2025-08-13 | 13F | Cary Street Partners Financial Llc | 52 091 | −3,79 | 1 838 | 5,15 | ||||
| 2025-08-13 | 13F | Vermillion & White Wealth Management Group, LLC | 273 | 18,70 | 10 | 28,57 | ||||
| 2025-08-14 | 13F | Mariner, LLC | 89 104 | 0,97 | 3 144 | 10,36 | ||||
| 2025-07-10 | 13F | American Financial Advisors, LLC | 31 429 | 110,35 | 1 109 | 129,88 | ||||
| 2025-07-25 | 13F | Apollon Financial, LLC | 19 160 | 4,07 | 676 | 13,64 | ||||
| 2025-08-04 | 13F | Atria Investments Llc | 13 265 | 18,93 | 468 | 29,72 | ||||
| 2025-07-30 | 13F | Cornerstone Advisory, LLC | 537 301 | −1,79 | 18 956 | 8,07 | ||||
| 2025-08-14 | 13F | Royal Bank Of Canada | 2 133 941 | 15,57 | 75 285 | 26,31 | ||||
| 2025-07-24 | 13F | Ronald Blue Trust, Inc. | 0 | −100,00 | 0 | |||||
| 2025-08-12 | 13F | Steward Partners Investment Advisory, Llc | 3 653 | 13,80 | 129 | 24,27 | ||||
| 2025-07-07 | 13F | Global Wealth Strategies & Associates | 800 | 0,00 | 28 | 12,00 | ||||
| 2025-08-15 | 13F | Sugar Maple Asset Management, LLC | 99 059 | 45,10 | 3 495 | 58,60 | ||||
| 2025-08-12 | 13F | Founders Financial Alliance, LLC | 8 709 | 9,42 | 307 | 19,92 | ||||
| 2025-08-04 | 13F | HBK Sorce Advisory LLC | 0 | −100,00 | 0 | |||||
| 2025-08-05 | 13F | Westside Investment Management, Inc. | 17 945 | 3,58 | 633 | 13,24 | ||||
| 2025-05-15 | 13F | Tower Research Capital LLC (TRC) | 0 | −100,00 | 0 | |||||
| 2025-05-14 | 13F | Congress Wealth Management LLC / DE / | 0 | −100,00 | 0 | |||||
| 2025-09-09 | 13F | NWF Advisory Services Inc. | 8 226 | 290 | ||||||
| 2025-07-28 | 13F | Harbour Investments, Inc. | 17 360 | 4,95 | 612 | 14,82 | ||||
| 2025-07-18 | 13F | First Pacific Financial | 459 | 16 | ||||||
| 2025-07-14 | 13F | AdvisorNet Financial, Inc | 39 660 | 5,55 | 1 399 | 15,43 | ||||
| 2025-07-28 | 13F | Axxcess Wealth Management, Llc | 13 560 | 67,51 | 478 | 83,14 | ||||
| 2025-08-14 | 13F | Citadel Advisors Llc | 41 803 | 18,13 | 1 475 | 29,07 | ||||
| 2025-08-04 | 13F | Ledyard National Bank | 221 367 | 3,02 | 7 810 | 12,59 | ||||
| 2025-08-04 | 13F | Bay Colony Advisory Group, Inc d/b/a Bay Colony Advisors | 11 155 | 1,96 | 394 | 11,65 | ||||
| 2025-08-14 | 13F | Integrated Wealth Concepts LLC | 124 740 | 5,45 | 4 401 | 15,24 | ||||
| 2025-08-07 | 13F | Rollins Financial Advisors, LLC | 9 678 | 341 | ||||||
| 2025-07-11 | 13F | Annex Advisory Services, LLC | 8 121 | 287 | ||||||
| 2025-07-23 | 13F | Seamount Financial Group Inc | 47 116 | 5,30 | 1 662 | 15,10 | ||||
| 2025-08-14 | 13F | Price T Rowe Associates Inc /md/ | 15 517 215 | 13,90 | 547 | 24,60 | ||||
| 2025-07-30 | 13F | CMG Global Holdings, LLC | 52 636 | 1 928 | ||||||
| 2025-07-25 | 13F | Cwm, Llc | 52 026 | 7,86 | 2 | 0,00 | ||||
| 2025-08-07 | 13F | PCG Wealth Advisors, LLC | 0 | −100,00 | 0 | |||||
| 2025-05-14 | 13F | Paces Ferry Wealth Advisors, Llc | 0 | −100,00 | 0 | |||||
| 2025-07-31 | 13F | McCarthy Asset Management, Inc. | 539 671 | −1,36 | 19 040 | 7,81 | ||||
| 2025-08-14 | 13F | IHT Wealth Management, LLC | 14 976 | 7,32 | 528 | 17,33 | ||||
| 2025-08-15 | 13F | Morgan Stanley | 2 774 738 | 121,85 | 97 893 | 142,47 | ||||
| 2025-08-11 | 13F | Regal Investment Advisors LLC | 49 608 | 10,25 | 1 750 | 20,52 | ||||
| 2025-08-12 | 13F | Global Retirement Partners, LLC | 182 967 | −0,56 | 6 455 | 5,46 | ||||
| 2025-05-12 | 13F | Independent Advisor Alliance | 0 | −100,00 | 0 | |||||
| 2025-08-06 | 13F | Legacy Wealth Managment, LLC/ID | 677 | 0,00 | 24 | 9,52 | ||||
| 2025-08-13 | 13F | Northwestern Mutual Wealth Management Co | 541 925 | 36,89 | 19 119 | 49,61 | ||||
| 2025-08-29 | 13F | Centaurus Financial, Inc. | 135 837 | 26,27 | 5 | 33,33 | ||||
| 2025-07-28 | 13F | Keeler & Nadler Financial Planning & Wealth Management | 8 268 | −37,45 | 292 | −31,53 | ||||
| 2025-08-04 | 13F | Assetmark, Inc | 0 | −100,00 | 0 | |||||
| 2025-08-12 | 13F | Cornerstone Wealth Management, LLC | 28 348 | 13,87 | 1 000 | 24,53 | ||||
| 2025-08-14 | 13F | Mml Investors Services, Llc | 116 736 | 20,52 | 4 | 33,33 | ||||
| 2025-08-12 | 13F | CIBC Private Wealth Group, LLC | 391 | −49,61 | 14 | −40,91 | ||||
| 2025-08-14 | 13F | Godshalk Welsh Capital Management, Inc. | 40 475 | 2,66 | 1 428 | 12,19 | ||||
| 2025-07-24 | 13F | Robertson Stephens Wealth Management, LLC | 70 637 | −3,45 | 2 492 | 5,55 | ||||
| 2025-08-14 | 13F | McIlrath & Eck, LLC | 0 | −100,00 | 0 | |||||
| 2025-08-01 | 13F | Envestnet Asset Management Inc | 367 223 | 6,53 | 12 956 | 16,43 | ||||
| 2025-04-30 | 13F | POM Investment Strategies, LLC | 0 | −100,00 | 0 | |||||
| 2025-08-11 | 13F | Nations Financial Group Inc, /ia/ /adv | 238 766 | 0,10 | 8 424 | 9,40 | ||||
| 2025-08-13 | 13F | Renaissance Technologies Llc | 33 200 | 1 171 | ||||||
| 2025-08-13 | 13F | IAG Wealth Partners, LLC | 62 | 0,00 | 2 | 0,00 | ||||
| 2025-07-22 | 13F | DAVENPORT & Co LLC | 104 935 | 13,80 | 3 702 | 24,40 | ||||
| 2025-08-04 | 13F | Kovack Advisors, Inc. | 7 763 | 12,85 | 274 | 22,97 | ||||
| 2025-07-24 | 13F | IFP Advisors, Inc | 25 296 | 11,49 | 892 | 21,86 | ||||
| 2025-08-11 | 13F | Advisor Resource Council | 0 | −100,00 | 0 | |||||
| 2025-08-06 | 13F | Commonwealth Equity Services, Llc | 4 262 710 | −13,61 | 150 | −5,66 | ||||
| 2025-08-08 | 13F | WASHINGTON TRUST Co | 0 | −100,00 | 0 | |||||
| 2025-07-09 | 13F | Sar Wealth Management Group, Llc | 57 906 | 9,44 | 2 043 | 19,63 | ||||
| 2025-07-30 | 13F | D.a. Davidson & Co. | 318 015 | 1,80 | 11 220 | 11,26 | ||||
| 2025-07-30 | 13F | Paragon Advisors, LLC | 139 461 | 8,03 | 4 920 | 18,07 | ||||
| 2025-08-08 | 13F | Creative Planning | 24 673 | 26,70 | 870 | 38,54 | ||||
| 2025-07-15 | 13F | FMA Wealth Management, LLC | 29 214 | 4,57 | 1 031 | 9,46 | ||||
| 2025-08-18 | 13F | V2 Financial group LLC | 151 360 | −1,99 | 5 340 | 7,10 | ||||
| 2025-08-14 | 13F | Ausdal Financial Partners, Inc. | 344 469 | 8,68 | 12 153 | 18,78 | ||||
| 2025-07-01 | 13F | Harbor Investment Advisory, Llc | 46 524 | 43,75 | 1 641 | 57,18 | ||||
| 2025-08-14 | 13F | Wiley Bros.-aintree Capital, Llc | 14 754 | 11,99 | 521 | 22,64 | ||||
| 2025-08-15 | 13F | Equitable Holdings, Inc. | 99 758 | 11,84 | 3 519 | 22,23 | ||||
| 2025-07-11 | 13F | LongView Wealth Management | 22 800 | 15,15 | 804 | 25,82 | ||||
| 2025-08-12 | 13F | SRS Capital Advisors, Inc. | 30 858 | −6,50 | 1 089 | 2,16 | ||||
| 2025-09-04 | 13F/A | Advisor Group Holdings, Inc. | 2 788 479 | 15,98 | 98 385 | 26,76 | ||||
| 2025-08-08 | 13F | Advyzon Investment Management, LLC | 7 277 | 257 | ||||||
| 2025-08-04 | 13F | WNY Asset Management, LLC | 20 807 | −8,24 | 734 | 0,41 | ||||
| 2025-08-12 | 13F | Proequities, Inc. | 0 | 0 | ||||||
| 2025-07-29 | 13F | Koshinski Asset Management, Inc. | 59 707 | 17,44 | 2 106 | 28,34 | ||||
| 2025-07-31 | 13F | Trademark Financial Management, LLC | 0 | −100,00 | 0 | |||||
| 2025-08-05 | 13F | Bank of New York Mellon Corp | 1 828 658 | 0,12 | 64 515 | 9,42 | ||||
| 2025-08-14 | 13F | CoreCap Advisors, LLC | 21 023 | 1 721,75 | 742 | 1 902,70 | ||||
| 2025-08-14 | 13F | Principia Wealth Advisory, LLC | 790 | 1,28 | 28 | 12,50 | ||||
| 2025-06-26 | NP | FLCE - Frontier Asset U.S. Large Cap Equity ETF | 145 638 | 9,43 | 4 663 | 1,77 | ||||
| 2025-07-08 | 13F | Lowe Wealth Advisors, LLC | 25 774 | 40,29 | 909 | 53,29 | ||||
| 2025-08-05 | 13F | Fourth Dimension Wealth, LLC | 30 | 0,00 | 1 | |||||
| 2025-08-06 | 13F | Walkner Condon Financial Advisors LLC | 40 260 | −10,68 | 1 420 | −2,34 | ||||
| 2025-07-08 | 13F | Chemistry Wealth Management LLC | 155 089 | 8,81 | 5 472 | 18,93 | ||||
| 2025-07-09 | 13F | Heritage Wealth Architects, Inc. | 5 836 | 206 | ||||||
| 2025-08-12 | 13F | Frontier Asset Management, LLC | 31 301 | −25,61 | 1 104 | −18,70 | ||||
| 2025-08-12 | 13F | Integrated Advisors Network LLC | 46 819 | 8,94 | 1 652 | 19,03 | ||||
| 2025-07-18 | 13F | Financial Consulate, Inc | 514 761 | −1,06 | 18 161 | 8,13 | ||||
| 2025-08-11 | 13F | HighTower Advisors, LLC | 229 565 | 0,48 | 8 099 | 9,83 | ||||
| 2025-08-13 | 13F | Jones Financial Companies Lllp | 1 031 681 | 50,77 | 36 305 | 64,82 | ||||
| 2025-08-05 | 13F | HFG Advisors, Inc. | 75 286 | 1,70 | 2 656 | 11,18 | ||||
| 2025-08-06 | 13F | Vantage Financial Partners, LLC | 101 219 | 3 571 | ||||||
| 2025-08-11 | 13F | Hopwood Financial Services, Inc. | 8 520 | 21,35 | 301 | 32,74 | ||||
| 2025-08-14 | 13F | Hilltop Holdings Inc. | 63 003 | −0,66 | 2 223 | 8,55 | ||||
| 2025-07-21 | 13F | Patriot Financial Group Insurance Agency, LLC | 58 499 | −1,87 | 2 064 | 7,22 | ||||
| 2025-08-06 | 13F | Nvwm, Llc | 52 673 | 2,00 | 1 858 | 11,52 | ||||
| 2025-08-07 | 13F | Resources Investment Advisors, LLC. | 779 889 | −1,97 | 27 514 | 7,14 |