Grunnleggende statistikk
| Institusjonelle eiere | 116 total, 116 long only, 0 short only, 0 long/short - change of −3,31% MRQ |
| Gjennomsnittlig porteføljeallokering | 0.1009 % - change of 0,97% MRQ |
| Institusjonelle aksjer (Long) | 3 389 642 (ex 13D/G) - change of 0,13MM shares 4,07% MRQ |
| Institusjonell verdi (Long) | $ 96 652 USD ($1000) |
Institusjonelt eierskap og aksjonærer
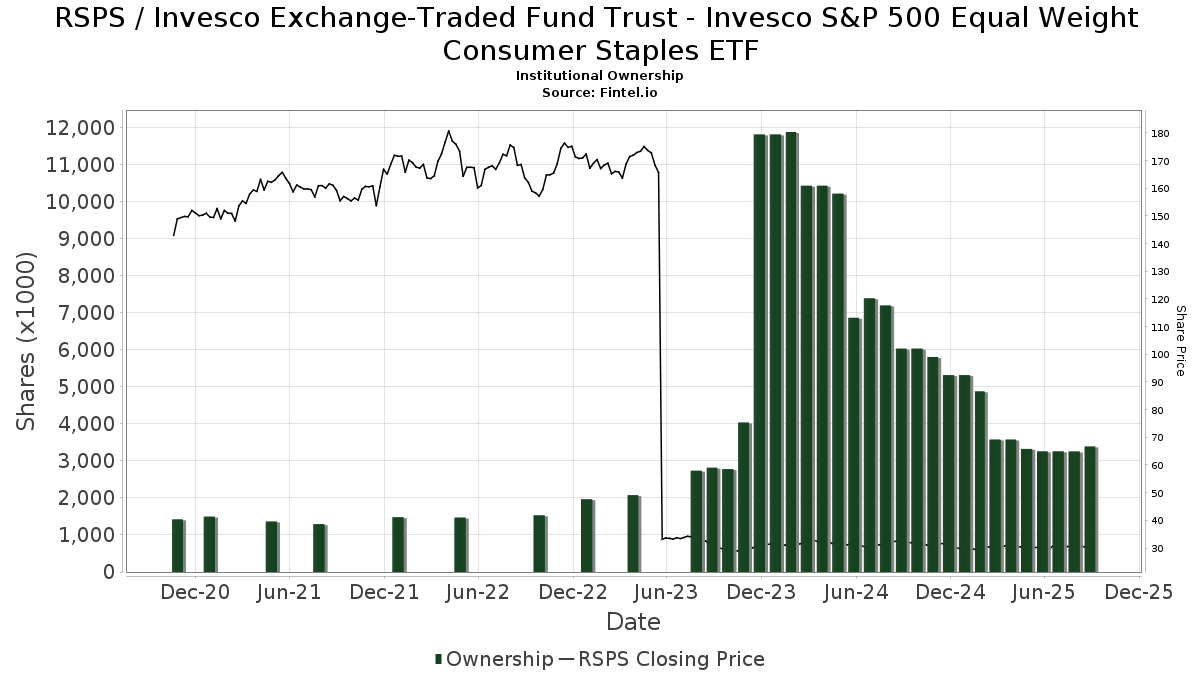
Invesco Exchange-Traded Fund Trust - Invesco S&P 500 Equal Weight Consumer Staples ETF (US:RSPS) har 116 institusjonelle eiere og aksjonærer som har sendt inn 13D/G- eller 13F-skjemaer til Securities Exchange Commission (SEC). Disse institusjonene eier til sammen 3,389,642 aksjer. De største aksjonærene inkluderer UBS Group AG, LPL Financial LLC, Bank Of America Corp /de/, HighTower Advisors, LLC, Morgan Stanley, Cetera Investment Advisers, Envestnet Asset Management Inc, Ameriprise Financial Inc, First International Bank of Israel Ltd., and Jpmorgan Chase & Co .
Invesco Exchange-Traded Fund Trust - Invesco S&P 500 Equal Weight Consumer Staples ETF (ARCA:RSPS) institusjonell eierstruktur viser nåværende posisjoner i selskapet fordelt på institusjoner og fond, samt de siste endringene i posisjonsstørrelse. De største aksjonærene kan være individuelle investorer, verdipapirfond, hedgefond eller institusjoner. Schedule 13D indikerer at investoren eier (eller har eid) mer enn 5 % av selskapet og har til hensikt (eller hadde til hensikt) å aktivt forfølge en endring i forretningsstrategien. Schedule 13G indikerer en passiv investering på over 5 %.
The share price as of September 11, 2025 is 30,11 / share. Previously, on September 12, 2024, the share price was 32,25 / share. This represents a decline of 6,63% over that period.
Fondssentiment-score
Fondssentiment Score (også kjent som akkumulering av eierskap poengsum) viser hvilke aksjer som er mest kjøpt av fond. Den er resultatet av en sofistikert, kvantitativ flerfaktormodell som identifiserer selskaper med de høyeste nivåene av institusjonell akkumulering. Beregningsmodellen for poeng bruker en kombinasjon av den totale økningen i antall offentliggjorte eiere, endringer i porteføljeallokeringen til disse eierne og andre beregninger. Tallet går fra 0 til 100, der høyere tall indikerer en høyere grad av akkumulering i forhold til sammenlignbare selskaper, der 50 er gjennomsnittet.
Oppdateringsfrekvens: Daglig
Sjekk ut Ownership Explorer, som inneholder en liste over de høyest rangerte selskapene.
Institusjonell Put/Call-forhold
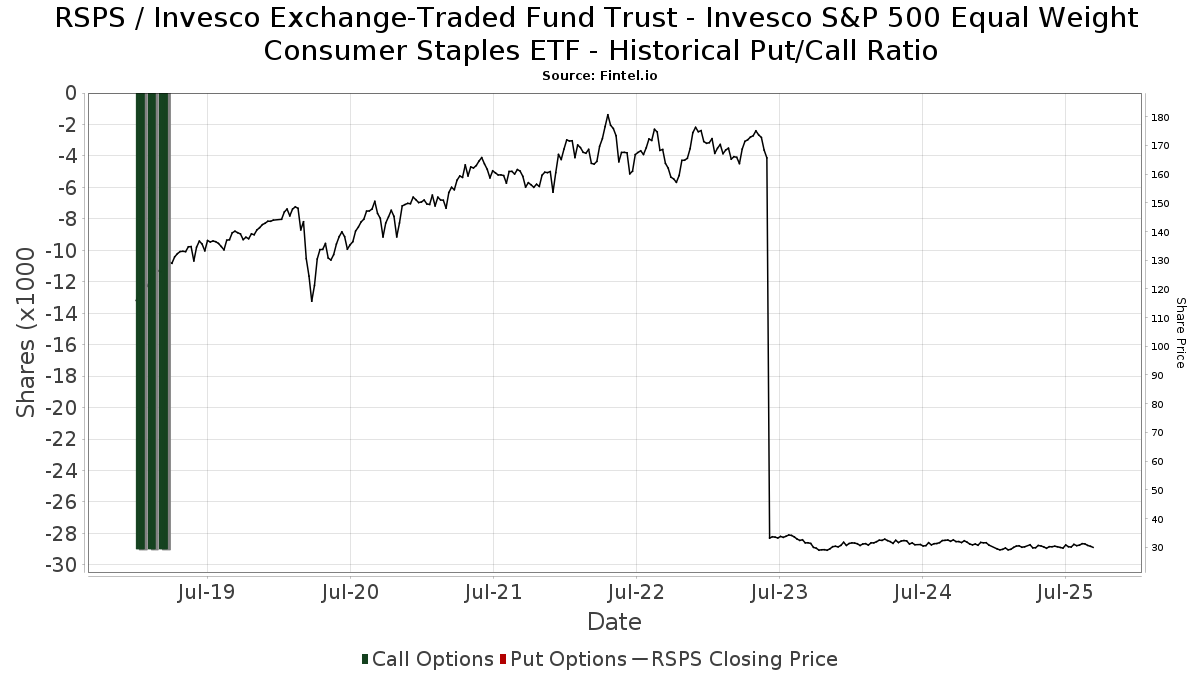
I tillegg til å rapportere standard aksje- og gjeldsemisjoner må institusjoner med mer enn 100 millioner kroner i forvaltningskapital også oppgi beholdningen av put- og callopsjoner. Siden put-opsjoner generelt indikerer et negativt sentiment, og call-opsjoner indikerer et positivt sentiment, kan vi få et inntrykk av det generelle institusjonelle sentimentet ved å plotte forholdet mellom put- og call-opsjoner. Diagrammet til høyre viser det historiske forholdet mellom put- og call-opsjoner for dette instrumentet.
Ved å bruke Put/Call-forholdet som en indikator på investorsentimentet kan man overvinne en av de viktigste svakhetene ved å bruke totalt institusjonelt eierskap, nemlig at en betydelig andel av forvaltningskapitalen investeres passivt for å følge indekser. Passivt forvaltede fond kjøper vanligvis ikke opsjoner, slik at indikatoren for put/call-forhold i større grad gjenspeiler stemningen i aktivt forvaltede fond.
13F- og NPORT-arkiveringer
Detaljer om 13F-arkiveringer er gratis. Detaljer om NP-arkiveringer krever et premium-medlemskap. Grønne rader indikerer nye posisjoner. Røde rader indikerer lukkede posisjoner. Klikk på lenke ikonet for å se hele transaksjonshistorikken.
Oppgrader
for å låse opp premiedata og eksportere til Excel. ![]() .
.
| Fildato | Kilde | Investor | Type | Gjennomsnittlig pris (estimert) |
Aksjer | Δ Aksjer (%) |
Rapportert verdi ($1000) | Verdi (%) | Portallokering (%) | |
|---|---|---|---|---|---|---|---|---|---|---|
| 2025-08-08 | 13F | Financial Gravity Companies, Inc. | 31 | −67,37 | 1 | −100,00 | ||||
| 2025-07-30 | 13F | Pacific Sun Financial Corp | 63 010 | −4,08 | 1 888 | −6,72 | ||||
| 2025-08-01 | 13F | Gwn Securities Inc. | 0 | −100,00 | 0 | |||||
| 2025-07-24 | 13F | Monument Capital Management | 6 871 | −35,92 | 206 | −37,88 | ||||
| 2025-08-14 | 13F | Wells Fargo & Company/mn | 9 921 | −41,58 | 297 | −43,21 | ||||
| 2025-08-12 | 13F | Founders Financial Alliance, LLC | 242 | 0,00 | 7 | 0,00 | ||||
| 2025-08-11 | 13F | HighTower Advisors, LLC | 231 082 | 1,01 | 6 926 | −1,79 | ||||
| 2025-08-08 | 13F | Creative Planning | 11 786 | 22,52 | 353 | 19,26 | ||||
| 2025-08-14 | 13F | GWM Advisors LLC | 710 | −58,84 | 21 | −60,38 | ||||
| 2025-08-05 | 13F | Dunhill Financial, LLC | 365 | 11 | ||||||
| 2025-07-07 | 13F | Nova Wealth Management, Inc. | 5 | −96,03 | 0 | −100,00 | ||||
| 2025-08-01 | 13F | Planning Directions Inc | 24 813 | −1,41 | 744 | −4,13 | ||||
| 2025-08-14 | 13F | Comerica Bank | 210 | 0,00 | 6 | 0,00 | ||||
| 2025-08-12 | 13F | LPL Financial LLC | 263 478 | −15,26 | 7 896 | −17,60 | ||||
| 2025-08-08 | 13F | Capital Investment Advisory Services, LLC | 500 | 15 | ||||||
| 2025-07-23 | 13F | Optas, LLC | 11 234 | 0,00 | 337 | −2,89 | ||||
| 2025-08-11 | 13F | Private Advisor Group, LLC | 39 749 | −2,29 | 1 191 | −4,95 | ||||
| 2025-08-14 | 13F | Qube Research & Technologies Ltd | 272 | 0,00 | 8 | 0,00 | ||||
| 2025-07-24 | 13F | Blair William & Co/il | 175 | 0,00 | 5 | 0,00 | ||||
| 2025-08-12 | 13F | O'shaughnessy Asset Management, Llc | 7 488 | −34,71 | 224 | −36,54 | ||||
| 2025-08-14 | 13F | Certified Advisory Corp | 0 | −100,00 | 0 | |||||
| 2025-07-23 | 13F | Friedenthal Financial | 50 174 | 1,54 | 1 504 | −1,25 | ||||
| 2025-08-12 | 13F | Global Retirement Partners, LLC | 5 552 | 166 | ||||||
| 2025-08-12 | 13F | Stelac Advisory Services LLC | 52 358 | 0,00 | 1 569 | −2,73 | ||||
| 2025-08-06 | 13F | Csenge Advisory Group | 8 715 | −0,17 | 266 | 0,00 | ||||
| 2025-08-05 | 13F | Sage Capital Management, LLC | 13 875 | 0,35 | 416 | −2,58 | ||||
| 2025-07-30 | 13F | Retirement Planning Group | 12 409 | 0,00 | 372 | −2,88 | ||||
| 2025-05-05 | 13F | Transce3nd, LLC | 0 | −100,00 | 0 | |||||
| 2025-05-06 | 13F | Carnegie Capital Asset Management, LLC | 0 | −100,00 | 0 | |||||
| 2025-08-12 | 13F | MAI Capital Management | 1 593 | 0,13 | 48 | −4,08 | ||||
| 2025-07-22 | 13F | Private Wealth Group, LLC | 67 772 | −39,88 | 2 031 | −41,54 | ||||
| 2025-08-15 | 13F | Morgan Stanley | 180 749 | −6,02 | 5 417 | −8,60 | ||||
| 2025-07-11 | 13F | SILVER OAK SECURITIES, Inc | 16 115 | 254,18 | 483 | 249,28 | ||||
| 2025-07-21 | 13F | Ameritas Advisory Services, LLC | 9 051 | −64,66 | 271 | −65,61 | ||||
| 2025-08-13 | 13F | Capital Analysts, Inc. | 610 | 0,00 | 0 | |||||
| 2025-08-06 | 13F | Commonwealth Equity Services, Llc | 60 728 | −0,36 | 2 | 0,00 | ||||
| 2025-08-14 | 13F | Vista Investment Management | 12 854 | −0,21 | 385 | −3,02 | ||||
| 2025-08-08 | 13F | Hartland & Co., LLC | 19 287 | −47,16 | 578 | −48,58 | ||||
| 2025-08-08 | 13F | Pnc Financial Services Group, Inc. | 8 410 | 0,00 | 252 | −2,70 | ||||
| 2025-08-14 | 13F | UBS Group AG | 316 681 | 162,31 | 9 491 | 155,11 | ||||
| 2025-08-14 | 13F | Fmr Llc | 5 841 | −11,07 | 175 | −13,37 | ||||
| 2025-07-22 | 13F | Grimes & Company, Inc. | 55 803 | 1 672 | ||||||
| 2025-08-12 | 13F | Proequities, Inc. | 0 | 0 | ||||||
| 2025-08-14 | 13F | CoreCap Advisors, LLC | 440 | 0,00 | 13 | 0,00 | ||||
| 2025-08-01 | 13F | Advisory Alpha, LLC | 8 017 | −0,14 | 240 | −2,83 | ||||
| 2025-05-13 | 13F | SFI Advisors, LLC | 0 | −100,00 | 0 | |||||
| 2025-08-06 | 13F | AE Wealth Management LLC | 1 365 | 71,70 | 41 | 66,67 | ||||
| 2025-08-12 | 13F | AlphaCore Capital LLC | 80 | 0,00 | 2 | 0,00 | ||||
| 2025-08-12 | 13F | Howe & Rusling Inc | 1 338 | 0,00 | 40 | −2,44 | ||||
| 2025-07-24 | 13F | Jfs Wealth Advisors, Llc | 803 | 0,63 | 24 | 0,00 | ||||
| 2025-08-12 | 13F | Atlas Capital Advisors Llc | 500 | 0,00 | 15 | 0,00 | ||||
| 2025-08-11 | 13F | Principal Securities, Inc. | 2 800 | 100,00 | 84 | 97,62 | ||||
| 2025-08-15 | 13F | First Heartland Consultants, Inc. | 24 421 | −4,34 | 732 | −7,00 | ||||
| 2025-08-14 | 13F | Bank Of America Corp /de/ | 241 328 | 0,48 | 7 233 | −2,28 | ||||
| 2025-08-11 | 13F | Kirtland Hills Capital Management, Llc | 7 210 | 8,10 | 216 | 6,40 | ||||
| 2025-08-14 | 13F | First International Bank of Israel Ltd. | 98 000 | 2 937 | ||||||
| 2025-08-08 | 13F | Cetera Investment Advisers | 113 918 | −5,37 | 3 414 | −7,98 | ||||
| 2025-08-14 | 13F | Quantinno Capital Management LP | 21 114 | −1,09 | 633 | −3,81 | ||||
| 2025-07-22 | 13F | Yoder Wealth Management, Inc. | 30 791 | 5,94 | 923 | 3,02 | ||||
| 2025-08-13 | 13F | Northwestern Mutual Wealth Management Co | 2 628 | −10,09 | 79 | −13,33 | ||||
| 2025-08-14 | 13F | Susquehanna International Group, Llp | 34 076 | 17,90 | 1 021 | 14,72 | ||||
| 2025-07-16 | 13F | Fortune Financial Advisors, LLC | 8 021 | −9,57 | 240 | −12,09 | ||||
| 2025-07-29 | 13F | Empirical Asset Management, LLC | 7 565 | 0,00 | 227 | −3,00 | ||||
| 2025-07-31 | 13F | Cambridge Investment Research Advisors, Inc. | 67 408 | −6,76 | 2 | 0,00 | ||||
| 2025-08-08 | 13F | Avalon Trust Co | 1 930 | 0,00 | 58 | −3,39 | ||||
| 2025-07-11 | 13F | Farther Finance Advisors, LLC | 48 478 | −0,62 | 1 453 | −3,52 | ||||
| 2025-08-07 | 13F | Cahill Financial Advisors Inc | 40 929 | 0,16 | 1 227 | −2,62 | ||||
| 2025-09-04 | 13F/A | Advisor Group Holdings, Inc. | 40 332 | −18,36 | 1 209 | −20,63 | ||||
| 2025-08-15 | 13F | Tower Research Capital LLC (TRC) | 18 253 | 57,71 | 547 | 53,65 | ||||
| 2025-07-10 | 13F | Affiance Financial, LLC | 0 | −100,00 | 0 | |||||
| 2025-08-13 | 13F | Twin Peaks Wealth Advisors, LLC | 225 | 7 | ||||||
| 2025-08-12 | 13F | CIBC Private Wealth Group, LLC | 3 500 | 0,00 | 105 | 4,00 | ||||
| 2025-08-14 | 13F | Royal Bank Of Canada | 5 341 | −10,34 | 159 | −13,59 | ||||
| 2025-07-24 | 13F | Costello Asset Management, INC | 1 161 | 0,61 | 35 | −2,86 | ||||
| 2025-07-24 | 13F | Live Oak Investment Partners | 18 852 | 6,56 | 565 | 3,49 | ||||
| 2025-08-14 | 13F | Raymond James Financial Inc | 20 951 | −1,08 | 628 | −3,83 | ||||
| 2025-07-15 | 13F | Fifth Third Bancorp | 275 | 0,00 | 8 | 0,00 | ||||
| 2025-07-16 | 13F | Legend Financial Advisors, Inc. | 1 088 | 33 | ||||||
| 2025-07-16 | 13F/A | CX Institutional | 1 001 | −68,65 | 0 | |||||
| 2025-08-14 | 13F | Jane Street Group, Llc | 0 | −100,00 | 0 | |||||
| 2025-07-30 | 13F | Bogart Wealth, LLC | 622 | 0,65 | 19 | −5,26 | ||||
| 2025-08-07 | 13F | Kestra Private Wealth Services, Llc | 0 | −100,00 | 0 | |||||
| 2025-08-11 | 13F | Citigroup Inc | 0 | −100,00 | 0 | |||||
| 2025-07-24 | 13F | Weaver Capital Management LLC | 62 732 | −4,24 | 1 880 | −6,84 | ||||
| 2025-08-13 | 13F | Royal Fund Management, LLC | 13 557 | −16,58 | 406 | −18,96 | ||||
| 2025-07-08 | 13F | Parallel Advisors, LLC | 145 | 0,00 | 4 | 0,00 | ||||
| 2025-08-07 | 13F | Allworth Financial LP | 7 535 | 0,43 | 226 | −0,88 | ||||
| 2025-05-16 | 13F | Laidlaw Wealth Management LLC | 0 | −100,00 | 0 | |||||
| 2025-08-01 | 13F | Envestnet Asset Management Inc | 109 967 | 10,62 | 3 296 | 7,57 | ||||
| 2025-08-05 | 13F | Tsfg, Llc | 14 910 | −2,89 | 0 | |||||
| 2025-07-17 | 13F | Walker Asset Management, LLC | 16 133 | −2,67 | 484 | −5,29 | ||||
| 2025-07-14 | 13F | Toth Financial Advisory Corp | 0 | −100,00 | 0 | |||||
| 2025-07-29 | 13F | Private Trust Co Na | 6 720 | 0,00 | 201 | −2,90 | ||||
| 2025-04-30 | 13F | Sofos Investments, Inc. | 41 | 105,00 | 1 | |||||
| 2025-08-12 | 13F | Wealthbridge Capital Management, Llc | 61 360 | −1,79 | 1 839 | −4,52 | ||||
| 2025-08-14 | 13F | Mariner, LLC | 26 532 | −4,43 | 795 | −7,02 | ||||
| 2025-08-04 | 13F | Joseph P. Lucia & Associates, LLC | 53 405 | 0,00 | 1 601 | −2,74 | ||||
| 2025-08-12 | 13F | Jpmorgan Chase & Co | 78 929 | 87,09 | 2 366 | 81,92 | ||||
| 2025-04-21 | 13F | Nelson, Van Denburg & Campbell Wealth Management Group, LLC | 0 | −100,00 | 0 | |||||
| 2025-08-04 | 13F | Kovack Advisors, Inc. | 10 838 | −1,07 | 325 | −3,86 | ||||
| 2025-07-21 | 13F | DHJJ Financial Advisors, Ltd. | 38 643 | −1,63 | 1 158 | −4,30 | ||||
| 2025-07-10 | 13F | Focus Financial Network, Inc. | 16 617 | −2,43 | 498 | −4,96 | ||||
| 2025-07-30 | 13F | Eqis Capital Management, Inc. | 6 744 | −2,19 | 202 | −4,72 | ||||
| 2025-08-07 | 13F/A | Joseph Group Capital Management | 0 | −100,00 | 0 | |||||
| 2025-08-14 | 13F | Citadel Advisors Llc | 0 | −100,00 | 0 | |||||
| 2025-08-11 | 13F | HHM Wealth Advisors, LLC | 2 600 | 0,00 | 78 | −3,75 | ||||
| 2025-07-16 | 13F | Strategic Investment Solutions, Inc. /IL | 145 | 0,00 | 4 | 0,00 | ||||
| 2025-08-12 | 13F | Coldstream Capital Management Inc | 0 | −100,00 | 0 | |||||
| 2025-07-22 | 13F | Coastal Investment Advisors, Inc. | 0 | −100,00 | 0 | |||||
| 2025-08-13 | 13F | Jones Financial Companies Lllp | 6 458 | 39,48 | 192 | 37,14 | ||||
| 2025-08-15 | 13F | Kestra Advisory Services, LLC | 12 307 | −5,38 | 369 | −8,00 | ||||
| 2025-08-13 | 13F | Cary Street Partners Financial Llc | 7 367 | 221 | ||||||
| 2025-07-25 | 13F | Cwm, Llc | 875 | −3,85 | 0 | |||||
| 2025-08-14 | 13F | Mercer Global Advisors Inc /adv | 9 801 | −1,64 | 294 | −4,56 | ||||
| 2025-08-07 | 13F | Blackston Financial Advisory Group, LLC | 12 236 | −9,02 | 367 | −11,59 | ||||
| 2025-08-14 | 13F | Two Sigma Securities, Llc | 0 | −100,00 | 0 | |||||
| 2025-08-14 | 13F | Stifel Financial Corp | 6 984 | 209 | ||||||
| 2025-08-13 | 13F | Green Harvest Asset Management LLC | 16 622 | −0,88 | 498 | −3,49 | ||||
| 2025-07-29 | 13F | Ballast, Inc. | 53 405 | 1 601 | ||||||
| 2025-08-14 | 13F | Glenmede Investment Management, LP | 400 | 12 | ||||||
| 2025-07-14 | 13F | U.S. Capital Wealth Advisors, LLC | 15 212 | −0,96 | 456 | −3,81 | ||||
| 2025-08-08 | 13F | Thoroughbred Financial Services, Llc | 17 495 | −39,71 | 1 | |||||
| 2025-08-18 | 13F | Geneos Wealth Management Inc. | 2 750 | −8,33 | 82 | −10,87 | ||||
| 2025-07-18 | 13F | Truist Financial Corp | 54 611 | 30,39 | 1 637 | 26,82 | ||||
| 2025-07-21 | 13F | TFG Advisers LLC | 13 861 | −14,82 | 415 | −17,17 | ||||
| 2025-08-14 | 13F | Goldman Sachs Group Inc | 0 | −100,00 | 0 | |||||
| 2025-08-19 | 13F | Asset Dedication, LLC | 320 | 0,00 | 10 | 0,00 | ||||
| 2025-05-09 | 13F | McClarren Financial Advisors, Inc. | 0 | −100,00 | 0 | |||||
| 2025-07-29 | 13F | Koshinski Asset Management, Inc. | 9 985 | −6,94 | 299 | −9,39 | ||||
| 2025-08-05 | 13F | GPS Wealth Strategies Group, LLC | 395 | 0,00 | 12 | −8,33 | ||||
| 2025-05-14 | 13F | Mml Investors Services, Llc | 0 | −100,00 | 0 | |||||
| 2025-08-06 | 13F | Stonebridge Financial Planning Group, LLC | 16 392 | 0,02 | 491 | −2,77 | ||||
| 2025-05-14 | 13F | Flow Traders U.s. Llc | 0 | −100,00 | 0 | |||||
| 2025-08-01 | 13F | Brookwood Investment Group LLC | 15 175 | 0,00 | 455 | −2,78 | ||||
| 2025-08-14 | 13F | Ameriprise Financial Inc | 105 322 | −4,50 | 3 156 | −7,15 | ||||
| 2025-07-18 | 13F | QTR Family Wealth, LLC | 12 514 | −7,04 | 375 | −9,42 | ||||
| 2025-08-05 | 13F | Huntington National Bank | 0 | |||||||
| 2025-07-28 | 13F | Harbour Investments, Inc. | 11 575 | −4,33 | 347 | −6,99 | ||||
| 2025-08-13 | 13F | Lido Advisors, LLC | 14 747 | 0,96 | 442 | −2,00 |