Grunnleggende statistikk
| Institusjonelle eiere | 127 total, 127 long only, 0 short only, 0 long/short - change of 12,28% MRQ |
| Gjennomsnittlig porteføljeallokering | 0.4026 % - change of −14,10% MRQ |
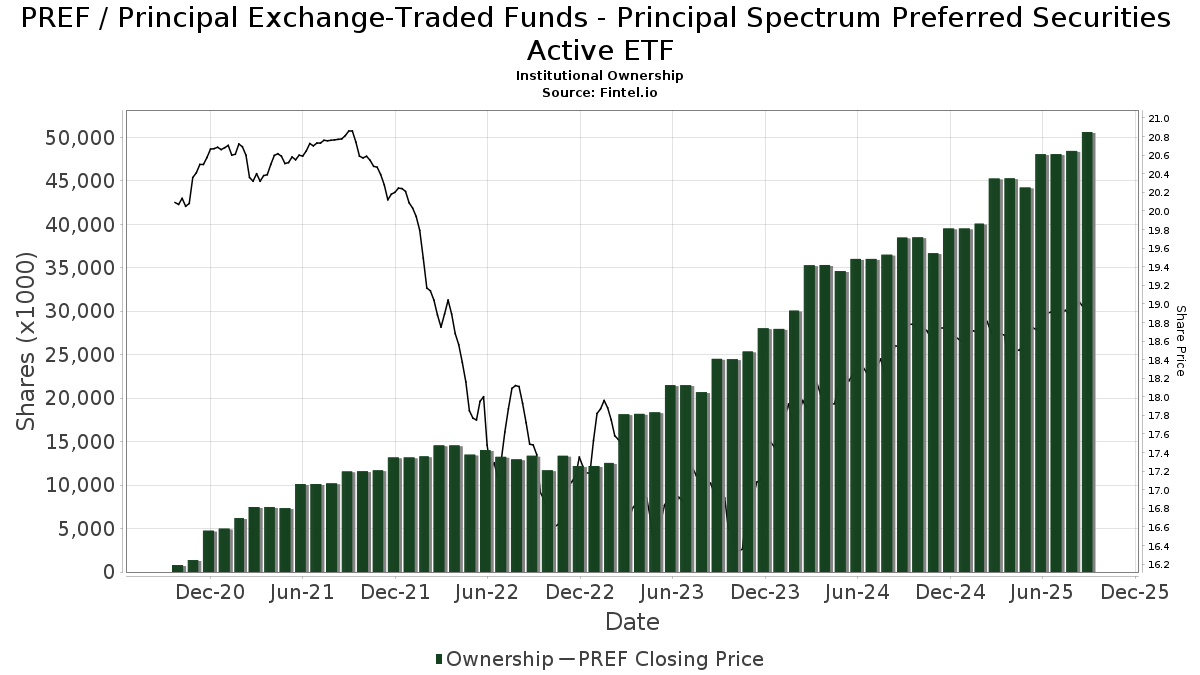
| Institusjonelle aksjer (Long) | 50 615 034 (ex 13D/G) - change of 2,55MM shares 5,30% MRQ |
| Institusjonell verdi (Long) | $ 952 726 USD ($1000) |
Institusjonelt eierskap og aksjonærer
Principal Exchange-Traded Funds - Principal Spectrum Preferred Securities Active ETF (US:PREF) har 127 institusjonelle eiere og aksjonærer som har sendt inn 13D/G- eller 13F-skjemaer til Securities Exchange Commission (SEC). Disse institusjonene eier til sammen 50,615,034 aksjer. De største aksjonærene inkluderer Bank Of America Corp /de/, UBS Group AG, Morgan Stanley, Wells Fargo & Company/mn, Royal Bank Of Canada, IFC Advisors LLC, LPL Financial LLC, Raymond James Financial Inc, Permanens Capital L.P., and Wealth Enhancement Advisory Services, Llc .
Principal Exchange-Traded Funds - Principal Spectrum Preferred Securities Active ETF (ARCA:PREF) institusjonell eierstruktur viser nåværende posisjoner i selskapet fordelt på institusjoner og fond, samt de siste endringene i posisjonsstørrelse. De største aksjonærene kan være individuelle investorer, verdipapirfond, hedgefond eller institusjoner. Schedule 13D indikerer at investoren eier (eller har eid) mer enn 5 % av selskapet og har til hensikt (eller hadde til hensikt) å aktivt forfølge en endring i forretningsstrategien. Schedule 13G indikerer en passiv investering på over 5 %.
The share price as of September 10, 2025 is 19,05 / share. Previously, on September 11, 2024, the share price was 18,59 / share. This represents an increase of 2,47% over that period.
Fondssentiment-score
Fondssentiment Score (også kjent som akkumulering av eierskap poengsum) viser hvilke aksjer som er mest kjøpt av fond. Den er resultatet av en sofistikert, kvantitativ flerfaktormodell som identifiserer selskaper med de høyeste nivåene av institusjonell akkumulering. Beregningsmodellen for poeng bruker en kombinasjon av den totale økningen i antall offentliggjorte eiere, endringer i porteføljeallokeringen til disse eierne og andre beregninger. Tallet går fra 0 til 100, der høyere tall indikerer en høyere grad av akkumulering i forhold til sammenlignbare selskaper, der 50 er gjennomsnittet.
Oppdateringsfrekvens: Daglig
Sjekk ut Ownership Explorer, som inneholder en liste over de høyest rangerte selskapene.
Institusjonell Put/Call-forhold
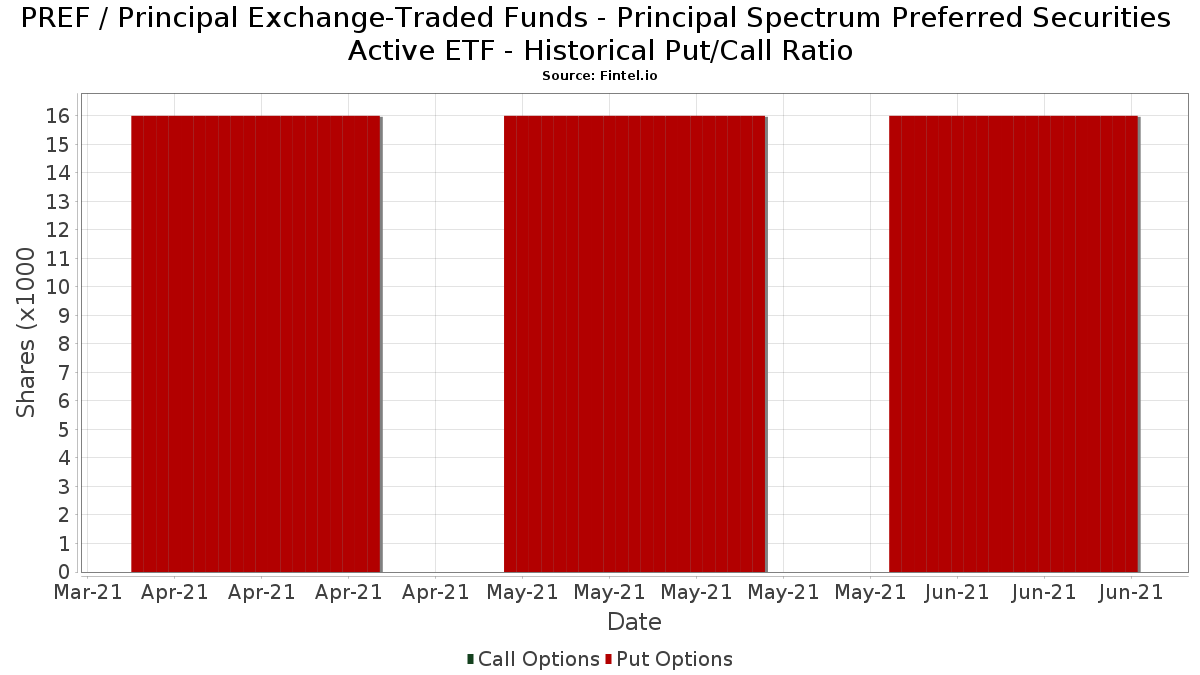
I tillegg til å rapportere standard aksje- og gjeldsemisjoner må institusjoner med mer enn 100 millioner kroner i forvaltningskapital også oppgi beholdningen av put- og callopsjoner. Siden put-opsjoner generelt indikerer et negativt sentiment, og call-opsjoner indikerer et positivt sentiment, kan vi få et inntrykk av det generelle institusjonelle sentimentet ved å plotte forholdet mellom put- og call-opsjoner. Diagrammet til høyre viser det historiske forholdet mellom put- og call-opsjoner for dette instrumentet.
Ved å bruke Put/Call-forholdet som en indikator på investorsentimentet kan man overvinne en av de viktigste svakhetene ved å bruke totalt institusjonelt eierskap, nemlig at en betydelig andel av forvaltningskapitalen investeres passivt for å følge indekser. Passivt forvaltede fond kjøper vanligvis ikke opsjoner, slik at indikatoren for put/call-forhold i større grad gjenspeiler stemningen i aktivt forvaltede fond.
13F- og NPORT-arkiveringer
Detaljer om 13F-arkiveringer er gratis. Detaljer om NP-arkiveringer krever et premium-medlemskap. Grønne rader indikerer nye posisjoner. Røde rader indikerer lukkede posisjoner. Klikk på lenke ikonet for å se hele transaksjonshistorikken.
Oppgrader
for å låse opp premiedata og eksportere til Excel. ![]() .
.
| Fildato | Kilde | Investor | Type | Gjennomsnittlig pris (estimert) |
Aksjer | Δ Aksjer (%) |
Rapportert verdi ($1000) | Verdi (%) | Portallokering (%) | |
|---|---|---|---|---|---|---|---|---|---|---|
| 2025-08-14 | 13F | Coastal Bridge Advisors, LLC | 25 663 | 0,00 | 487 | 1,46 | ||||
| 2025-07-31 | 13F | Cambridge Investment Research Advisors, Inc. | 21 739 | 5,26 | 0 | |||||
| 2025-08-14 | 13F | GWM Advisors LLC | 158 682 | 4,58 | 3 010 | 6,10 | ||||
| 2025-05-16 | 13F | Laidlaw Wealth Management LLC | 0 | −100,00 | 0 | |||||
| 2025-07-22 | 13F | DAVENPORT & Co LLC | 11 753 | −4,08 | 223 | −3,06 | ||||
| 2025-07-30 | 13F | Meadow Creek Wealth Advisors Llc | 130 435 | 14,75 | 2 474 | 16,42 | ||||
| 2025-07-14 | 13F | AdvisorNet Financial, Inc | 285 | 5 | ||||||
| 2025-08-04 | 13F | Hantz Financial Services, Inc. | 800 | 0 | ||||||
| 2025-08-07 | 13F | Cascade Financial Partners, LLC | 17 399 | 330 | ||||||
| 2025-09-04 | 13F/A | Advisor Group Holdings, Inc. | 78 543 | 4,79 | 1 490 | 6,35 | ||||
| 2025-07-11 | 13F/A | Umb Bank N A/mo | 54 005 | 0,00 | 1 024 | 1,49 | ||||
| 2025-08-08 | 13F | Principal Financial Group Inc | 284 025 | 23,39 | 5 381 | 25,11 | ||||
| 2025-05-08 | 13F | Geneos Wealth Management Inc. | 0 | −100,00 | 0 | |||||
| 2025-07-15 | 13F | GSB Wealth Management, LLC | 224 275 | 16,10 | 4 255 | 17,77 | ||||
| 2025-08-08 | 13F | Compass Financial Services Inc | 0 | −100,00 | 0 | |||||
| 2025-08-12 | 13F | Jacobi Capital Management LLC | 16 783 | −1,53 | 318 | 0,00 | ||||
| 2025-08-14 | 13F | Royal Bank Of Canada | 3 073 039 | −0,71 | 58 296 | 0,73 | ||||
| 2025-05-15 | 13F/A | Orion Portfolio Solutions, LLC | 17 468 | −74,42 | 327 | −74,35 | ||||
| 2025-08-07 | 13F | Fidelis Capital Partners, LLC | 10 111 | 0,00 | 191 | 2,14 | ||||
| 2025-08-19 | 13F | Asset Dedication, LLC | 0 | −100,00 | 0 | |||||
| 2025-07-29 | 13F | Stephens Inc /ar/ | 20 417 | 387 | ||||||
| 2025-08-14 | 13F | Colony Group, LLC | 242 920 | 4 608 | ||||||
| 2025-07-24 | 13F | IFP Advisors, Inc | 19 540 | 0,00 | 371 | 1,37 | ||||
| 2025-08-06 | 13F | Bensler, LLC | 582 078 | 11,67 | 11 042 | 13,30 | ||||
| 2025-08-12 | 13F | J.w. Cole Advisors, Inc. | 136 786 | 0,83 | 2 595 | 2,29 | ||||
| 2025-07-07 | 13F | First Citizens Financial Corp | 50 847 | −3,74 | 965 | −2,33 | ||||
| 2025-08-14 | 13F | Heritage Wealth Management, Inc. | 25 300 | 0,00 | 480 | 1,27 | ||||
| 2025-08-14 | 13F | Dearborn Partners Llc | 84 284 | −19,07 | 1 599 | −17,93 | ||||
| 2025-07-22 | 13F | Wealthcare Advisory Partners LLC | 44 543 | 2,53 | 845 | 3,94 | ||||
| 2025-08-12 | 13F | Financial Advocates Investment Management | 19 965 | 379 | ||||||
| 2025-08-14 | 13F | Peapack Gladstone Financial Corp | 0 | −100,00 | 0 | |||||
| 2025-07-24 | 13F | Us Bancorp \de\ | 1 600 | 0,00 | 30 | 3,45 | ||||
| 2025-05-14 | 13F | Northwestern Mutual Wealth Management Co | 0 | −100,00 | 0 | |||||
| 2025-07-24 | 13F | Gilliland Jeter Wealth Management LLC | 78 615 | −0,10 | 1 491 | 1,36 | ||||
| 2025-08-08 | 13F | Creative Planning | 138 387 | 2 625 | ||||||
| 2025-08-14 | 13F | Fmr Llc | 41 | 24,24 | 1 | |||||
| 2025-08-19 | 13F | Cape Investment Advisory, Inc. | 453 | −15,33 | 9 | −20,00 | ||||
| 2025-07-14 | 13F | Signature Securities Group Corporation | 78 578 | 1,18 | 1 491 | 2,62 | ||||
| 2025-08-14 | 13F | Benjamin Edwards Inc | 693 069 | −12,03 | 13 148 | −10,76 | ||||
| 2025-07-10 | 13F | Wealth Enhancement Advisory Services, Llc | 1 213 739 | −1,58 | 22 952 | −0,48 | ||||
| 2025-08-11 | 13F | AXS Investments LLC | 227 778 | −22,21 | 4 321 | −21,10 | ||||
| 2025-07-16 | 13F | Essex Financial Services, Inc. | 47 378 | 899 | ||||||
| 2025-08-08 | 13F | Capital Investment Advisory Services, LLC | 55 603 | −4,63 | 1 055 | −3,30 | ||||
| 2025-04-14 | 13F | Pallas Capital Advisors LLC | 0 | −100,00 | 0 | |||||
| 2025-08-14 | 13F | Susquehanna International Group, Llp | 31 705 | 2,66 | 601 | 4,16 | ||||
| 2025-07-29 | 13F | Private Trust Co Na | 6 094 | 78,50 | 116 | 82,54 | ||||
| 2025-08-11 | 13F | MainStreet Investment Advisors LLC | 131 041 | −0,68 | 2 486 | 0,73 | ||||
| 2025-07-09 | 13F | Massmutual Trust Co Fsb/adv | 129 186 | −2,92 | 2 451 | −1,53 | ||||
| 2025-07-28 | 13F | Rosenberg Matthew Hamilton | 495 | 0,00 | 9 | 0,00 | ||||
| 2025-07-25 | 13F | Cwm, Llc | 10 535 | 1,17 | 0 | |||||
| 2025-08-12 | 13F | Insigneo Advisory Services, Llc | 35 434 | 672 | ||||||
| 2025-08-04 | 13F | Assetmark, Inc | 2 390 | 45 | ||||||
| 2025-08-14 | 13F | Warren Averett Asset Management, LLC | 34 241 | −3,75 | 650 | −2,41 | ||||
| 2025-07-21 | 13F | Ameritas Advisory Services, LLC | 200 | 4 | ||||||
| 2025-08-14 | 13F | Comerica Bank | 89 256 | 5,18 | 1 693 | 6,75 | ||||
| 2025-08-05 | 13F | Huntington National Bank | 52 | 0,00 | ||||||
| 2025-08-13 | 13F | VestGen Advisors, LLC | 14 694 | 0,00 | 277 | 1,09 | ||||
| 2025-08-08 | 13F | Investment Partners, Ltd. | 99 541 | −21,56 | 1 888 | −20,44 | ||||
| 2025-08-12 | 13F | Steward Partners Investment Advisory, Llc | 2 577 | 92,31 | 49 | 92,00 | ||||
| 2025-08-14 | 13F | Stifel Financial Corp | 85 845 | −16,60 | 1 628 | −15,38 | ||||
| 2025-08-06 | 13F | SOUTH STATE Corp | 740 | 14 | ||||||
| 2025-04-14 | 13F | Griffith & Werner, Inc. | 11 029 | 0,81 | 206 | 1,48 | ||||
| 2025-08-12 | 13F | FourThought Financial Partners, LLC | 56 278 | 11,86 | 1 068 | 13,51 | ||||
| 2025-08-01 | 13F | Envestnet Asset Management Inc | 403 476 | 59,71 | 7 654 | 62,00 | ||||
| 2025-08-15 | 13F | Provenance Wealth Advisors, LLC | 8 205 | −16,25 | 156 | −15,30 | ||||
| 2025-08-12 | 13F | PSI Advisors, LLC | 0 | −100,00 | 0 | |||||
| 2025-08-27 | 13F/A | Brinker Capital Investments, LLC | 16 616 | −4,88 | 315 | −3,37 | ||||
| 2025-07-31 | 13F | Whipplewood Advisors, LLC | 19 583 | 2 697,57 | 371 | −8,85 | ||||
| 2025-08-08 | 13F | Everett Harris & Co /ca/ | 23 500 | 446 | ||||||
| 2025-08-28 | NP | SIRAX - Sierra Tactical All Asset Fund Class A | 246 100 | 4 669 | ||||||
| 2025-08-12 | 13F | LPL Financial LLC | 2 791 483 | 32,34 | 52 954 | 34,25 | ||||
| 2025-05-01 | 13F | Grant/GrossMendelsohn, LLC | 34 241 | 633 | ||||||
| 2025-07-21 | 13F | Mechanics Financial Corp | 36 694 | 23,47 | 696 | 25,41 | ||||
| 2025-08-06 | 13F | Commonwealth Equity Services, Llc | 305 236 | 1,87 | 6 | 0,00 | ||||
| 2025-07-11 | 13F | Grant Private Wealth Management Inc | 11 159 | 212 | ||||||
| 2025-08-13 | 13F | Willis Johnson & Associates, Inc. | 102 645 | −7,84 | 1 947 | −6,48 | ||||
| 2025-08-11 | 13F | Principal Securities, Inc. | 429 357 | 94,40 | 8 145 | 98,15 | ||||
| 2025-08-05 | 13F | Bank of New York Mellon Corp | 38 024 | −5,11 | 721 | −3,74 | ||||
| 2025-08-12 | 13F | Argent Trust Co | 32 096 | −20,37 | 609 | −19,26 | ||||
| 2025-08-13 | 13F | Baird Financial Group, Inc. | 292 424 | −0,49 | 5 547 | 0,95 | ||||
| 2025-08-14 | 13F | BTG Pactual Asset Management US LLC | 28 025 | 8,74 | 532 | 10,40 | ||||
| 2025-08-25 | NP | OIOIX - AXS Income Opportunities Fund Class I | 227 778 | −22,21 | 4 321 | −21,10 | ||||
| 2025-08-15 | 13F | Kestra Advisory Services, LLC | 235 944 | 45,83 | 4 476 | 47,93 | ||||
| 2025-08-14 | 13F | Main Street Financial Solutions, LLC | 11 396 | 1,17 | 216 | 2,86 | ||||
| 2025-07-17 | 13F | LexAurum Advisors, LLC | 34 488 | 22,22 | 654 | 24,10 | ||||
| 2025-07-30 | 13F | Schnieders Capital Management Llc | 36 650 | 0,00 | 695 | 1,46 | ||||
| 2025-08-12 | 13F | Laurel Wealth Advisors LLC | 3 510 | 1 797,30 | 0 | −100,00 | ||||
| 2025-08-12 | 13F | Jpmorgan Chase & Co | 77 295 | 3 031,89 | 1 466 | 3 086,96 | ||||
| 2025-07-23 | 13F | Tyche Wealth Partners LLC | 408 148 | −32,51 | 7 743 | −31,54 | ||||
| 2025-08-14 | 13F/A | Rockefeller Capital Management L.P. | 117 383 | 5,80 | 2 227 | 7,33 | ||||
| 2025-07-28 | 13F | IFC Advisors LLC | 2 819 142 | 1,49 | 53 479 | 2,96 | ||||
| 2025-07-17 | 13F | KWB Wealth | 209 390 | 3 916 | ||||||
| 2025-08-14 | 13F | Raymond James Financial Inc | 1 532 641 | −17,78 | 29 074 | −16,59 | ||||
| 2025-07-24 | 13F | Stonebridge Financial Group, LLC | 0 | −100,00 | 0 | |||||
| 2025-08-13 | 13F | Cerity Partners LLC | 78 346 | −29,69 | 1 486 | −28,66 | ||||
| 2025-08-07 | 13F | Ibex Wealth Advisors | 95 623 | 2,31 | 1 814 | 3,78 | ||||
| 2025-08-14 | 13F | Permanens Capital L.P. | 1 520 729 | 10,12 | 28 848 | 11,71 | ||||
| 2025-07-18 | 13F | Truist Financial Corp | 56 237 | 3,54 | 1 067 | 5,02 | ||||
| 2025-07-17 | 13F | XML Financial, LLC | 18 718 | 1,09 | 355 | 2,60 | ||||
| 2025-07-01 | 13F | Harbor Investment Advisory, Llc | 5 000 | 0,00 | 95 | 1,08 | ||||
| 2025-08-14 | 13F | UBS Group AG | 6 921 965 | −1,76 | 131 310 | −0,34 | ||||
| 2025-08-15 | 13F | Morgan Stanley | 6 156 993 | 0,77 | 116 798 | 2,22 | ||||
| 2025-07-18 | 13F | Rogco, Lp | 380 684 | 1,43 | 7 222 | 2,89 | ||||
| 2025-08-11 | 13F | Advisor Resource Council | 0 | −100,00 | 0 | |||||
| 2025-04-28 | 13F | Pinnacle Financial Partners Inc | 30 272 | −21,02 | 566 | −20,62 | ||||
| 2025-08-01 | 13F | Bank of Jackson Hole Trust | 10 100 | 0,00 | 192 | 1,06 | ||||
| 2025-07-08 | 13F | Ehrlich Financial Group | 16 597 | 12,76 | 315 | 14,18 | ||||
| 2025-07-22 | 13F | Berger Financial Group, Inc | 425 217 | 5,61 | 8 066 | 7,13 | ||||
| 2025-08-14 | 13F | Bnp Paribas Arbitrage, Sa | 10 | −66,67 | 0 | |||||
| 2025-08-14 | 13F | Bank Of America Corp /de/ | 10 222 023 | 10,76 | 193 912 | 12,35 | ||||
| 2025-08-14 | 13F | Capital & Planning, Llc | 38 340 | −3,64 | 727 | −2,28 | ||||
| 2025-08-14 | 13F | Smartleaf Asset Management LLC | 60 010 | −15,16 | 1 135 | −14,35 | ||||
| 2025-08-14 | 13F | Jane Street Group, Llc | 0 | −100,00 | 0 | |||||
| 2025-08-14 | 13F | Mariner, LLC | 504 757 | 31,78 | 9 575 | 33,69 | ||||
| 2025-08-11 | 13F | Resurgent Financial Advisors LLC | 10 268 | 195 | ||||||
| 2025-09-02 | 13F/A | FSC Wealth Advisors, LLC | 17 675 | 335 | ||||||
| 2025-08-12 | 13F | Boreal Capital Management LLC | 66 894 | 1 269 | ||||||
| 2025-07-09 | 13F | Fiduciary Alliance LLC | 103 095 | 18,55 | 1 956 | 20,23 | ||||
| 2025-08-14 | 13F | Wiley Bros.-aintree Capital, Llc | 94 733 | −2,05 | 1 797 | −0,72 | ||||
| 2025-07-24 | 13F | Wealth Management Resources, Inc. | 0 | −100,00 | 0 | |||||
| 2025-05-14 | 13F | Delta Investment Management, LLC | 0 | −100,00 | 0 | |||||
| 2025-08-11 | 13F | Platform Technology Partners | 19 000 | 72,73 | 360 | 75,61 | ||||
| 2025-08-14 | 13F | Wells Fargo & Company/mn | 3 250 027 | 3,66 | 61 653 | 5,15 | ||||
| 2025-08-14 | 13F | Mml Investors Services, Llc | 38 426 | 1 | ||||||
| 2025-08-05 | 13F | W.G. Shaheen & Associates DBA Whitney & Co | 16 500 | 0,00 | 313 | 1,62 | ||||
| 2025-08-12 | 13F | CIBC Private Wealth Group, LLC | 1 500 | 0,00 | 28 | 3,70 | ||||
| 2025-08-11 | 13F | Private Advisor Group, LLC | 181 787 | −14,59 | 3 449 | −13,35 | ||||
| 2025-08-08 | 13F | Emerald Investment Partners, Llc | 10 814 | 5,05 | 205 | 6,77 | ||||
| 2025-08-05 | 13F | Lifeworks Advisors, LLC | 73 375 | −3,99 | 1 392 | −2,66 | ||||
| 2025-07-14 | 13F | U.S. Capital Wealth Advisors, LLC | 36 157 | −9,97 | 686 | −8,67 | ||||
| 2025-07-21 | 13F | Cliftonlarsonallen Wealth Advisors, Llc | 43 885 | 832 | ||||||
| 2025-05-20 | 13F | Belpointe Asset Management LLC | 0 | −100,00 | 0 | −100,00 | ||||
| 2025-07-11 | 13F | Farther Finance Advisors, LLC | 915 | −93,60 | 17 | −93,61 | ||||
| 2025-08-05 | 13F | Flynn Zito Capital Management, Llc | 117 386 | −0,61 | 2 227 | 0,82 | ||||
| 2025-08-12 | 13F | Proequities, Inc. | 0 | 0 | ||||||
| 2025-08-08 | 13F | Cornerstone Advisors Asset Management, Inc | 525 948 | 9,19 | 9 977 | 11,87 | ||||
| 2025-08-12 | 13F | South Plains Financial, Inc. | 11 787 | −2,68 | 223 | −1,33 | ||||
| 2025-07-21 | 13F | Mirae Asset Global Investments Co., Ltd. | 102 829 | 58,66 | 1 951 | 60,76 | ||||
| 2025-07-11 | 13F | Pinnacle Bancorp, Inc. | 6 135 | 48,91 | 116 | 50,65 | ||||
| 2025-08-12 | 13F | Global Retirement Partners, LLC | 5 | −99,98 | 0 | −100,00 | ||||
| 2025-08-06 | 13F | Legacy Bridge, LLC | 130 360 | −4,47 | 2 473 | −3,10 | ||||
| 2025-07-28 | 13F | Axxcess Wealth Management, Llc | 13 602 | −12,00 | 258 | −10,73 | ||||
| 2025-07-29 | 13F | Activest Wealth Management | 39 474 | −0,20 | 749 | 1,22 | ||||
| 2025-05-12 | 13F | Independent Advisor Alliance | 0 | −100,00 | 0 |