Grunnleggende statistikk
| Institusjonelle eiere | 133 total, 131 long only, 1 short only, 1 long/short - change of −6,34% MRQ |
| Gjennomsnittlig porteføljeallokering | 0.1558 % - change of −18,66% MRQ |
| Institusjonelle aksjer (Long) | 24 428 876 (ex 13D/G) - change of −3,91MM shares −13,79% MRQ |
| Institusjonell verdi (Long) | $ 222 997 USD ($1000) |
Institusjonelt eierskap og aksjonærer
PennantPark Floating Rate Capital Ltd. (US:PFLT) har 133 institusjonelle eiere og aksjonærer som har sendt inn 13D/G- eller 13F-skjemaer til Securities Exchange Commission (SEC). Disse institusjonene eier til sammen 24,428,876 aksjer. De største aksjonærene inkluderer Sound Income Strategies, LLC, Van Eck Associates Corp, BIZD - VanEck Vectors BDC Income ETF, Altshuler Shaham Ltd, Marshall Wace, Llp, UBS Group AG, Invesco Ltd., KBWD - Invesco KBW High Dividend Yield Financial ETF, Two Sigma Investments, Lp, and Qube Research & Technologies Ltd .
PennantPark Floating Rate Capital Ltd. (NYSE:PFLT) institusjonell eierstruktur viser nåværende posisjoner i selskapet fordelt på institusjoner og fond, samt de siste endringene i posisjonsstørrelse. De største aksjonærene kan være individuelle investorer, verdipapirfond, hedgefond eller institusjoner. Schedule 13D indikerer at investoren eier (eller har eid) mer enn 5 % av selskapet og har til hensikt (eller hadde til hensikt) å aktivt forfølge en endring i forretningsstrategien. Schedule 13G indikerer en passiv investering på over 5 %.
The share price as of September 10, 2025 is 10,15 / share. Previously, on September 11, 2024, the share price was 11,46 / share. This represents a decline of 11,43% over that period.

Fondssentiment-score
Fondssentiment Score (også kjent som akkumulering av eierskap poengsum) viser hvilke aksjer som er mest kjøpt av fond. Den er resultatet av en sofistikert, kvantitativ flerfaktormodell som identifiserer selskaper med de høyeste nivåene av institusjonell akkumulering. Beregningsmodellen for poeng bruker en kombinasjon av den totale økningen i antall offentliggjorte eiere, endringer i porteføljeallokeringen til disse eierne og andre beregninger. Tallet går fra 0 til 100, der høyere tall indikerer en høyere grad av akkumulering i forhold til sammenlignbare selskaper, der 50 er gjennomsnittet.
Oppdateringsfrekvens: Daglig
Sjekk ut Ownership Explorer, som inneholder en liste over de høyest rangerte selskapene.
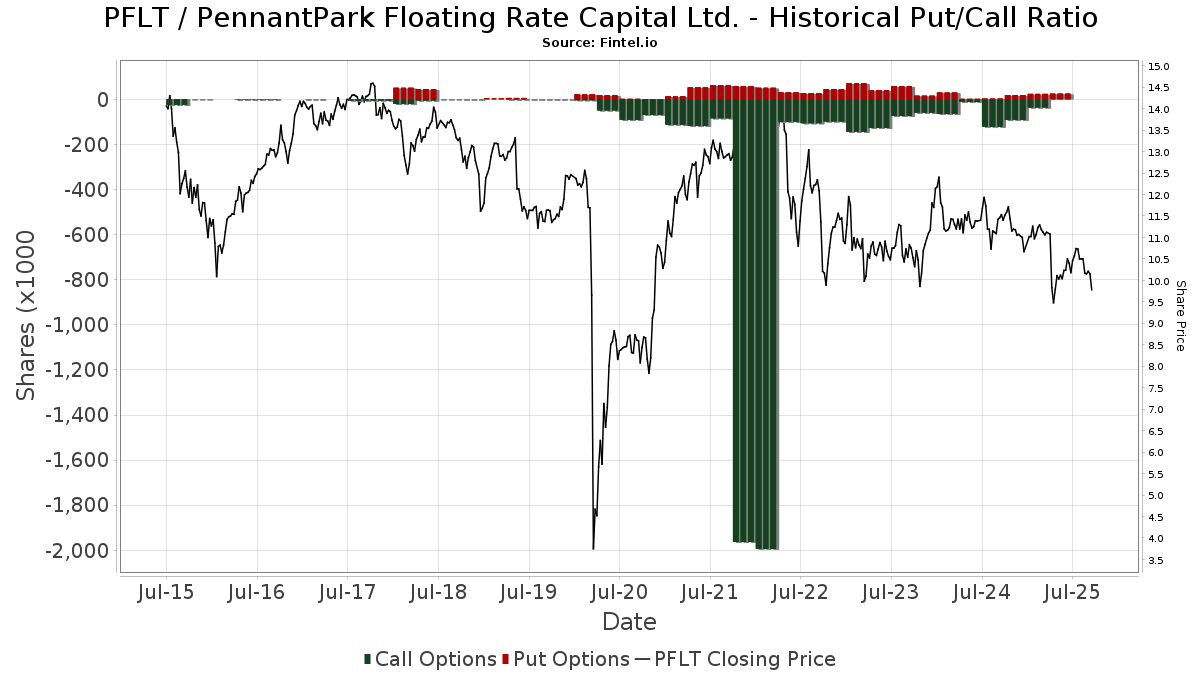
Institusjonell Put/Call-forhold
I tillegg til å rapportere standard aksje- og gjeldsemisjoner må institusjoner med mer enn 100 millioner kroner i forvaltningskapital også oppgi beholdningen av put- og callopsjoner. Siden put-opsjoner generelt indikerer et negativt sentiment, og call-opsjoner indikerer et positivt sentiment, kan vi få et inntrykk av det generelle institusjonelle sentimentet ved å plotte forholdet mellom put- og call-opsjoner. Diagrammet til høyre viser det historiske forholdet mellom put- og call-opsjoner for dette instrumentet.
Ved å bruke Put/Call-forholdet som en indikator på investorsentimentet kan man overvinne en av de viktigste svakhetene ved å bruke totalt institusjonelt eierskap, nemlig at en betydelig andel av forvaltningskapitalen investeres passivt for å følge indekser. Passivt forvaltede fond kjøper vanligvis ikke opsjoner, slik at indikatoren for put/call-forhold i større grad gjenspeiler stemningen i aktivt forvaltede fond.
13F- og NPORT-arkiveringer
Detaljer om 13F-arkiveringer er gratis. Detaljer om NP-arkiveringer krever et premium-medlemskap. Grønne rader indikerer nye posisjoner. Røde rader indikerer lukkede posisjoner. Klikk på lenke ikonet for å se hele transaksjonshistorikken.
Oppgrader
for å låse opp premiedata og eksportere til Excel. ![]() .
.
| Fildato | Kilde | Investor | Type | Gjennomsnittlig pris (estimert) |
Aksjer | Δ Aksjer (%) |
Rapportert verdi ($1000) | Verdi (%) | Portallokering (%) | |
|---|---|---|---|---|---|---|---|---|---|---|
| 2025-08-12 | 13F | Change Path, LLC | 12 006 | 124 | ||||||
| 2025-08-04 | 13F | Muzinich & Co., Inc. | 104 859 | 103,00 | 1 083 | 87,37 | ||||
| 2025-07-29 | 13F | Private Trust Co Na | 2 530 | 0,00 | 26 | −7,14 | ||||
| 2025-07-30 | 13F | FNY Investment Advisers, LLC | 1 200 | 0,00 | 0 | |||||
| 2025-05-15 | 13F | Gwn Securities Inc. | 0 | −100,00 | 0 | −100,00 | ||||
| 2025-08-14 | 13F | Two Sigma Securities, Llc | 0 | −100,00 | 0 | |||||
| 2025-05-14 | 13F | Group One Trading, L.p. | Call | 0 | −100,00 | 0 | −100,00 | |||
| 2025-08-14 | 13F | Van Eck Associates Corp | 2 358 575 | 20,52 | 24 | 14,29 | ||||
| 2025-07-23 | 13F | Fulton Breakefield Broenniman Llc | 11 798 | 0,00 | 122 | −8,33 | ||||
| 2025-08-12 | 13F | Cornerstone Wealth Management, LLC | 64 809 | −12,10 | 669 | −18,91 | ||||
| 2025-08-12 | 13F | LPL Financial LLC | 244 157 | −44,38 | 2 522 | −48,66 | ||||
| 2025-04-22 | 13F | Synergy Financial Management, LLC | 0 | −100,00 | 0 | −100,00 | ||||
| 2025-08-06 | 13F | Commonwealth Equity Services, Llc | 91 475 | 12,50 | 1 | |||||
| 2025-08-11 | 13F | Principal Securities, Inc. | 0 | −100,00 | 0 | |||||
| 2025-05-14 | 13F | Virtus ETF Advisers LLC | 0 | −100,00 | 0 | −100,00 | ||||
| 2025-08-12 | 13F | Trexquant Investment LP | 269 430 | −35,34 | 2 783 | −40,30 | ||||
| 2025-08-07 | 13F | PFG Advisors | 110 108 | 1,81 | 1 137 | −6,03 | ||||
| 2025-07-28 | 13F | BRYN MAWR TRUST Co | 3 363 | 0,00 | 35 | −8,11 | ||||
| 2025-08-05 | 13F | Strategic Financial Concepts, LLC | 63 200 | −1,50 | 648 | −9,76 | ||||
| 2025-08-14 | 13F | D. E. Shaw & Co., Inc. | 0 | −100,00 | 0 | |||||
| 2025-08-13 | 13F | Garner Asset Management Corp | 14 267 | −2,41 | 147 | −9,82 | ||||
| 2025-08-11 | 13F | Pin Oak Investment Advisors Inc | 0 | 0 | ||||||
| 2025-08-08 | 13F | Larson Financial Group LLC | 511 | 41,94 | 5 | 25,00 | ||||
| 2025-08-12 | 13F | Global Retirement Partners, LLC | 3 928 | −79,34 | 41 | −80,68 | ||||
| 2025-08-13 | 13F | Continuum Advisory, LLC | 0 | −100,00 | 0 | |||||
| 2025-04-24 | 13F | Allspring Global Investments Holdings, LLC | 0 | −100,00 | 0 | −100,00 | ||||
| 2025-07-08 | 13F | Parallel Advisors, LLC | 0 | −100,00 | 0 | |||||
| 2025-08-04 | 13F | Creekmur Asset Management LLC | 9 | 12,50 | 0 | |||||
| 2025-08-07 | 13F | Allworth Financial LP | 2 777 | 1 603,68 | 29 | 2 700,00 | ||||
| 2025-08-14 | 13F | Schonfeld Strategic Advisors LLC | 18 126 | 187 | ||||||
| 2025-08-11 | 13F | Empowered Funds, LLC | 10 193 | −8,33 | 105 | −15,32 | ||||
| 2025-07-28 | NP | FXED - Sound Enhanced Fixed Income ETF | 104 495 | 1,12 | 1 076 | −8,11 | ||||
| 2025-04-10 | 13F | Firethorn Wealth Partners, Llc | 0 | −100,00 | 0 | −100,00 | ||||
| 2025-04-23 | 13F | Walkner Condon Financial Advisors LLC | 0 | −100,00 | 0 | −100,00 | ||||
| 2025-07-17 | 13F | Vermillion Wealth Management, Inc. | 500 | 0,00 | 5 | 0,00 | ||||
| 2025-09-04 | 13F/A | Advisor Group Holdings, Inc. | 162 389 | 38,36 | 1 678 | 27,72 | ||||
| 2025-08-13 | 13F | Lido Advisors, LLC | 16 381 | 171 | ||||||
| 2025-08-07 | 13F | Resources Investment Advisors, LLC. | 12 543 | 0,00 | 130 | −7,86 | ||||
| 2025-08-14 | 13F | Aquatic Capital Management LLC | 0 | −100,00 | 0 | |||||
| 2025-08-13 | 13F | Virtus Investment Advisers, Inc. | 88 549 | −10,61 | 915 | −17,51 | ||||
| 2025-08-12 | 13F | BlackRock, Inc. | 500 758 | 30,73 | 5 173 | 20,67 | ||||
| 2025-08-21 | NP | BIZD - VanEck Vectors BDC Income ETF | 2 247 824 | 16,02 | 23 220 | 7,11 | ||||
| 2025-08-06 | 13F | Golden State Wealth Management, LLC | 9 756 | 101 | ||||||
| 2025-08-11 | 13F | Citigroup Inc | 34 398 | 218,56 | 355 | 195,83 | ||||
| 2025-07-10 | 13F | Sovran Advisors, LLC | 34 184 | 2,01 | 361 | 10,77 | ||||
| 2025-08-11 | 13F | Delta Asset Management Llc/tn | 943 | 0,00 | 10 | −10,00 | ||||
| 2025-08-14 | 13F | Mariner, LLC | 13 296 | 137 | ||||||
| 2025-08-13 | 13F | Marshall Wace, Llp | 1 439 742 | −16,75 | 14 873 | −23,15 | ||||
| 2025-08-14 | 13F | Mpwm Advisory Solutions, Llc | 5 000 | 0,00 | 52 | −7,27 | ||||
| 2025-08-14 | 13F | Sunbelt Securities, Inc. | 8 224 | −26,73 | 90 | −28,80 | ||||
| 2025-08-08 | 13F | Investment Partners, Ltd. | 10 000 | 0,00 | 103 | −7,21 | ||||
| 2025-08-14 | 13F | Royal Bank Of Canada | 19 604 | −32,18 | 202 | −37,46 | ||||
| 2025-07-18 | 13F | SOA Wealth Advisors, LLC. | 0 | −100,00 | 0 | |||||
| 2025-08-06 | 13F | AE Wealth Management LLC | 21 641 | 18,74 | 224 | 9,85 | ||||
| 2025-08-14 | 13F | Brevan Howard Capital Management LP | 141 985 | 118,14 | 1 467 | 101,37 | ||||
| 2025-05-08 | 13F | We Are One Seven, LLC | 0 | −100,00 | 0 | −100,00 | ||||
| 2025-08-13 | 13F | Guggenheim Capital Llc | 51 986 | 6,32 | 537 | −1,83 | ||||
| 2025-08-14 | 13F | Financial Network Wealth Advisors LLC | 1 426 | 0,00 | 15 | −6,67 | ||||
| 2025-08-14 | 13F | AllSquare Wealth Management LLC | 9 200 | 0,00 | 95 | −6,86 | ||||
| 2025-08-13 | 13F | Northern Trust Corp | 41 596 | 181,36 | 430 | 160,00 | ||||
| 2025-08-14 | 13F | Glenview Trust Co | 10 650 | 110 | ||||||
| 2025-05-12 | 13F | Simplex Trading, Llc | Call | 0 | −100,00 | 0 | ||||
| 2025-04-29 | 13F | Raleigh Capital Management Inc. | 0 | −100,00 | 0 | −100,00 | ||||
| 2025-08-13 | 13F | M&t Bank Corp | 21 899 | 0,00 | 226 | −7,76 | ||||
| 2025-05-12 | 13F | National Bank Of Canada /fi/ | 0 | −100,00 | 0 | |||||
| 2025-07-18 | 13F | PFG Investments, LLC | 118 908 | 5,61 | 1 228 | −2,46 | ||||
| 2025-05-29 | NP | JAFEX - Total Stock Market Index Trust NAV | 19 | −97,50 | 0 | −100,00 | ||||
| 2025-08-13 | 13F | Quadrature Capital Ltd | 0 | −100,00 | 0 | |||||
| 2025-08-12 | 13F | Entropy Technologies, LP | 12 594 | −80,06 | 130 | −81,59 | ||||
| 2025-06-27 | NP | LBO - WHITEWOLF Publicly Listed Private Equity ETF | 11 119 | 14,28 | 112 | 3,70 | ||||
| 2025-08-12 | 13F | Calton & Associates, Inc. | 10 938 | 113 | ||||||
| 2025-08-08 | 13F | Strategies Wealth Advisors, LLC | 12 921 | 2,96 | 133 | −5,00 | ||||
| 2025-05-08 | 13F | Arkadios Wealth Advisors | 0 | −100,00 | 0 | −100,00 | ||||
| 2025-08-12 | 13F | PSI Advisors, LLC | 0 | −100,00 | 0 | |||||
| 2025-08-13 | 13F | Quantbot Technologies LP | 21 234 | 219 | ||||||
| 2025-08-14 | 13F | Bnp Paribas Arbitrage, Sa | 5 284 | 55 | ||||||
| 2025-08-14 | 13F | Nebula Research & Development LLC | 56 045 | 31,09 | 579 | 20,92 | ||||
| 2025-08-06 | 13F | Yelin Lapidot Holdings Management Ltd. | 19 500 | 0,00 | 201 | −7,80 | ||||
| 2025-05-15 | 13F | Oxford Asset Management Llp | 12 186 | 136 | ||||||
| 2025-08-15 | 13F | Tower Research Capital LLC (TRC) | 358 | −92,84 | 4 | −94,55 | ||||
| 2025-08-14 | 13F | Altshuler Shaham Ltd | 1 730 086 | 9,98 | 17 872 | 1,52 | ||||
| 2025-07-30 | 13F | Mid-American Wealth Advisory Group, Inc. | 485 | 5 | ||||||
| 2025-07-28 | 13F | Harbour Investments, Inc. | 1 000 | 0,00 | 10 | −9,09 | ||||
| 2025-08-13 | 13F | EverSource Wealth Advisors, LLC | 1 452 | 1 257,01 | 15 | 1 300,00 | ||||
| 2025-05-12 | 13F | Fmr Llc | 0 | −100,00 | 0 | |||||
| 2025-08-12 | 13F | Magnetar Financial LLC | 0 | −100,00 | 0 | |||||
| 2025-08-12 | 13F | Advisors Asset Management, Inc. | 329 829 | −0,39 | 3 407 | −8,04 | ||||
| 2025-07-17 | 13F | Sound Income Strategies, LLC | 3 904 625 | 8,91 | 40 335 | 0,54 | ||||
| 2025-08-14 | 13F | Camden Capital, LLC | 26 658 | 0,00 | 275 | −7,72 | ||||
| 2025-07-29 | 13F | TrueMark Investments, LLC | 0 | −100,00 | 0 | −100,00 | ||||
| 2025-08-14 | 13F | Raymond James Financial Inc | 25 177 | −18,34 | 260 | −24,42 | ||||
| 2025-08-11 | 13F | HighTower Advisors, LLC | 95 188 | −1,24 | 983 | −8,81 | ||||
| 2025-08-14 | 13F | Murphy & Mullick Capital Management Corp | 1 038 | 2,67 | 11 | −9,09 | ||||
| 2025-08-14 | 13F | Ameriprise Financial Inc | 69 959 | 7,41 | 707 | −3,28 | ||||
| 2025-08-11 | 13F | NewEdge Wealth, LLC | 295 639 | 3,33 | 3 075 | −3,97 | ||||
| 2025-08-14 | 13F | Hrt Financial Lp | 0 | −100,00 | 0 | |||||
| 2025-08-26 | NP | MCTOX - Modern Capital Tactical Opportunities Fund Class A Shares | 0 | −100,00 | 0 | −100,00 | ||||
| 2025-08-13 | 13F | Russell Investments Group, Ltd. | 0 | −100,00 | 0 | |||||
| 2025-07-17 | 13F | Janney Montgomery Scott LLC | 41 874 | −4,21 | 0 | |||||
| 2025-08-14 | 13F | Balyasny Asset Management Llc | 243 615 | −58,07 | 2 517 | −61,30 | ||||
| 2025-08-14 | 13F | Citadel Advisors Llc | 0 | −100,00 | 0 | |||||
| 2025-04-21 | 13F | Ronald Blue Trust, Inc. | 0 | −100,00 | 0 | −100,00 | ||||
| 2025-08-14 | 13F | Bank Of America Corp /de/ | 14 429 | −3,74 | 149 | −10,78 | ||||
| 2025-08-11 | 13F | Private Advisor Group, LLC | 16 438 | 2,41 | 170 | −5,59 | ||||
| 2025-07-11 | 13F | Farther Finance Advisors, LLC | 1 594 | 5,15 | 16 | 0,00 | ||||
| 2025-08-13 | 13F | ExodusPoint Capital Management, LP | 32 900 | −54,18 | 0 | |||||
| 2025-08-14 | 13F | Group One Trading, L.p. | 95 | 0,00 | 1 | −100,00 | ||||
| 2025-07-18 | 13F | Truist Financial Corp | 15 795 | 5,12 | 163 | −2,98 | ||||
| 2025-08-12 | 13F | MAI Capital Management | 3 296 | −4,79 | 34 | −10,53 | ||||
| 2025-05-16 | 13F/A | Goldman Sachs Group Inc | 0 | −100,00 | 0 | −100,00 | ||||
| 2025-08-13 | 13F | Jump Financial, LLC | 20 995 | 217 | ||||||
| 2025-07-22 | 13F | Miracle Mile Advisors, LLC | 11 388 | 2,97 | 118 | −4,88 | ||||
| 2025-08-01 | 13F | Y-Intercept (Hong Kong) Ltd | 207 207 | 734,74 | 2 140 | 672,56 | ||||
| 2025-08-12 | 13F | Hillsdale Investment Management Inc. | 0 | −100,00 | 0 | |||||
| 2025-08-14 | 13F | Susquehanna International Group, Llp | 110 971 | 328,51 | 1 146 | 296,54 | ||||
| 2025-08-12 | 13F | Dynamic Technology Lab Private Ltd | 14 271 | 5,32 | 147 | −2,65 | ||||
| 2025-08-13 | 13F | PharVision Advisers, LLC | 0 | −100,00 | 0 | |||||
| 2025-08-14 | 13F | Scoggin Management Lp | 0 | −100,00 | 0 | |||||
| 2025-08-06 | 13F | First Horizon Advisors, Inc. | 566 | 6 | ||||||
| 2025-08-12 | 13F | Virtu Financial LLC | 0 | −100,00 | 0 | |||||
| 2025-08-14 | 13F | Wells Fargo & Company/mn | 94 376 | 245,17 | 975 | 219,34 | ||||
| 2025-08-14 | 13F | Stifel Financial Corp | 58 603 | −2,99 | 605 | −10,37 | ||||
| 2025-08-11 | 13F | Synergy Investment Management, LLC | 25 011 | 10,42 | 258 | 1,98 | ||||
| 2025-08-14 | 13F | GWM Advisors LLC | 4 714 | 0,00 | 49 | −7,69 | ||||
| 2025-08-12 | 13F | CIBC Private Wealth Group, LLC | 7 122 | 0,00 | 74 | 12,31 | ||||
| 2025-08-14 | 13F | Millennium Management Llc | 720 074 | −39,83 | 7 438 | −44,46 | ||||
| 2025-08-08 | 13F | Hartland & Co., LLC | 0 | −100,00 | 0 | |||||
| 2025-04-30 | 13F | POM Investment Strategies, LLC | 0 | −100,00 | 0 | −100,00 | ||||
| 2025-08-12 | 13F | Proequities, Inc. | Put | 0 | 0 | |||||
| 2025-08-14 | 13F | Citadel Advisors Llc | Put | 22 900 | 116,04 | 237 | 100,00 | |||
| 2025-08-12 | 13F | Proequities, Inc. | Call | 0 | 0 | |||||
| 2025-08-14 | 13F | Two Sigma Advisers, Lp | 653 075 | −48,63 | 6 746 | −52,58 | ||||
| 2025-08-12 | 13F | Proequities, Inc. | 0 | 0 | ||||||
| 2025-08-14 | 13F | First Foundation Advisors | 12 393 | 0,00 | 128 | −7,25 | ||||
| 2025-07-31 | 13F | Optimum Investment Advisors | 17 500 | 0,00 | 181 | −7,69 | ||||
| 2025-07-31 | 13F | Sumitomo Mitsui Trust Holdings, Inc. | 81 236 | 57,27 | 839 | 45,16 | ||||
| 2025-06-25 | NP | VPC - Virtus Private Credit Strategy ETF | 90 483 | 1,15 | 915 | −8,69 | ||||
| 2025-08-14 | 13F | Citadel Advisors Llc | Call | 0 | −100,00 | 0 | ||||
| 2025-08-05 | 13F | Huntington National Bank | 0 | −100,00 | 0 | |||||
| 2025-08-14 | 13F | UBS Group AG | 1 117 647 | 81,73 | 11 545 | 67,76 | ||||
| 2025-07-17 | 13F | GraniteShares Advisors LLC | 255 250 | 6,67 | 2 637 | −1,53 | ||||
| 2025-08-12 | 13F | XTX Topco Ltd | 0 | −100,00 | 0 | |||||
| 2025-08-26 | NP | FTKI - First Trust Small Cap BuyWrite Income ETF | 0 | −100,00 | 0 | −100,00 | ||||
| 2025-07-16 | 13F | ORG Partners LLC | 1 500 | 0,00 | 16 | −6,25 | ||||
| 2025-08-11 | 13F | Hexagon Capital Partners LLC | 0 | −100,00 | 0 | |||||
| 2025-07-28 | NP | KBWD - Invesco KBW High Dividend Yield Financial ETF This fund is a listed as child fund of Invesco Ltd. and if that institution has disclosed ownership in this security, then these positions will not be double counted when calculating total shares and total value | 1 032 944 | 5,54 | 10 639 | −4,14 | ||||
| 2025-08-14 | 13F | Beacon Investment Advisors Llc | 19 886 | 1,36 | 204 | −7,31 | ||||
| 2025-08-27 | 13F/A | Squarepoint Ops LLC | 0 | −100,00 | 0 | −100,00 | ||||
| 2025-07-15 | 13F | Graypoint LLC | 75 302 | 2,96 | 778 | −5,01 | ||||
| 2025-07-09 | 13F | Westbourne Investments, Inc. | 19 175 | −5,59 | 198 | −12,78 | ||||
| 2025-07-24 | 13F | Us Bancorp \de\ | 4 000 | −0,12 | 41 | −6,82 | ||||
| 2025-08-29 | NP | GraniteShares ETF Trust - GraniteShares HIPS US High Income ETF | 255 250 | 6,67 | 2 637 | −1,53 | ||||
| 2025-08-13 | 13F | Natixis | 44 576 | 0,00 | 460 | −7,63 | ||||
| 2025-08-14 | 13F | Qube Research & Technologies Ltd | 798 816 | −20,27 | 8 252 | −26,40 | ||||
| 2025-08-12 | 13F | Jpmorgan Chase & Co | 51 706 | −41,10 | 534 | −45,62 | ||||
| 2025-07-25 | 13F | Cwm, Llc | 4 771 | 0 | ||||||
| 2025-07-31 | 13F | Cambridge Investment Research Advisors, Inc. | 78 176 | 32,39 | 1 | |||||
| 2025-08-15 | 13F | Morgan Stanley | 388 070 | −30,43 | 4 009 | −35,78 | ||||
| 2025-04-22 | 13F | Jmac Enterprises Llc | 0 | −100,00 | 0 | −100,00 | ||||
| 2025-07-31 | 13F | Caitong International Asset Management Co., Ltd | 177 | 17 600,00 | 2 | |||||
| 2025-08-13 | 13F | Invesco Ltd. | 1 076 310 | 2,52 | 11 118 | −5,35 | ||||
| 2025-08-14 | 13F | Jane Street Group, Llc | 0 | −100,00 | 0 | |||||
| 2025-08-14 | 13F | State Street Corp | 84 170 | 257,74 | 878 | 231,32 | ||||
| 2025-07-30 | 13F | Denali Advisors Llc | 69 103 | −2,61 | 714 | −10,09 | ||||
| 2025-07-24 | 13F | IFP Advisors, Inc | 3 434 | 3,00 | 35 | −5,41 | ||||
| 2025-08-05 | 13F | Simplex Trading, Llc | 30 528 | 2 375,91 | 0 | |||||
| 2025-08-08 | 13F | Cetera Investment Advisers | 63 704 | 2,13 | 658 | −5,60 | ||||
| 2025-08-05 | 13F | Simplex Trading, Llc | Put | 2 400 | 200,00 | 0 | ||||
| 2025-05-30 | NP | ERNZ - TrueShares Active Yield ETF | 310 616 | 735,71 | 3 476 | 755,91 | ||||
| 2025-08-01 | 13F | Envestnet Asset Management Inc | 36 933 | −1,67 | 382 | −9,29 | ||||
| 2025-08-06 | 13F | Wedbush Securities Inc | 139 202 | 5,04 | 1 | 0,00 | ||||
| 2025-05-01 | 13F | MQS Management LLC | 0 | −100,00 | 0 | −100,00 | ||||
| 2025-07-29 | 13F | Harbor Asset Planning, Inc. | 526 | 5 | ||||||
| 2025-08-12 | 13F | Legal & General Group Plc | 578 019 | 4,20 | 5 974 | −3,55 | ||||
| 2025-08-15 | 13F | CI Private Wealth, LLC | 53 747 | 247,00 | 555 | 220,81 | ||||
| 2025-08-14 | 13F | Quarry LP | 0 | −100,00 | 0 | |||||
| 2025-05-16 | 13F | Coppell Advisory Solutions LLC | 0 | −100,00 | 0 | |||||
| 2025-08-08 | 13F | Foundations Investment Advisors, LLC | 16 652 | 172 | ||||||
| 2025-04-24 | 13F | Mirae Asset Global Investments Co., Ltd. | 0 | −100,00 | 0 | −100,00 | ||||
| 2025-08-13 | 13F | Northwestern Mutual Wealth Management Co | 4 000 | 41 | ||||||
| 2025-08-15 | 13F | Great West Life Assurance Co /can/ | 86 588 | 3,37 | 1 | |||||
| 2025-08-14 | 13F | Two Sigma Investments, Lp | 942 801 | −45,81 | 9 739 | −49,97 | ||||
| 2025-07-31 | 13F | Sage Mountain Advisors LLC | 10 000 | 0,00 | 103 | −7,21 | ||||
| 2025-08-14 | 13F | Susquehanna International Group, Llp | Call | 0 | −100,00 | 0 | ||||
| 2025-08-14 | 13F | DRW Securities, LLC | 33 593 | 347 | ||||||
| 2025-08-14 | 13F | Susquehanna International Group, Llp | Put | 0 | −100,00 | 0 | ||||
| 2025-08-14 | 13F | Toroso Investments, LLC | 105 656 | 2,25 | 1 091 | −5,62 | ||||
| 2025-08-05 | 13F | Sigma Planning Corp | 10 439 | 0,53 | 108 | −7,76 | ||||
| 2025-05-12 | 13F | Connor, Clark & Lunn Investment Management Ltd. | 0 | −100,00 | 0 | −100,00 |
Other Listings
| GB:0KH0 | USD 10,21 |