Grunnleggende statistikk
| Institusjonelle eiere | 124 total, 124 long only, 0 short only, 0 long/short - change of −0,80% MRQ |
| Gjennomsnittlig porteføljeallokering | 0.0813 % - change of 29,68% MRQ |
| Institusjonelle aksjer (Long) | 7 376 713 (ex 13D/G) - change of 0,16MM shares 2,25% MRQ |
| Institusjonell verdi (Long) | $ 380 419 USD ($1000) |
Institusjonelt eierskap og aksjonærer
ALPS ETF Trust - ALPS | O'Shares U.S. Quality Dividend ETF (US:OUSA) har 124 institusjonelle eiere og aksjonærer som har sendt inn 13D/G- eller 13F-skjemaer til Securities Exchange Commission (SEC). Disse institusjonene eier til sammen 7,376,713 aksjer. De største aksjonærene inkluderer Morgan Stanley, LPL Financial LLC, Thurston, Springer, Miller, Herd & Titak, Inc., Ameriprise Financial Inc, Bank Of America Corp /de/, Wells Fargo & Company/mn, Royal Bank Of Canada, Raymond James Financial Inc, We Are One Seven, LLC, and Kestra Advisory Services, LLC .
ALPS ETF Trust - ALPS | O'Shares U.S. Quality Dividend ETF (BATS:OUSA) institusjonell eierstruktur viser nåværende posisjoner i selskapet fordelt på institusjoner og fond, samt de siste endringene i posisjonsstørrelse. De største aksjonærene kan være individuelle investorer, verdipapirfond, hedgefond eller institusjoner. Schedule 13D indikerer at investoren eier (eller har eid) mer enn 5 % av selskapet og har til hensikt (eller hadde til hensikt) å aktivt forfølge en endring i forretningsstrategien. Schedule 13G indikerer en passiv investering på over 5 %.
The share price as of September 12, 2025 is 56,30 / share. Previously, on September 13, 2024, the share price was 53,18 / share. This represents an increase of 5,86% over that period.

Fondssentiment-score
Fondssentiment Score (også kjent som akkumulering av eierskap poengsum) viser hvilke aksjer som er mest kjøpt av fond. Den er resultatet av en sofistikert, kvantitativ flerfaktormodell som identifiserer selskaper med de høyeste nivåene av institusjonell akkumulering. Beregningsmodellen for poeng bruker en kombinasjon av den totale økningen i antall offentliggjorte eiere, endringer i porteføljeallokeringen til disse eierne og andre beregninger. Tallet går fra 0 til 100, der høyere tall indikerer en høyere grad av akkumulering i forhold til sammenlignbare selskaper, der 50 er gjennomsnittet.
Oppdateringsfrekvens: Daglig
Sjekk ut Ownership Explorer, som inneholder en liste over de høyest rangerte selskapene.
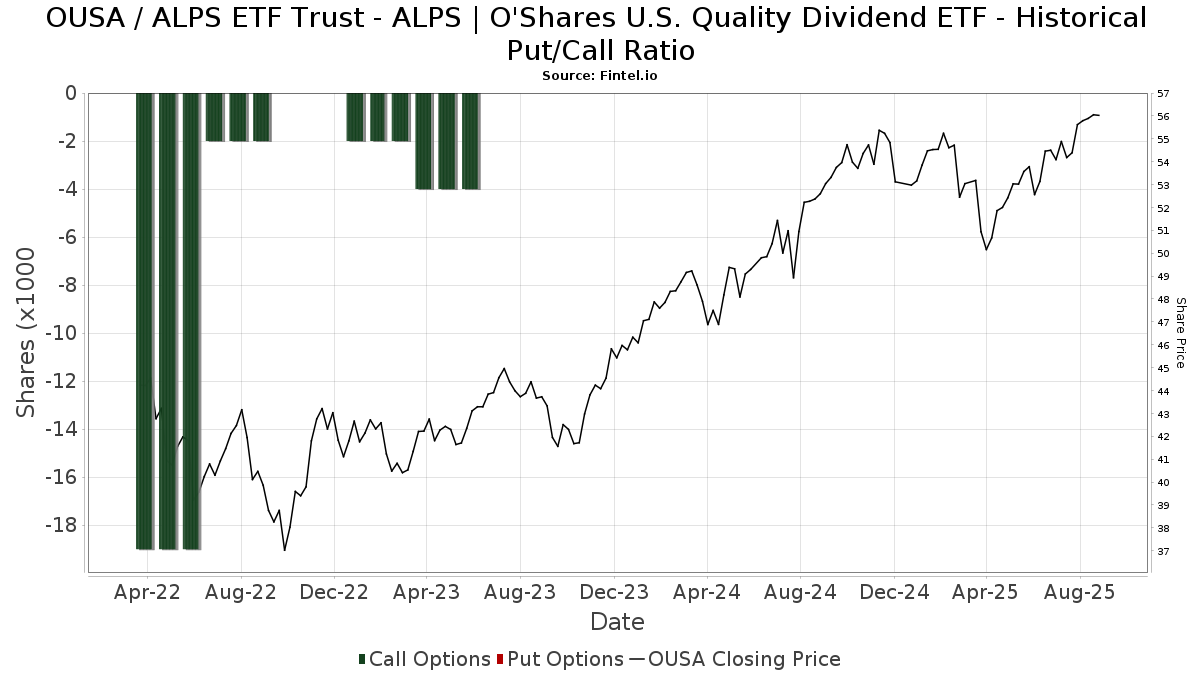
Institusjonell Put/Call-forhold
I tillegg til å rapportere standard aksje- og gjeldsemisjoner må institusjoner med mer enn 100 millioner kroner i forvaltningskapital også oppgi beholdningen av put- og callopsjoner. Siden put-opsjoner generelt indikerer et negativt sentiment, og call-opsjoner indikerer et positivt sentiment, kan vi få et inntrykk av det generelle institusjonelle sentimentet ved å plotte forholdet mellom put- og call-opsjoner. Diagrammet til høyre viser det historiske forholdet mellom put- og call-opsjoner for dette instrumentet.
Ved å bruke Put/Call-forholdet som en indikator på investorsentimentet kan man overvinne en av de viktigste svakhetene ved å bruke totalt institusjonelt eierskap, nemlig at en betydelig andel av forvaltningskapitalen investeres passivt for å følge indekser. Passivt forvaltede fond kjøper vanligvis ikke opsjoner, slik at indikatoren for put/call-forhold i større grad gjenspeiler stemningen i aktivt forvaltede fond.
13F- og NPORT-arkiveringer
Detaljer om 13F-arkiveringer er gratis. Detaljer om NP-arkiveringer krever et premium-medlemskap. Grønne rader indikerer nye posisjoner. Røde rader indikerer lukkede posisjoner. Klikk på lenke ikonet for å se hele transaksjonshistorikken.
Oppgrader
for å låse opp premiedata og eksportere til Excel. ![]() .
.
| Fildato | Kilde | Investor | Type | Gjennomsnittlig pris (estimert) |
Aksjer | Δ Aksjer (%) |
Rapportert verdi ($1000) | Verdi (%) | Portallokering (%) | |
|---|---|---|---|---|---|---|---|---|---|---|
| 2025-08-14 | 13F | GWM Advisors LLC | 62 761 | 0,12 | 3 387 | 1,56 | ||||
| 2025-08-11 | 13F | Principal Securities, Inc. | 524 | 0,00 | 28 | 3,70 | ||||
| 2025-04-16 | 13F | NorthCrest Asset Manangement, LLC | 0 | −100,00 | 0 | |||||
| 2025-08-14 | 13F | Comerica Bank | 2 884 | −1,70 | 156 | −0,64 | ||||
| 2025-07-25 | 13F | Sovereign Financial Group, Inc. | 23 286 | 2,88 | 1 257 | 4,32 | ||||
| 2025-07-28 | 13F | WealthPlan Investment Management, LLC | 35 623 | 4,34 | 1 923 | 5,84 | ||||
| 2025-08-12 | 13F | Atlas Capital Advisors Llc | 8 183 | 9,35 | 442 | 10,80 | ||||
| 2025-08-15 | 13F | Tower Research Capital LLC (TRC) | 5 111 | −48,66 | 276 | −48,02 | ||||
| 2025-07-16 | 13F | Signaturefd, Llc | 25 | −10,71 | 1 | 0,00 | ||||
| 2025-07-30 | 13F | Whittier Trust Co Of Nevada Inc | 1 000 | 0,00 | 54 | 0,00 | ||||
| 2025-08-13 | 13F | Russell Investments Group, Ltd. | 37 | 0,00 | 2 | 0,00 | ||||
| 2025-08-12 | 13F | O'shaughnessy Asset Management, Llc | 92 | 0,00 | 5 | 0,00 | ||||
| 2025-08-12 | 13F | Archer Investment Corp | 148 | 0,00 | 8 | 0,00 | ||||
| 2025-08-14 | 13F | Win Advisors, Inc | 0 | −100,00 | 0 | |||||
| 2025-08-14 | 13F | Royal Bank Of Canada | 326 911 | −2,55 | 17 643 | −1,18 | ||||
| 2025-08-14 | 13F | Two Sigma Investments, Lp | 18 900 | 1 020 | ||||||
| 2025-08-14 | 13F | Wells Fargo & Company/mn | 337 349 | −3,23 | 18 207 | −1,87 | ||||
| 2025-07-25 | 13F | Cwm, Llc | 300 | 0,00 | 0 | |||||
| 2025-08-11 | 13F | Private Advisor Group, LLC | 84 384 | −2,69 | 4 554 | −1,30 | ||||
| 2025-08-14 | 13F | Atomi Financial Group, Inc. | 10 726 | 5,61 | 579 | 7,04 | ||||
| 2025-07-16 | 13F | ORG Partners LLC | 3 838 | 0,37 | 210 | 2,96 | ||||
| 2025-08-08 | 13F | Compass Financial Services Inc | 187 | 0,00 | 10 | 11,11 | ||||
| 2025-04-30 | 13F | Sofos Investments, Inc. | 376 | 20 | ||||||
| 2025-07-25 | 13F | Hobbs Group Advisors, LLC | 4 127 | 1,88 | 223 | 3,26 | ||||
| 2025-08-05 | 13F | Fourth Dimension Wealth, LLC | 1 150 | 0,00 | 62 | 1,64 | ||||
| 2025-07-08 | 13F | Next Level Private LLC | 4 641 | 0,00 | 250 | 1,63 | ||||
| 2025-07-31 | 13F | Optimum Investment Advisors | 303 | 0,00 | 16 | 0,00 | ||||
| 2025-08-14 | 13F | Ameriprise Financial Inc | 454 805 | 9,65 | 24 520 | 11,11 | ||||
| 2025-08-14 | 13F | Goldman Sachs Group Inc | 57 539 | 1,52 | 3 105 | 2,95 | ||||
| 2025-08-12 | 13F | J.w. Cole Advisors, Inc. | 7 278 | 1,06 | 393 | 2,35 | ||||
| 2025-08-12 | 13F | Steward Partners Investment Advisory, Llc | 7 170 | 0,00 | 387 | 1,31 | ||||
| 2025-08-15 | 13F | Kestra Advisory Services, LLC | 245 610 | 4,64 | 13 256 | 6,12 | ||||
| 2025-07-17 | 13F | Grandview Asset Management LLC | 12 159 | −2,74 | 1 | |||||
| 2025-07-30 | 13F | Princeton Global Asset Management LLC | 424 | 0,00 | 23 | 0,00 | ||||
| 2025-07-31 | 13F | Cambridge Investment Research Advisors, Inc. | 6 382 | −29,37 | 0 | |||||
| 2025-08-19 | 13F | Newbridge Financial Services Group, Inc. | 10 726 | 579 | ||||||
| 2025-08-05 | 13F | Bank Of Montreal /can/ | 91 | 0,00 | 5 | 0,00 | ||||
| 2025-08-14 | 13F | Acas, Llc | 4 709 | 0,00 | 262 | 7,41 | ||||
| 2025-07-18 | 13F | TruNorth Capital Management, LLC | 418 | 0,48 | 23 | 0,00 | ||||
| 2025-08-14 | 13F | Integrated Wealth Concepts LLC | 6 854 | −4,74 | 370 | −3,40 | ||||
| 2025-07-08 | 13F/A | Salem Investment Counselors Inc | 1 350 | 8,00 | 73 | 9,09 | ||||
| 2025-07-22 | 13F | Beacon Financial Advisory LLC | 6 608 | 0,38 | 357 | 1,71 | ||||
| 2025-07-18 | 13F | USA Financial Portformulas Corp | 9 934 | 536 | ||||||
| 2025-08-08 | 13F | TD Capital Management LLC | 662 | 0,00 | 36 | 0,00 | ||||
| 2025-08-14 | 13F | Susquehanna International Group, Llp | 6 029 | −70,12 | 325 | −69,71 | ||||
| 2025-07-17 | 13F | Janney Montgomery Scott LLC | 169 186 | 21,11 | 9 | 28,57 | ||||
| 2025-08-13 | 13F | Northwestern Mutual Wealth Management Co | 5 213 | −5,24 | 281 | −3,77 | ||||
| 2025-07-15 | 13F | Capstone Wealth Management Group LLC | 5 330 | 288 | ||||||
| 2025-08-13 | 13F | Mount Yale Investment Advisors, LLC | 4 | 0 | ||||||
| 2025-05-01 | 13F | Quest 10 Wealth Builders, Inc. | 126 | 0,00 | 7 | 0,00 | ||||
| 2025-05-15 | 13F | Advisory Services Network, LLC | 0 | −100,00 | 0 | |||||
| 2025-07-07 | 13F | Park Edge Advisors, LLC | 21 500 | 7,38 | 1 160 | 8,92 | ||||
| 2025-07-28 | 13F | Mutual Advisors, LLC | 5 091 | 0,02 | 279 | 7,31 | ||||
| 2025-08-06 | 13F | AE Wealth Management LLC | 2 405 | 0,00 | 130 | 1,57 | ||||
| 2025-05-14 | 13F | Van Hulzen Asset Management, LLC | 0 | −100,00 | 0 | −100,00 | ||||
| 2025-08-05 | 13F | Sigma Planning Corp | 11 223 | 0,09 | 606 | 1,51 | ||||
| 2025-07-08 | 13F | Nbc Securities, Inc. | 919 | 0,33 | 0 | |||||
| 2025-07-15 | 13F | Fifth Third Bancorp | 140 | 0,00 | 8 | 0,00 | ||||
| 2025-08-11 | 13F | Citigroup Inc | 1 | 0,00 | 0 | |||||
| 2025-07-24 | 13F | Capital Advisors, Ltd. LLC | 15 969 | 0,08 | 1 | |||||
| 2025-07-14 | 13F | Park Avenue Securities Llc | 9 245 | 0 | ||||||
| 2025-08-14 | 13F | Avant Capital LLC | 32 794 | 3,97 | 1 770 | 5,42 | ||||
| 2025-08-15 | 13F | Morgan Stanley | 1 543 151 | 4,33 | 83 284 | 5,80 | ||||
| 2025-05-15 | 13F | Guardian Wealth Advisors, Llc / Nc | 0 | −100,00 | 0 | |||||
| 2025-07-07 | 13F | Thurston, Springer, Miller, Herd & Titak, Inc. | 521 180 | 12,13 | 28 128 | 13,71 | ||||
| 2025-08-12 | 13F | MAI Capital Management | 117 | 0,86 | 6 | 0,00 | ||||
| 2025-08-14 | 13F | Wiley Bros.-aintree Capital, Llc | 140 277 | −1,59 | 7 571 | 0,99 | ||||
| 2025-08-11 | 13F | NewEdge Wealth, LLC | 6 848 | −1,07 | 372 | 0,82 | ||||
| 2025-07-15 | 13F | Mather Group, Llc. | 0 | −100,00 | 0 | |||||
| 2025-08-14 | 13F | Glen Eagle Advisors, LLC | 322 | 0,31 | 17 | 0,00 | ||||
| 2025-08-14 | 13F | Fmr Llc | 4 324 | −7,74 | 233 | −6,43 | ||||
| 2025-08-12 | 13F | Global Retirement Partners, LLC | 0 | −100,00 | 0 | |||||
| 2025-07-23 | 13F | High Note Wealth, LLC | 1 793 | −10,04 | 97 | −9,43 | ||||
| 2025-07-29 | 13F | Stratos Wealth Partners, LTD. | 53 727 | 2,32 | 2 900 | 3,76 | ||||
| 2025-08-14 | 13F | Aqr Capital Management Llc | 0 | −100,00 | 0 | |||||
| 2025-07-22 | 13F | Highland Capital Management, Llc | 5 434 | 0,46 | 293 | 2,09 | ||||
| 2025-08-11 | 13F | HighTower Advisors, LLC | 9 020 | 0,01 | 487 | 1,46 | ||||
| 2025-08-14 | 13F | Mml Investors Services, Llc | 61 413 | −3,32 | 3 | 0,00 | ||||
| 2025-08-13 | 13F | Cresset Asset Management, LLC | 13 592 | 0,00 | 734 | 1,38 | ||||
| 2025-07-24 | 13F | Us Bancorp \de\ | 1 072 | 0,00 | 58 | 0,00 | ||||
| 2025-07-21 | 13F | Ameritas Advisory Services, LLC | 63 811 | 27,61 | 3 444 | 29,39 | ||||
| 2025-07-22 | 13F | Diligent Investors, LLC | 6 462 | −50,01 | 349 | −49,34 | ||||
| 2025-08-14 | 13F | Citadel Advisors Llc | 23 255 | 1 255 | ||||||
| 2025-08-01 | 13F | Envestnet Asset Management Inc | 81 118 | 0,94 | 4 378 | 2,34 | ||||
| 2025-08-11 | 13F | Intrepid Financial Planning Group LLC | 7 840 | 3,43 | 423 | 3,17 | ||||
| 2025-07-18 | 13F | Truist Financial Corp | 8 173 | 0,38 | 441 | 1,85 | ||||
| 2025-07-24 | 13F | Blair William & Co/il | 469 | 0,43 | 25 | 4,17 | ||||
| 2025-08-12 | 13F | Coldstream Capital Management Inc | 0 | −100,00 | 0 | |||||
| 2025-08-14 | 13F | UBS Group AG | 205 832 | 1,25 | 11 109 | 2,67 | ||||
| 2025-07-25 | 13F | Stephens Consulting, LLC | 3 607 | 0,00 | 195 | 1,57 | ||||
| 2025-08-14 | 13F/A | Rockefeller Capital Management L.P. | 206 149 | −5,62 | 11 126 | −4,29 | ||||
| 2025-08-13 | 13F | Cerity Partners LLC | 4 140 | 0,00 | 223 | 1,36 | ||||
| 2025-08-13 | 13F | Jones Financial Companies Lllp | 17 823 | 70,47 | 956 | 73,95 | ||||
| 2025-07-25 | 13F | Astoria Portfolio Advisors LLC. | 0 | −100,00 | 0 | |||||
| 2025-07-31 | 13F | Jackson Hole Capital Partners, LLC | 552 | 0,00 | 30 | 0,00 | ||||
| 2025-08-14 | 13F | Bank Of America Corp /de/ | 372 327 | −2,73 | 20 094 | −1,36 | ||||
| 2025-08-13 | 13F | Summit Financial, LLC | 7 236 | −6,44 | 391 | −5,11 | ||||
| 2025-07-16 | 13F | Beaumont Financial Advisors, LLC | 27 421 | −0,31 | 1 480 | 1,09 | ||||
| 2025-07-17 | 13F | Beacon Capital Management, LLC | 380 | 0,26 | 21 | 0,00 | ||||
| 2025-08-15 | 13F | Equitable Holdings, Inc. | 140 184 | −2,13 | 7 566 | −0,75 | ||||
| 2025-07-25 | 13F | Apollon Financial, LLC | 33 930 | −0,59 | 1 831 | 0,83 | ||||
| 2025-08-07 | 13F | CENTRAL TRUST Co | 1 076 | 0,00 | 58 | 1,75 | ||||
| 2025-08-12 | 13F | LPL Financial LLC | 547 091 | −0,05 | 29 526 | 1,36 | ||||
| 2025-08-13 | 13F | Beacon Pointe Advisors, LLC | 5 570 | 0,00 | 301 | 1,35 | ||||
| 2025-08-07 | 13F | Kestra Private Wealth Services, Llc | 100 810 | 2,52 | 5 441 | 3,96 | ||||
| 2025-08-08 | 13F | Symphony Financial Services, Inc. | 11 313 | 4,28 | 611 | 5,72 | ||||
| 2025-08-08 | 13F | Financial Gravity Companies, Inc. | 376 | 0,00 | 20 | 5,26 | ||||
| 2025-08-08 | 13F | Cetera Investment Advisers | 22 350 | −1,14 | 1 206 | 0,25 | ||||
| 2025-08-11 | 13F | Brown Brothers Harriman & Co | 2 173 | 0,00 | 117 | 1,74 | ||||
| 2025-08-08 | 13F | Kingsview Wealth Management, LLC | 13 430 | −2,78 | 725 | −1,50 | ||||
| 2025-07-25 | 13F | We Are One Seven, LLC | 259 981 | 5,61 | 14 031 | 7,10 | ||||
| 2025-08-04 | 13F | Flagship Harbor Advisors, Llc | 21 668 | 0,04 | 1 169 | 1,48 | ||||
| 2025-08-12 | 13F | Proequities, Inc. | 0 | 0 | ||||||
| 2025-08-06 | 13F | Wedbush Securities Inc | 9 062 | 0,00 | 0 | |||||
| 2025-08-11 | 13F | Alps Advisors Inc | 55 610 | 3 001 | ||||||
| 2025-07-28 | 13F | Rosenberg Matthew Hamilton | 318 | 0,00 | 17 | 6,25 | ||||
| 2025-08-14 | 13F | Mercer Global Advisors Inc /adv | 6 743 | 1,70 | 364 | 3,13 | ||||
| 2025-07-22 | 13F | DAVENPORT & Co LLC | 35 511 | 0,06 | 1 917 | 1,48 | ||||
| 2025-07-10 | 13F | Focus Financial Network, Inc. | 7 972 | −11,97 | 430 | −10,60 | ||||
| 2025-07-11 | 13F | Farther Finance Advisors, LLC | 42 | −74,85 | 2 | −75,00 | ||||
| 2025-07-31 | 13F | Oppenheimer & Co Inc | 8 905 | −13,42 | 481 | −12,25 | ||||
| 2025-08-14 | 13F | Mariner, LLC | 6 159 | 0,00 | 332 | 1,53 | ||||
| 2025-08-14 | 13F | Stifel Financial Corp | 90 521 | −13,52 | 4 885 | −12,30 | ||||
| 2025-06-25 | NP | RLGAX - RiverFront Asset Allocation Growth & Income Investor Shares | 55 610 | 2 884 | ||||||
| 2025-07-29 | 13F | Private Trust Co Na | 1 243 | 24,30 | 67 | 26,42 | ||||
| 2025-08-06 | 13F | New Millennium Group LLC | 0 | −100,00 | 0 | |||||
| 2025-08-12 | 13F | Nemes Rush Group LLC | 5 013 | −0,46 | 271 | 0,75 | ||||
| 2025-08-06 | 13F | Commonwealth Equity Services, Llc | 41 042 | 0,03 | 2 | 0,00 | ||||
| 2025-07-28 | 13F | BRYN MAWR TRUST Co | 1 569 | 0,00 | 85 | 1,20 | ||||
| 2025-09-04 | 13F/A | Advisor Group Holdings, Inc. | 65 977 | −15,45 | 3 562 | −14,25 | ||||
| 2025-07-10 | 13F | Wealth Enhancement Advisory Services, Llc | 69 158 | 0,48 | 3 787 | 3,41 | ||||
| 2025-08-12 | 13F | Jpmorgan Chase & Co | 7 478 | −14,14 | 404 | −12,96 | ||||
| 2025-08-14 | 13F | Raymond James Financial Inc | 285 148 | 3,26 | 15 389 | 4,72 | ||||
| 2025-07-15 | 13F | Burns Matteson Capital Management, LLC | 6 715 | −0,42 | 362 | 1,12 | ||||
| 2025-05-09 | 13F | Atria Wealth Solutions, Inc. | 0 | −100,00 | 0 | |||||
| 2025-05-12 | 13F | Independent Advisor Alliance | 0 | −100,00 | 0 | |||||
| 2025-08-14 | 13F | CoreCap Advisors, LLC | 140 | 0,00 | 8 | 0,00 | ||||
| 2025-04-16 | 13F | Kelly Financial Group Llc | 0 | −100,00 | 0 | |||||
| 2025-08-08 | 13F | Creative Planning | 7 200 | 0,00 | 389 | 1,31 |