Grunnleggende statistikk
| Institusjonelle eiere | 80 total, 77 long only, 0 short only, 3 long/short - change of 3,90% MRQ |
| Gjennomsnittlig porteføljeallokering | 0.0284 % - change of −25,48% MRQ |
| Institusjonelle aksjer (Long) | 4 590 997 (ex 13D/G) - change of −0,68MM shares −12,92% MRQ |
| Institusjonell verdi (Long) | $ 42 902 USD ($1000) |
Institusjonelt eierskap og aksjonærer
Mesoblast Limited - Depositary Receipt (Common Stock) (US:MESO) har 80 institusjonelle eiere og aksjonærer som har sendt inn 13D/G- eller 13F-skjemaer til Securities Exchange Commission (SEC). Disse institusjonene eier til sammen 4,590,997 aksjer. De største aksjonærene inkluderer QCSTRX - Stock Account Class R1, BlackRock, Inc., Morgan Stanley, IBB - iShares Nasdaq Biotechnology ETF, Goldman Sachs Group Inc, Susquehanna International Group, Llp, Summit X, LLC, UBS Group AG, Susquehanna International Group, Llp, and Citadel Advisors Llc .
Mesoblast Limited - Depositary Receipt (Common Stock) (NasdaqGS:MESO) institusjonell eierstruktur viser nåværende posisjoner i selskapet fordelt på institusjoner og fond, samt de siste endringene i posisjonsstørrelse. De største aksjonærene kan være individuelle investorer, verdipapirfond, hedgefond eller institusjoner. Schedule 13D indikerer at investoren eier (eller har eid) mer enn 5 % av selskapet og har til hensikt (eller hadde til hensikt) å aktivt forfølge en endring i forretningsstrategien. Schedule 13G indikerer en passiv investering på over 5 %.
The share price as of September 12, 2025 is 14,82 / share. Previously, on September 13, 2024, the share price was 6,22 / share. This represents an increase of 138,26% over that period.

Fondssentiment-score
Fondssentiment Score (også kjent som akkumulering av eierskap poengsum) viser hvilke aksjer som er mest kjøpt av fond. Den er resultatet av en sofistikert, kvantitativ flerfaktormodell som identifiserer selskaper med de høyeste nivåene av institusjonell akkumulering. Beregningsmodellen for poeng bruker en kombinasjon av den totale økningen i antall offentliggjorte eiere, endringer i porteføljeallokeringen til disse eierne og andre beregninger. Tallet går fra 0 til 100, der høyere tall indikerer en høyere grad av akkumulering i forhold til sammenlignbare selskaper, der 50 er gjennomsnittet.
Oppdateringsfrekvens: Daglig
Sjekk ut Ownership Explorer, som inneholder en liste over de høyest rangerte selskapene.
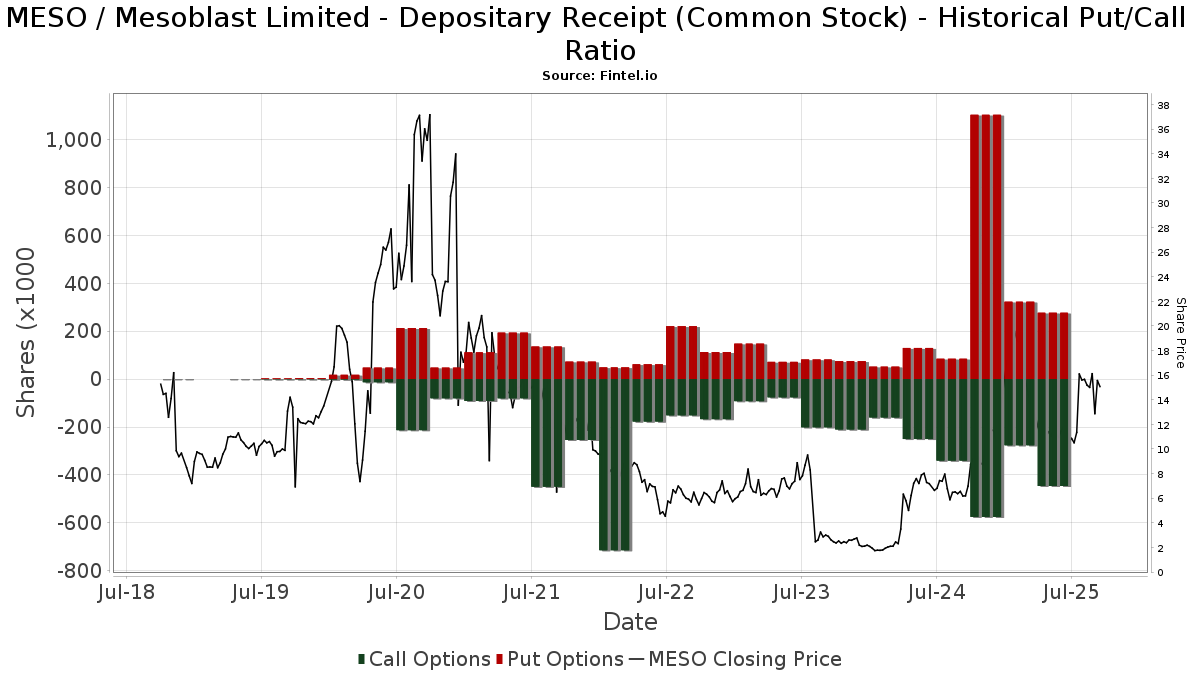
Institusjonell Put/Call-forhold
I tillegg til å rapportere standard aksje- og gjeldsemisjoner må institusjoner med mer enn 100 millioner kroner i forvaltningskapital også oppgi beholdningen av put- og callopsjoner. Siden put-opsjoner generelt indikerer et negativt sentiment, og call-opsjoner indikerer et positivt sentiment, kan vi få et inntrykk av det generelle institusjonelle sentimentet ved å plotte forholdet mellom put- og call-opsjoner. Diagrammet til høyre viser det historiske forholdet mellom put- og call-opsjoner for dette instrumentet.
Ved å bruke Put/Call-forholdet som en indikator på investorsentimentet kan man overvinne en av de viktigste svakhetene ved å bruke totalt institusjonelt eierskap, nemlig at en betydelig andel av forvaltningskapitalen investeres passivt for å følge indekser. Passivt forvaltede fond kjøper vanligvis ikke opsjoner, slik at indikatoren for put/call-forhold i større grad gjenspeiler stemningen i aktivt forvaltede fond.
13F- og NPORT-arkiveringer
Detaljer om 13F-arkiveringer er gratis. Detaljer om NP-arkiveringer krever et premium-medlemskap. Grønne rader indikerer nye posisjoner. Røde rader indikerer lukkede posisjoner. Klikk på lenke ikonet for å se hele transaksjonshistorikken.
Oppgrader
for å låse opp premiedata og eksportere til Excel. ![]() .
.
| Fildato | Kilde | Investor | Type | Gjennomsnittlig pris (estimert) |
Aksjer | Δ Aksjer (%) |
Rapportert verdi ($1000) | Verdi (%) | Portallokering (%) | |
|---|---|---|---|---|---|---|---|---|---|---|
| 2025-08-14 | 13F | Bnp Paribas Arbitrage, Sa | 6 082 | −31,46 | 66 | −40,00 | ||||
| 2025-08-28 | NP | IBB - iShares Nasdaq Biotechnology ETF | 500 796 | −12,48 | 5 454 | −23,63 | ||||
| 2025-08-14 | 13F | Cubist Systematic Strategies, LLC | 12 204 | −83,02 | 133 | −85,28 | ||||
| 2025-05-15 | 13F | Oaktree Capital Management Lp | 0 | −100,00 | 0 | |||||
| 2025-07-28 | 13F | BRYN MAWR TRUST Co | 858 | 0,00 | 9 | −10,00 | ||||
| 2025-08-07 | 13F | Allworth Financial LP | 145 | 2 | ||||||
| 2025-08-14 | 13F | Verition Fund Management LLC | 28 844 | 314 | ||||||
| 2025-08-19 | 13F | Marex Group plc | Put | 100 000 | 1 089 | |||||
| 2025-08-19 | 13F | Marex Group plc | 100 000 | 1 089 | ||||||
| 2025-05-14 | 13F | Jump Financial, LLC | 0 | −100,00 | 0 | |||||
| 2025-08-12 | 13F | LPL Financial LLC | Call | 10 000 | 0,00 | 109 | −12,90 | |||
| 2025-08-12 | 13F | LPL Financial LLC | 50 047 | 25,10 | 545 | 9,22 | ||||
| 2025-08-14 | 13F | Oasis Management Co Ltd. | 29 524 | −28,77 | 322 | −37,91 | ||||
| 2025-08-14 | 13F | Cantor Fitzgerald, L. P. | 10 147 | 111 | ||||||
| 2025-08-07 | 13F | Summit X, LLC | 199 295 | 0,57 | 2 170 | −12,25 | ||||
| 2025-08-13 | 13F | Tobias Financial Advisors, Inc. | 10 000 | 0,00 | 109 | −12,90 | ||||
| 2025-08-14 | 13F | Millennium Management Llc | 32 283 | 88,55 | 352 | 64,79 | ||||
| 2025-09-04 | 13F/A | Advisor Group Holdings, Inc. | 857 | −0,23 | 9 | −10,00 | ||||
| 2025-08-07 | 13F | Zurcher Kantonalbank (Zurich Cantonalbank) | 633 | 0,00 | 7 | −14,29 | ||||
| 2025-08-07 | 13F | Rathbone Brothers plc | 14 017 | 0,00 | 153 | −12,64 | ||||
| 2025-08-28 | 13F | China Universal Asset Management Co., Ltd. | 9 124 | 33,74 | 99 | 16,47 | ||||
| 2025-07-24 | NP | FNCMX - Fidelity Nasdaq Composite Index Fund This fund is a listed as child fund of Fmr Llc and if that institution has disclosed ownership in this security, then these positions will not be double counted when calculating total shares and total value | 18 245 | 0,00 | 194 | −37,82 | ||||
| 2025-08-14 | 13F | Jane Street Group, Llc | 0 | −100,00 | 0 | |||||
| 2025-08-13 | 13F | Quadrant Capital Group Llc | 0 | −100,00 | 0 | |||||
| 2025-05-05 | 13F | Lindbrook Capital, Llc | 2 253 | 3,73 | 28 | −34,88 | ||||
| 2025-08-14 | 13F | Banque Transatlantique SA | 0 | −100,00 | 0 | |||||
| 2025-05-08 | 13F | XTX Topco Ltd | 0 | −100,00 | 0 | |||||
| 2025-08-15 | 13F | Tower Research Capital LLC (TRC) | 648 | −80,55 | 7 | −82,93 | ||||
| 2025-08-08 | 13F | SBI Securities Co., Ltd. | 4 | 0,00 | 0 | |||||
| 2025-08-13 | 13F | Fi3 FINANCIAL ADVISORS, LLC | 36 625 | 0,00 | 399 | −12,91 | ||||
| 2025-07-15 | 13F | Ballentine Partners, LLC | 11 414 | 124 | ||||||
| 2025-05-08 | NP | QGBLX - Quantified Global Fund Investor Class | 4 578 | 224,91 | 57 | 111,11 | ||||
| 2025-08-14 | 13F | Jane Street Group, Llc | Call | 137 500 | 631,38 | 1 497 | 539,74 | |||
| 2025-07-24 | 13F | Us Bancorp \de\ | 410 | −62,32 | 4 | −69,23 | ||||
| 2025-08-08 | 13F | Geode Capital Management, Llc | 18 320 | 0,41 | 200 | −12,33 | ||||
| 2025-07-14 | 13F | Clayton Financial Group LLC | 0 | −100,00 | 0 | |||||
| 2025-08-11 | 13F | Citigroup Inc | 25 866 | 1,45 | 282 | −11,64 | ||||
| 2025-08-08 | 13F | Creative Planning | 12 964 | 141 | ||||||
| 2025-08-14 | 13F | UBS Group AG | 193 987 | 38,07 | 2 113 | 20,48 | ||||
| 2025-07-16 | 13F | Signaturefd, Llc | 7 123 | −25,19 | 78 | −34,75 | ||||
| 2025-08-12 | 13F | Jpmorgan Chase & Co | 1 819 | −16,71 | 20 | −29,63 | ||||
| 2025-07-21 | 13F | Mirae Asset Global Investments Co., Ltd. | 1 755 | 54,22 | 19 | 46,15 | ||||
| 2025-07-24 | 13F | Strengthening Families & Communities, LLC | 10 | 0 | ||||||
| 2025-08-12 | 13F | Rhumbline Advisers | 6 094 | 4,47 | 66 | −8,33 | ||||
| 2025-08-14 | 13F | Toronto Dominion Bank | 0 | −100,00 | 0 | |||||
| 2025-08-12 | 13F | BlackRock, Inc. | 656 834 | −8,13 | 7 153 | −19,84 | ||||
| 2025-07-28 | NP | IBBQ - Invesco Nasdaq Biotechnology ETF This fund is a listed as child fund of Invesco Ltd. and if that institution has disclosed ownership in this security, then these positions will not be double counted when calculating total shares and total value | 1 334 | 9,61 | 14 | −30,00 | ||||
| 2025-07-22 | 13F | Gf Fund Management Co. Ltd. | 817 | 0,00 | 9 | −20,00 | ||||
| 2025-08-14 | 13F | Two Sigma Investments, Lp | 33 213 | 362 | ||||||
| 2025-07-30 | NP | APIE - ActivePassive International Equity ETF | 4 190 | −50,60 | 45 | −69,66 | ||||
| 2025-07-21 | 13F | Sageworth Trust Co | 0 | −100,00 | 0 | |||||
| 2025-08-13 | 13F | Rsm Us Wealth Management Llc | 10 625 | 3,41 | 116 | −10,16 | ||||
| 2025-08-14 | 13F | XY Capital Ltd | 0 | −100,00 | 0 | |||||
| 2025-05-14 | 13F | Affinity Asset Advisors, LLC | Put | 0 | −100,00 | 0 | ||||
| 2025-05-14 | 13F | EntryPoint Capital, LLC | 0 | −100,00 | 0 | |||||
| 2025-08-14 | 13F | Wells Fargo & Company/mn | 25 335 | −4,91 | 276 | −17,17 | ||||
| 2025-05-15 | 13F | Oaktree Fund Advisors, LLC | 0 | −100,00 | 0 | |||||
| 2025-08-12 | 13F | MAI Capital Management | 223 | 2 | ||||||
| 2025-04-28 | 13F | Strategic Financial Concepts, LLC | 0 | −100,00 | 0 | −100,00 | ||||
| 2025-08-12 | 13F | Steward Partners Investment Advisory, Llc | 128 | 0,00 | 1 | 0,00 | ||||
| 2025-08-15 | 13F | Morgan Stanley | 504 391 | −7,38 | 5 493 | −19,19 | ||||
| 2025-07-08 | 13F | Parallel Advisors, LLC | 933 | 23,09 | 10 | 11,11 | ||||
| 2025-08-12 | 13F | Deutsche Bank Ag\ | 1 402 | 15 | ||||||
| 2025-08-14 | 13F | Point72 Asset Management, L.P. | 0 | −100,00 | 0 | |||||
| 2025-08-13 | 13F | Jones Financial Companies Lllp | 300 | 3 | ||||||
| 2025-07-28 | NP | BIB - ProShares Ultra Nasdaq Biotechnology | 1 251 | −9,54 | 13 | −43,48 | ||||
| 2025-08-12 | 13F | Proequities, Inc. | 0 | 0 | ||||||
| 2025-08-28 | NP | QCSTRX - Stock Account Class R1 | 693 498 | −13,11 | 754 | −23,68 | ||||
| 2025-08-05 | 13F | Simplex Trading, Llc | 10 673 | −33,57 | 0 | |||||
| 2025-07-28 | 13F/A | Penbrook Management LLC | 87 675 | 0,00 | 955 | −12,80 | ||||
| 2025-08-11 | 13F | Rockbridge Investment Management, LCC | 49 150 | 0,00 | 535 | −12,72 | ||||
| 2025-08-13 | 13F | Marshall Wace, Llp | 40 710 | −43,18 | 443 | −50,45 | ||||
| 2025-07-14 | 13F | Chapin Davis, Inc. | 15 000 | 0,00 | 163 | −12,83 | ||||
| 2025-08-14 | 13F/A | Barclays Plc | 3 571 | 39,66 | 0 | |||||
| 2025-07-14 | 13F | UMA Financial Services, Inc. | 57 | 1 | ||||||
| 2025-08-14 | 13F | Old Mission Capital Llc | 0 | −100,00 | 0 | |||||
| 2025-08-14 | 13F | Susquehanna International Group, Llp | Call | 158 000 | 62,55 | 1 721 | 41,80 | |||
| 2025-08-18 | 13F/A | National Bank Of Canada /fi/ | 525 | 0,00 | 6 | −16,67 | ||||
| 2025-07-17 | 13F | Lazari Capital Management, Inc. | 46 471 | 2,21 | 506 | −10,76 | ||||
| 2025-06-26 | NP | DFIEX - International Core Equity Portfolio - Institutional Class This fund is a listed as child fund of Dimensional Fund Advisors Lp and if that institution has disclosed ownership in this security, then these positions will not be double counted when calculating total shares and total value | 796 | 0,00 | 9 | −43,75 | ||||
| 2025-08-14 | 13F | Citadel Advisors Llc | Call | 141 350 | −6,36 | 1 539 | −18,27 | |||
| 2025-08-14 | 13F | Citadel Advisors Llc | 74 636 | −84,67 | 813 | −86,63 | ||||
| 2025-08-14 | 13F | Susquehanna International Group, Llp | Put | 113 600 | −52,82 | 1 237 | −58,84 | |||
| 2025-08-14 | 13F | Citadel Advisors Llc | Put | 63 400 | −23,34 | 690 | −33,14 | |||
| 2025-08-14 | 13F | Susquehanna International Group, Llp | 234 587 | −10,10 | 2 555 | −21,56 | ||||
| 2025-07-31 | 13F | Caitong International Asset Management Co., Ltd | 510 | 88,19 | 6 | 66,67 | ||||
| 2025-08-14 | 13F | Raymond James Financial Inc | 7 892 | 86 | ||||||
| 2025-08-14 | 13F | Daiwa Securities Group Inc. | 105 | 0,00 | 0 | |||||
| 2025-08-15 | 13F | WealthCollab, LLC | 73 | 1 | ||||||
| 2025-07-25 | 13F | JustInvest LLC | 13 331 | 26,97 | 145 | 10,69 | ||||
| 2025-08-14 | 13F | Aqr Capital Management Llc | 13 932 | 152 | ||||||
| 2025-08-05 | 13F | Advisors Preferred, LLC | 0 | −100,00 | 0 | |||||
| 2025-08-08 | 13F | Thoroughbred Financial Services, Llc | 0 | −100,00 | 0 | |||||
| 2025-08-13 | 13F | EverSource Wealth Advisors, LLC | 159 | −46,46 | 2 | −66,67 | ||||
| 2025-08-14 | 13F | Bank Of America Corp /de/ | 12 499 | −65,85 | 136 | −70,18 | ||||
| 2025-07-31 | 13F | R Squared Ltd | 11 571 | 126 | ||||||
| 2025-08-05 | 13F | Prosperity Wealth Management, Inc. | 50 100 | 2,87 | 546 | −10,21 | ||||
| 2025-07-14 | 13F | GAMMA Investing LLC | 6 838 | −0,20 | 74 | −12,94 | ||||
| 2025-08-14 | 13F | Goldman Sachs Group Inc | 415 465 | 61,57 | 4 524 | 40,98 | ||||
| 2025-08-14 | 13F | Royal Bank Of Canada | 85 674 | 756,74 | 933 | 646,40 | ||||
| 2025-07-15 | 13F | Compagnie Lombard Odier SCmA | 1 000 | 0,00 | 11 | −16,67 | ||||
| 2025-08-14 | 13F | Visionary Wealth Advisors | 10 901 | 0,00 | 119 | −13,24 | ||||
| 2025-08-27 | 13F/A | Squarepoint Ops LLC | 14 603 | −3,03 | 159 | −14,97 | ||||
| 2025-07-31 | 13F | Cambridge Investment Research Advisors, Inc. | 10 146 | −11,08 | 0 | |||||
| 2025-08-14 | 13F | Group One Trading, L.p. | 90 902 | −39,89 | 990 | −47,59 | ||||
| 2025-05-15 | 13F | Sio Capital Management, LLC | 0 | −100,00 | 0 | |||||
| 2025-07-15 | 13F | SJS Investment Consulting Inc. | 0 | −100,00 | 0 |
Other Listings
| DE:LWB1 |