Grunnleggende statistikk
| Institusjonelle eiere | 183 total, 183 long only, 0 short only, 0 long/short - change of −1,60% MRQ |
| Gjennomsnittlig porteføljeallokering | 0.2607 % - change of 33,36% MRQ |
| Institusjonelle aksjer (Long) | 50 185 193 (ex 13D/G) - change of 2,50MM shares 5,24% MRQ |
| Institusjonell verdi (Long) | $ 243 183 USD ($1000) |
Institusjonelt eierskap og aksjonærer
Nuveen Credit Strategies Income Fund (US:JQC) har 183 institusjonelle eiere og aksjonærer som har sendt inn 13D/G- eller 13F-skjemaer til Securities Exchange Commission (SEC). Disse institusjonene eier til sammen 50,185,193 aksjer. De største aksjonærene inkluderer Morgan Stanley, Oak Hill Advisors Lp, Guggenheim Capital Llc, Invesco Ltd., Sit Investment Associates Inc, Wells Fargo & Company/mn, Absolute Investment Advisers Llc, PCEF - Invesco CEF Income Composite ETF, Pathstone Holdings, LLC, and Raymond James Financial Inc .
Nuveen Credit Strategies Income Fund (NYSE:JQC) institusjonell eierstruktur viser nåværende posisjoner i selskapet fordelt på institusjoner og fond, samt de siste endringene i posisjonsstørrelse. De største aksjonærene kan være individuelle investorer, verdipapirfond, hedgefond eller institusjoner. Schedule 13D indikerer at investoren eier (eller har eid) mer enn 5 % av selskapet og har til hensikt (eller hadde til hensikt) å aktivt forfølge en endring i forretningsstrategien. Schedule 13G indikerer en passiv investering på over 5 %.
The share price as of September 10, 2025 is 5,50 / share. Previously, on September 11, 2024, the share price was 5,91 / share. This represents a decline of 6,94% over that period.

Fondssentiment-score
Fondssentiment Score (også kjent som akkumulering av eierskap poengsum) viser hvilke aksjer som er mest kjøpt av fond. Den er resultatet av en sofistikert, kvantitativ flerfaktormodell som identifiserer selskaper med de høyeste nivåene av institusjonell akkumulering. Beregningsmodellen for poeng bruker en kombinasjon av den totale økningen i antall offentliggjorte eiere, endringer i porteføljeallokeringen til disse eierne og andre beregninger. Tallet går fra 0 til 100, der høyere tall indikerer en høyere grad av akkumulering i forhold til sammenlignbare selskaper, der 50 er gjennomsnittet.
Oppdateringsfrekvens: Daglig
Sjekk ut Ownership Explorer, som inneholder en liste over de høyest rangerte selskapene.
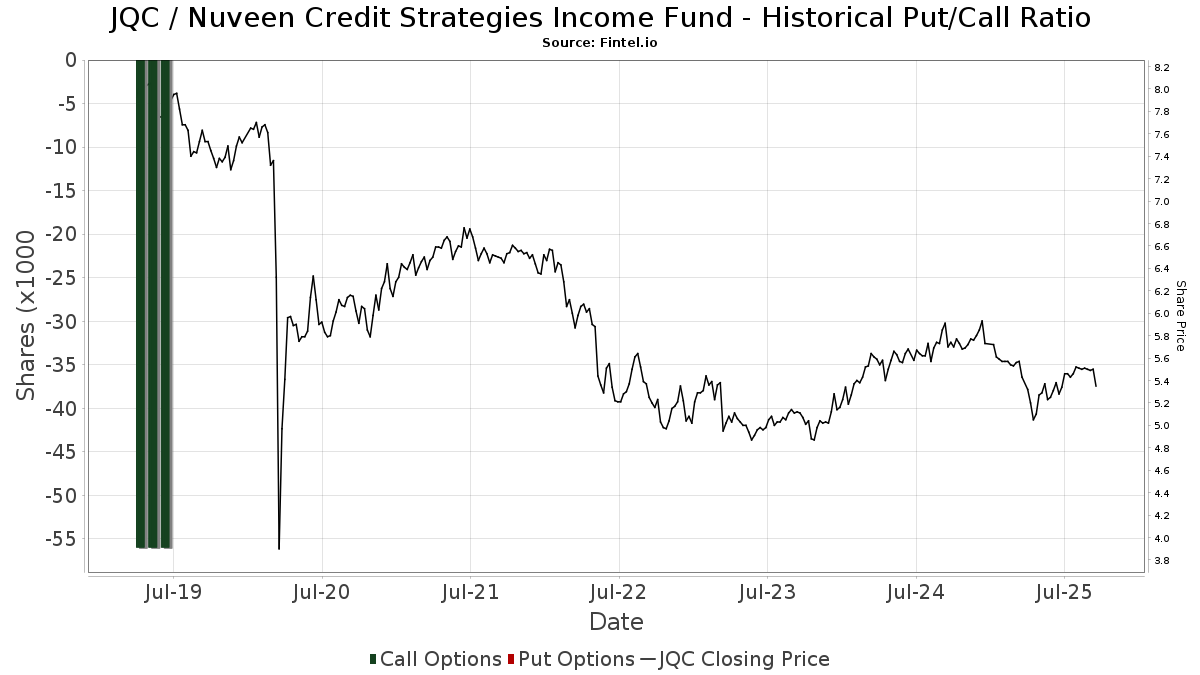
Institusjonell Put/Call-forhold
I tillegg til å rapportere standard aksje- og gjeldsemisjoner må institusjoner med mer enn 100 millioner kroner i forvaltningskapital også oppgi beholdningen av put- og callopsjoner. Siden put-opsjoner generelt indikerer et negativt sentiment, og call-opsjoner indikerer et positivt sentiment, kan vi få et inntrykk av det generelle institusjonelle sentimentet ved å plotte forholdet mellom put- og call-opsjoner. Diagrammet til høyre viser det historiske forholdet mellom put- og call-opsjoner for dette instrumentet.
Ved å bruke Put/Call-forholdet som en indikator på investorsentimentet kan man overvinne en av de viktigste svakhetene ved å bruke totalt institusjonelt eierskap, nemlig at en betydelig andel av forvaltningskapitalen investeres passivt for å følge indekser. Passivt forvaltede fond kjøper vanligvis ikke opsjoner, slik at indikatoren for put/call-forhold i større grad gjenspeiler stemningen i aktivt forvaltede fond.
13D/G-arkiveringer
Vi presenterer 13D/G-arkiveringene separat fra 13F-arkiveringene fordi de behandles forskjellig av SEC. 13D/G-arkiveringene kan sendes inn av grupper av investorer (med én leder), mens 13D/G-arkiveringene ikke kan sendes inn. Dette fører til situasjoner der en investor kan sende inn en 13D/G-rapport med én verdi for alle aksjene (som representerer alle aksjene som eies av investorgruppen), men deretter sende inn en 13F-melding med en annen verdi for alle aksjene (som kun representerer deres eget eierskap). Dette betyr at aksjeeierskap i 13D/G-arkiveringene og 13F-arkiveringene ofte ikke er direkte sammenlignbare, og vi presenterer dem derfor separat.
Merk: Fra og med 16. mai 2021 viser vi ikke lenger eiere som ikke har sendt inn en 13D/G i løpet av det siste året. Tidligere viste vi hele historikken for 13D/G-arkiveringer. Generelt må enheter som er pålagt å sende inn 13D/G-arkiveringer, sende inn minst én gang i året før de sender inn en avsluttende rapport. Det hender imidlertid at fond trekker seg ut av posisjoner uten å sende inn en avsluttende innlevering (dvs. at de avvikler), slik at visning av hele historikken av og til fører til forvirring om det nåværende eierskapet. For å unngå forvirring viser vi nå bare "nåværende" eiere, det vil si eiere som har sendt inn informasjon i løpet av det siste året.
Upgrade to unlock premium data.
| Fildato | Skjema | Investor | Tidligere aksjer |
Siste aksjer |
Δ Aksjer (prosent) |
Eierandel (prosent) |
Δ Eierandel (prosent) |
|
|---|---|---|---|---|---|---|---|---|
| 2024-11-08 | MORGAN STANLEY | 8,064,766 | 5,953,390 | -26.18 | 4.40 | -25.42 |
13F- og NPORT-arkiveringer
Detaljer om 13F-arkiveringer er gratis. Detaljer om NP-arkiveringer krever et premium-medlemskap. Grønne rader indikerer nye posisjoner. Røde rader indikerer lukkede posisjoner. Klikk på lenke ikonet for å se hele transaksjonshistorikken.
Oppgrader
for å låse opp premiedata og eksportere til Excel. ![]() .
.
| Fildato | Kilde | Investor | Type | Gjennomsnittlig pris (estimert) |
Aksjer | Δ Aksjer (%) |
Rapportert verdi ($1000) | Verdi (%) | Portallokering (%) | |
|---|---|---|---|---|---|---|---|---|---|---|
| 2025-07-29 | 13F | International Assets Investment Management, Llc | 82 452 | 0,00 | 444 | 0,23 | ||||
| 2025-08-13 | 13F | Invesco Ltd. | 2 529 455 | 9,70 | 13 634 | 9,90 | ||||
| 2025-08-12 | 13F | DCF Advisers, LLC | 371 713 | 14,47 | 2 004 | 14,72 | ||||
| 2025-07-14 | 13F | Sowell Financial Services LLC | 373 043 | −6,82 | 2 011 | −6,64 | ||||
| 2025-07-23 | 13F | Tcfg Wealth Management, Llc | 19 093 | 0,00 | 103 | 0,00 | ||||
| 2025-08-14 | 13F | Polar Asset Management Partners Inc. | 1 495 667 | 70,10 | 8 062 | 70,42 | ||||
| 2025-08-14 | 13F | Royal Bank Of Canada | 232 347 | −12,69 | 1 253 | −12,50 | ||||
| 2025-08-14 | 13F | GWM Advisors LLC | 74 608 | 39,43 | 402 | 40,07 | ||||
| 2025-08-27 | NP | THRIVENT SERIES FUND INC - Thrivent Balanced Income Plus Portfolio Class A | 12 530 | 0,00 | 68 | 0,00 | ||||
| 2025-07-24 | 13F | IFP Advisors, Inc | 1 262 | 0,00 | 7 | 0,00 | ||||
| 2025-07-10 | 13F | Atticus Wealth Management, Llc | 1 799 | 0,00 | 10 | 0,00 | ||||
| 2025-08-27 | NP | ACEFX - Absolute Strategies Fund Institutional Shares | 62 100 | 124 100,00 | 335 | |||||
| 2025-07-21 | 13F | Hilltop National Bank | 700 | 40,00 | 4 | 50,00 | ||||
| 2025-08-12 | 13F | Advisors Asset Management, Inc. | 1 289 447 | 11,88 | 6 950 | 12,10 | ||||
| 2025-07-17 | 13F | Sound Income Strategies, LLC | 4 365 | 3,12 | 24 | 4,55 | ||||
| 2025-08-15 | 13F | Provenance Wealth Advisors, LLC | 0 | −100,00 | 0 | −100,00 | ||||
| 2025-08-12 | 13F | Global Retirement Partners, LLC | 0 | −100,00 | 0 | |||||
| 2025-07-17 | 13F | Venture Visionary Partners LLC | 483 595 | 0,00 | 2 607 | 0,19 | ||||
| 2025-08-06 | 13F | Disciplined Investors, L.L.C. | 13 329 | −18,73 | 72 | −19,32 | ||||
| 2025-07-14 | 13F | Occidental Asset Management, LLC | 13 477 | −0,44 | 73 | 0,00 | ||||
| 2025-07-24 | 13F | Accredited Investor Services, Llc | 30 496 | 17,79 | 164 | 17,99 | ||||
| 2025-08-15 | 13F | First Heartland Consultants, Inc. | 31 012 | 0,00 | 167 | 0,60 | ||||
| 2025-07-16 | 13F | Castleview Partners, Llc | 216 087 | 1 165 | ||||||
| 2025-08-14 | 13F | Bank Of America Corp /de/ | 298 997 | −81,85 | 1 612 | −81,82 | ||||
| 2025-08-14 | 13F | Mariner, LLC | 77 016 | −15,31 | 415 | −15,13 | ||||
| 2025-08-13 | 13F | Level Four Advisory Services, Llc | 29 256 | 0,78 | 158 | 0,64 | ||||
| 2025-08-13 | 13F | Cary Street Partners Financial Llc | 25 965 | 140 | ||||||
| 2025-08-14 | 13F | UBS Group AG | 259 922 | 79,38 | 1 401 | 79,72 | ||||
| 2025-07-11 | 13F | Seacrest Wealth Management, Llc | 40 498 | −0,52 | 218 | −0,46 | ||||
| 2025-08-08 | 13F | Fiera Capital Corp | 185 336 | −0,89 | 999 | −0,80 | ||||
| 2025-08-15 | 13F | Kestra Advisory Services, LLC | 67 933 | 10,87 | 366 | 11,25 | ||||
| 2025-08-15 | 13F | Captrust Financial Advisors | 65 559 | 264,22 | 353 | 267,71 | ||||
| 2025-08-08 | 13F | Creative Planning | 0 | −100,00 | 0 | |||||
| 2025-08-13 | 13F | StoneX Group Inc. | 18 492 | −37,49 | 100 | −37,74 | ||||
| 2025-07-15 | 13F | Absolute Investment Advisers Llc | 1 847 341 | 9 957 | ||||||
| 2025-05-30 | NP | Rivernorth Opportunities Fund, Inc. | 100 | −99,96 | 1 | −100,00 | ||||
| 2025-08-12 | 13F | Steward Partners Investment Advisory, Llc | 248 766 | 96,94 | 1 341 | 97,35 | ||||
| 2025-08-14 | 13F | Quarry LP | 749 998 | 85,54 | 4 042 | 85,92 | ||||
| 2025-05-06 | 13F | AE Wealth Management LLC | 0 | −100,00 | 0 | −100,00 | ||||
| 2025-08-12 | 13F | Proequities, Inc. | 0 | 0 | ||||||
| 2025-08-13 | 13F | Cresset Asset Management, LLC | 0 | −100,00 | 0 | |||||
| 2025-07-10 | 13F | Stolper Co | 238 694 | 10,71 | 1 | 0,00 | ||||
| 2025-07-09 | 13F | VisionPoint Advisory Group, LLC | 27 082 | 146 | ||||||
| 2025-08-01 | 13F | Envestnet Asset Management Inc | 84 126 | −1,58 | 453 | −1,31 | ||||
| 2025-08-28 | NP | YYY - Amplify High Income ETF | 938 691 | 2,58 | 5 060 | 2,78 | ||||
| 2025-07-25 | 13F | We Are One Seven, LLC | 0 | −100,00 | 0 | |||||
| 2025-08-14 | 13F | Jane Street Group, Llc | 92 965 | 269,61 | 501 | 271,11 | ||||
| 2025-08-27 | NP | THRIVENT SERIES FUND INC - Thrivent Opportunity Income Plus Portfolio Class A | 25 612 | 0,00 | 138 | 0,73 | ||||
| 2025-07-15 | 13F | Retirement Income Solutions, Inc | 0 | −100,00 | 0 | |||||
| 2025-08-12 | 13F | Pathstone Holdings, LLC | 1 631 883 | 2 002,35 | 8 796 | 1 858,80 | ||||
| 2025-07-08 | 13F | Nbc Securities, Inc. | 251 166 | 15,15 | 1 | 0,00 | ||||
| 2025-08-14 | 13F | Robinson Capital Management, Llc | 120 650 | 650 | ||||||
| 2025-07-31 | 13F | Cambridge Investment Research Advisors, Inc. | 17 787 | −76,66 | 0 | |||||
| 2025-08-12 | 13F | LPL Financial LLC | 794 908 | 35,41 | 4 285 | 35,66 | ||||
| 2025-08-08 | 13F | Hartland & Co., LLC | 24 290 | 64,85 | 131 | 64,56 | ||||
| 2025-08-13 | 13F | Lido Advisors, LLC | 198 167 | 7,14 | 1 079 | 7,26 | ||||
| 2025-07-30 | 13F | Forum Financial Management, LP | 15 000 | 0,00 | 81 | 0,00 | ||||
| 2025-08-27 | NP | THRIVENT SERIES FUND INC - Thrivent Diversified Income Plus Portfolio Class A | 31 444 | 0,00 | 169 | 0,00 | ||||
| 2025-05-14 | 13F | Huntington National Bank | 10 | |||||||
| 2025-08-14 | 13F | Sunbelt Securities, Inc. | 2 710 | 8,40 | 15 | 15,38 | ||||
| 2025-07-28 | NP | PCEF - Invesco CEF Income Composite ETF This fund is a listed as child fund of Invesco Ltd. and if that institution has disclosed ownership in this security, then these positions will not be double counted when calculating total shares and total value | 1 717 513 | 30,35 | 8 983 | 22,84 | ||||
| 2025-08-27 | NP | RYDEX VARIABLE TRUST - Multi-Hedge Strategies Fund Variable Annuity | 591 | 278,85 | 3 | |||||
| 2025-06-27 | NP | Calamos ETF Trust - Calamos CEF Income & Arbitrage ETF | 120 972 | 7,69 | 638 | 1,59 | ||||
| 2025-07-14 | 13F | Maryland Capital Advisors Inc. | 5 000 | 27 | ||||||
| 2025-08-05 | 13F | Fullcircle Wealth Llc | 104 188 | 37,87 | 573 | 48,06 | ||||
| 2025-08-14 | 13F | Smartleaf Asset Management LLC | 401 | 0,00 | 2 | 0,00 | ||||
| 2025-07-25 | 13F | Apollon Wealth Management, LLC | 32 140 | 190,60 | 173 | 193,22 | ||||
| 2025-07-31 | 13F | Anchor Capital Management Group Inc | 175 000 | 0,00 | 943 | 0,21 | ||||
| 2025-08-13 | 13F | First Trust Advisors Lp | 375 696 | −9,74 | 2 025 | −9,56 | ||||
| 2025-05-30 | NP | RNDLX - RiverNorth/DoubleLine Strategic Income Fund Class R | 100 | −99,88 | 1 | −100,00 | ||||
| 2025-08-12 | 13F | Deutsche Bank Ag\ | 63 386 | −70,39 | 342 | −70,37 | ||||
| 2025-05-30 | NP | RNOTX - RiverNorth/Oaktree High Income Fund Class R | 100 | −99,87 | 1 | −100,00 | ||||
| 2025-08-15 | 13F | Prevail Innovative Wealth Advisors, Llc | 354 680 | 35,45 | 1 912 | 35,72 | ||||
| 2025-08-06 | 13F | Commonwealth Equity Services, Llc | 83 123 | 9,28 | 0 | |||||
| 2025-07-21 | 13F | Future Financial Wealth Managment LLC | 91 476 | 493 | ||||||
| 2025-07-08 | 13F | Allen Mooney & Barnes Investment Advisors LLC | 14 601 | 0,00 | 79 | 0,00 | ||||
| 2025-08-14 | 13F | First Foundation Advisors | 12 000 | 0,00 | 65 | 0,00 | ||||
| 2025-08-12 | 13F | Gladstone Institutional Advisory LLC | 56 474 | 0,00 | 304 | 0,33 | ||||
| 2025-08-08 | 13F | Meridian Wealth Management, LLC | 57 762 | 1,49 | 311 | 1,63 | ||||
| 2025-08-14 | 13F | EP Wealth Advisors, Inc. | 18 860 | −21,09 | 102 | −21,09 | ||||
| 2025-08-13 | 13F | Virtus Investment Advisers, Inc. | 163 884 | −19,09 | 883 | −18,92 | ||||
| 2025-08-14 | 13F | Ausdal Financial Partners, Inc. | 161 713 | −0,08 | 872 | 0,11 | ||||
| 2025-07-10 | 13F | Wealth Enhancement Advisory Services, Llc | 27 897 | −1,43 | 153 | 0,00 | ||||
| 2025-08-06 | 13F | North Capital, Inc. | 0 | −100,00 | 0 | |||||
| 2025-07-21 | 13F | Ameritas Advisory Services, LLC | 10 325 | −4,62 | 56 | −9,84 | ||||
| 2025-08-07 | 13F | Hennion & Walsh Asset Management, Inc. | 85 296 | −0,12 | 460 | 0,00 | ||||
| 2025-08-11 | 13F | HHM Wealth Advisors, LLC | 0 | −100,00 | 0 | |||||
| 2025-07-10 | 13F | Oliver Lagore Vanvalin Investment Group | 933 | 0,00 | 5 | 0,00 | ||||
| 2025-07-21 | 13F | First National Bank & Trust Co Of Newtown | 114 520 | −0,06 | 617 | 0,16 | ||||
| 2025-08-13 | 13F | Rsm Us Wealth Management Llc | 67 313 | 16,78 | 366 | 16,93 | ||||
| 2025-08-15 | 13F | Tower Research Capital LLC (TRC) | 0 | −100,00 | 0 | |||||
| 2025-07-24 | NP | DFRAX - DWS Floating Rate Fund Class A | 63 386 | −70,39 | 332 | −72,14 | ||||
| 2025-09-09 | 13F | NWF Advisory Services Inc. | 49 800 | 0,00 | 268 | 0,37 | ||||
| 2025-08-13 | 13F | Icon Advisers Inc/co | 64 776 | 349 | ||||||
| 2025-08-06 | 13F | Tabor Asset Management, LP | 0 | −100,00 | 0 | −100,00 | ||||
| 2025-08-05 | 13F | GHP Investment Advisors, Inc. | 550 | 0,00 | 3 | 0,00 | ||||
| 2025-08-14 | 13F | Bramshill Investments, LLC | 150 459 | 19,80 | 811 | 20,00 | ||||
| 2025-08-18 | 13F | Geneos Wealth Management Inc. | 34 629 | −1,85 | 187 | −1,59 | ||||
| 2025-07-15 | 13F | DKM Wealth Management, Inc. | 15 000 | 0,00 | 81 | 0,00 | ||||
| 2025-08-08 | 13F | Avantax Advisory Services, Inc. | 75 180 | 79,44 | 405 | 80,00 | ||||
| 2025-08-26 | 13F/A | Thrivent Financial For Lutherans | 391 087 | −50,00 | 2 | −50,00 | ||||
| 2025-04-23 | 13F | Navis Wealth Advisors, LLC | 0 | −100,00 | 0 | |||||
| 2025-08-11 | 13F | Elequin Capital Lp | 0 | −100,00 | 0 | |||||
| 2025-08-11 | 13F | Keyes, Stange & Wooten Wealth Management, LLC | 26 820 | 2,44 | 145 | 2,86 | ||||
| 2025-07-31 | 13F | Oppenheimer & Co Inc | 10 147 | −12,67 | 55 | −12,90 | ||||
| 2025-08-13 | 13F | Fiduciary Group LLC | 12 950 | 0,00 | 70 | 0,00 | ||||
| 2025-08-19 | 13F | National Asset Management, Inc. | 35 771 | −1,84 | 193 | −7,25 | ||||
| 2025-08-14 | 13F | Garden State Investment Advisory Services LLC | 12 773 | 0,48 | 69 | 0,00 | ||||
| 2025-08-08 | 13F | City Of London Investment Management Co Ltd | 635 847 | 238,70 | 3 427 | 239,64 | ||||
| 2025-07-28 | 13F | Harbour Investments, Inc. | 44 624 | 54,49 | 241 | 54,84 | ||||
| 2025-07-29 | 13F | Private Trust Co Na | 9 000 | 0,00 | 49 | 0,00 | ||||
| 2025-08-14 | 13F | Boston Private Wealth Llc | 0 | −100,00 | 0 | |||||
| 2025-06-26 | NP | ATCAX - Anchor Risk Managed Credit Strategies Fund Advisor Class Shares | 175 000 | 0,00 | 915 | −5,77 | ||||
| 2025-08-14 | 13F | Wells Fargo & Company/mn | 1 912 762 | 1,42 | 10 310 | 1,61 | ||||
| 2025-05-14 | 13F | Virtus ETF Advisers LLC | 0 | −100,00 | 0 | |||||
| 2025-07-17 | 13F | Halbert Hargrove Global Advisors, Llc | 3 000 | 0,00 | 16 | 0,00 | ||||
| 2025-06-26 | NP | AABFX - Thrivent Balanced Income Plus Fund Class A | 12 898 | 0,00 | 68 | −6,94 | ||||
| 2025-08-07 | 13F | Allworth Financial LP | 15 250 | 82 | ||||||
| 2025-08-07 | 13F | Encompass More Asset Management | 125 476 | 0,80 | 676 | 1,05 | ||||
| 2025-08-11 | 13F | HighTower Advisors, LLC | 10 414 | 56 | ||||||
| 2025-08-13 | 13F | Walleye Capital LLC | 0 | −100,00 | 0 | |||||
| 2025-08-28 | NP | RNCOX - RiverNorth Core Opportunity Fund Class R | 81 830 | 81 730,00 | 441 | |||||
| 2025-08-12 | 13F | CIBC Private Wealth Group, LLC | 8 061 | 0,99 | 43 | 10,26 | ||||
| 2025-08-05 | 13F | Shaker Financial Services, LLC | 24 452 | 135 | ||||||
| 2025-08-14 | 13F | CoreCap Advisors, LLC | 17 115 | 0,00 | 92 | 0,00 | ||||
| 2025-08-27 | NP | RYMSX - Guggenheim Multi-Hedge Strategies Fund Class P | 351 | 194,96 | 2 | |||||
| 2025-08-06 | 13F | Penserra Capital Management LLC | 948 351 | 3,64 | 5 | 25,00 | ||||
| 2025-05-30 | NP | Rivernorth/doubleline Strategic Opportunity Fund, Inc. | 100 | −99,97 | 1 | −100,00 | ||||
| 2025-08-14 | 13F | Alpine Global Management, LLC | 0 | −100,00 | 0 | |||||
| 2025-08-14 | 13F | Comerica Bank | 29 246 | −62,66 | 158 | −62,71 | ||||
| 2025-08-27 | NP | AAHYX - Thrivent Diversified Income Plus Fund Class A | 50 149 | 0,00 | 270 | 0,37 | ||||
| 2025-07-24 | 13F | Us Bancorp \de\ | 4 492 | 0,00 | 24 | 0,00 | ||||
| 2025-08-07 | 13F | Readystate Asset Management Lp | 291 903 | 1 573 | ||||||
| 2025-06-26 | NP | AAINX - Thrivent Opportunity Income Plus Fund Class A | 102 539 | 0,00 | 540 | −5,76 | ||||
| 2025-04-22 | 13F | Synergy Financial Management, LLC | 0 | −100,00 | 0 | |||||
| 2025-08-08 | 13F | Calamos Advisors LLC | 120 972 | 12,00 | 652 | 12,22 | ||||
| 2025-08-01 | 13F | Ashton Thomas Private Wealth, LLC | 19 721 | 51,21 | 107 | 52,86 | ||||
| 2025-07-31 | 13F | Glass Jacobson Investment Advisors llc | 0 | −100,00 | 0 | |||||
| 2025-08-04 | 13F | Kovack Advisors, Inc. | 56 940 | 89,80 | 307 | 90,06 | ||||
| 2025-07-15 | 13F | Financial Management Professionals, Inc. | 846 | 20,00 | 5 | 33,33 | ||||
| 2025-08-11 | 13F | WPG Advisers, LLC | 6 151 | −22,25 | 33 | −21,43 | ||||
| 2025-07-29 | 13F | Koshinski Asset Management, Inc. | 130 257 | −2,25 | 702 | −1,96 | ||||
| 2025-04-21 | 13F | ORG Partners LLC | 0 | −100,00 | 0 | |||||
| 2025-07-11 | 13F | Annex Advisory Services, LLC | 16 725 | 0,00 | 90 | 1,12 | ||||
| 2025-05-14 | 13F | Van Hulzen Asset Management, LLC | 0 | −100,00 | 0 | −100,00 | ||||
| 2025-08-14 | 13F | Sit Investment Associates Inc | 2 225 536 | 487,58 | 12 | 450,00 | ||||
| 2025-07-25 | 13F | Cwm, Llc | 5 041 | 0,00 | 0 | |||||
| 2025-05-08 | 13F | Private Advisory Group LLC | 0 | −100,00 | 0 | −100,00 | ||||
| 2025-07-10 | 13F | Sovran Advisors, LLC | 214 914 | −44,28 | 1 173 | −39,29 | ||||
| 2025-08-14 | 13F | Raymond James Financial Inc | 1 532 147 | −4,91 | 8 258 | −4,73 | ||||
| 2025-08-15 | 13F | Morgan Stanley | 10 640 087 | 8,66 | 57 350 | 8,87 | ||||
| 2025-06-30 | NP | CVY - Invesco Zacks Multi-Asset Income ETF This fund is a listed as child fund of Invesco Ltd. and if that institution has disclosed ownership in this security, then these positions will not be double counted when calculating total shares and total value | 130 300 | −3,40 | 687 | −8,90 | ||||
| 2025-08-05 | 13F | Tsfg, Llc | 3 000 | 0,00 | 0 | |||||
| 2025-08-13 | 13F | Beacon Pointe Advisors, LLC | 51 758 | 1,92 | 279 | 1,83 | ||||
| 2025-08-14 | 13F | Cohen & Steers, Inc. | 734 738 | 0,00 | 4 | 0,00 | ||||
| 2025-08-14 | 13F | Susquehanna International Group, Llp | 81 153 | 437 | ||||||
| 2025-07-07 | 13F | Centurion Wealth Management LLC | 66 465 | −2,06 | 358 | −7,25 | ||||
| 2025-08-12 | 13F | Coldstream Capital Management Inc | 0 | −100,00 | 0 | |||||
| 2025-08-08 | 13F | Family Firm, Inc. | 124 051 | 2,86 | 669 | 3,09 | ||||
| 2025-08-05 | 13F | Kesler, Norman & Wride, LLC | 11 151 | −1,02 | 60 | 0,00 | ||||
| 2025-08-15 | 13F | Equitable Holdings, Inc. | 0 | −100,00 | 0 | |||||
| 2025-08-14 | 13F | Ameriprise Financial Inc | 552 310 | 20,37 | 2 977 | 20,58 | ||||
| 2025-08-08 | 13F/A | Ignite Planners, LLC | 17 891 | 28,68 | 98 | 32,43 | ||||
| 2025-08-13 | 13F | Summit Financial, LLC | 56 897 | 310 | ||||||
| 2025-08-08 | 13F | Cetera Investment Advisers | 360 249 | −9,05 | 1 942 | −8,92 | ||||
| 2025-08-14 | 13F | Cable Car Capital LLC | 0 | −100,00 | 0 | |||||
| 2025-07-30 | NP | HYIN - WisdomTree Alternative Income Fund N/A | 407 112 | 46,47 | 2 129 | 38,07 | ||||
| 2025-05-08 | 13F | Plante Moran Financial Advisors, LLC | 0 | −100,00 | 0 | |||||
| 2025-08-12 | 13F | Virtu Financial LLC | 21 661 | 78,21 | 0 | |||||
| 2025-07-16 | 13F | PFS Partners, LLC | 1 000 | 5 | ||||||
| 2025-08-12 | 13F | J.w. Cole Advisors, Inc. | 211 630 | 10,18 | 1 141 | 10,36 | ||||
| 2025-08-08 | 13F | Pnc Financial Services Group, Inc. | 16 200 | 0,00 | 87 | 0,00 | ||||
| 2025-08-04 | 13F | Assetmark, Inc | 41 | −92,26 | 0 | −100,00 | ||||
| 2025-08-14 | 13F | Oak Hill Advisors Lp | 3 301 932 | −50,35 | 17 797 | −0,51 | ||||
| 2025-08-04 | 13F | Integrity Alliance, Llc. | 0 | −100,00 | 0 | |||||
| 2025-07-23 | 13F | Sax Wealth Advisors, Llc | 12 374 | 0,00 | 67 | 0,00 | ||||
| 2025-07-25 | NP | FCEF - First Trust CEF Income Opportunity ETF This fund is a listed as child fund of First Trust Advisors Lp and if that institution has disclosed ownership in this security, then these positions will not be double counted when calculating total shares and total value | 144 026 | −26,36 | 753 | −30,60 | ||||
| 2025-08-14 | 13F | Millennium Management Llc | 48 686 | 262 | ||||||
| 2025-08-12 | 13F | Landscape Capital Management, L.l.c. | 291 952 | −11,23 | 1 574 | −11,08 | ||||
| 2025-08-20 | NP | LSPAX - LoCorr Spectrum Income Fund Class A | 137 766 | 20,00 | 743 | 20,26 | ||||
| 2025-06-25 | NP | VPC - Virtus Private Credit Strategy ETF | 225 536 | 41,95 | 1 189 | 33,78 | ||||
| 2025-08-11 | 13F | Private Advisor Group, LLC | 0 | −100,00 | 0 | |||||
| 2025-09-04 | 13F/A | Advisor Group Holdings, Inc. | 129 605 | 9,81 | 699 | 9,92 | ||||
| 2025-07-16 | 13F | Formidable Asset Management, LLC | 18 300 | 0,00 | 98 | 0,00 | ||||
| 2025-08-13 | 13F | Thomas J. Herzfeld Advisors, Inc. | 676 389 | 3 646 | ||||||
| 2025-05-15 | 13F | Ancora Advisors, LLC | 0 | −100,00 | 0 | |||||
| 2025-08-12 | 13F | SRS Capital Advisors, Inc. | 235 | 1 | ||||||
| 2025-08-18 | 13F | Hollencrest Capital Management | 19 780 | 0,00 | 107 | 0,00 | ||||
| 2025-08-15 | 13F | CI Private Wealth, LLC | 45 378 | −11,87 | 245 | −11,91 | ||||
| 2025-07-17 | 13F | Wolff Wiese Magana Llc | 350 | 0,00 | 2 | 0,00 | ||||
| 2025-08-13 | 13F | Townsquare Capital Llc | 0 | −100,00 | 0 | |||||
| 2025-07-15 | 13F | Main Street Group, LTD | 500 | 0,00 | 3 | 0,00 | ||||
| 2025-08-14 | 13F | Boothbay Fund Management, Llc | 0 | −100,00 | 0 | |||||
| 2025-08-14 | 13F | Almitas Capital LLC | 63 388 | 342 | ||||||
| 2025-08-14 | 13F | Mml Investors Services, Llc | 23 400 | 0,33 | 0 | |||||
| 2025-07-15 | 13F | SJS Investment Consulting Inc. | 330 | 0,00 | 2 | 0,00 | ||||
| 2025-04-15 | 13F | Noble Wealth Management PBC | 2 000 | 11 | ||||||
| 2025-05-07 | 13F | Sheaff Brock Investment Advisors, LLC | 12 650 | 0,00 | 68 | −4,23 | ||||
| 2025-07-11 | 13F | Quad-Cities Investment Group, LLC | 23 262 | −30,70 | 125 | −30,56 | ||||
| 2025-05-09 | 13F | Cornerstone Advisors, LLC | 0 | −100,00 | 0 | −100,00 | ||||
| 2025-07-11 | 13F | Farther Finance Advisors, LLC | 8 902 | 138,28 | 48 | 147,37 | ||||
| 2025-08-11 | 13F | SFI Advisors, LLC | 0 | −100,00 | 0 | |||||
| 2025-07-14 | 13F | Park Avenue Securities Llc | 36 748 | −4,34 | 0 | |||||
| 2025-08-25 | NP | IOBAX - ICON FLEXIBLE BOND FUND Investor Class | 64 776 | 349 | ||||||
| 2025-04-24 | 13F | Total Wealth Planning & Management, Inc. | 0 | −100,00 | 0 | |||||
| 2025-08-13 | 13F | Guggenheim Capital Llc | 2 815 113 | 12,87 | 15 173 | 13,08 | ||||
| 2025-07-25 | 13F | Concurrent Investment Advisors, LLC | 21 394 | 0,00 | 115 | 0,00 | ||||
| 2025-08-01 | 13F | Alexander Labrunerie & Co., Inc. | 47 903 | 32,37 | 258 | 32,99 | ||||
| 2025-09-10 | 13F | WT Wealth Management | 15 488 | 0,00 | 83 | 0,00 | ||||
| 2025-08-13 | 13F | Smith, Moore & Co. | 13 155 | 6,05 | 71 | 6,06 | ||||
| 2025-08-12 | 13F | Bokf, Na | 0 | −100,00 | 0 | |||||
| 2025-08-27 | NP | RBNAX - Robinson Opportunistic Income Fund Class A Shares | 120 000 | 647 | ||||||
| 2025-08-14 | 13F | Stifel Financial Corp | 340 699 | 1,79 | 1 836 | 2,00 | ||||
| 2025-07-15 | 13F | BKA Wealth Consulting, Inc. | 145 963 | −29,50 | 787 | −29,38 | ||||
| 2025-07-30 | 13F | FNY Investment Advisers, LLC | 1 800 | 0,00 | 0 | |||||
| 2025-07-22 | 13F | Merit Financial Group, LLC | 46 963 | 95,03 | 253 | 96,12 | ||||
| 2025-08-06 | 13F | Wedbush Securities Inc | 55 101 | 1,97 | 0 | |||||
| 2025-08-18 | 13F/A | National Bank Of Canada /fi/ | 2 230 | −40,21 | 12 | −40,00 | ||||
| 2025-08-13 | 13F | Yakira Capital Management, Inc. | 253 121 | −72,78 | 1 364 | −72,74 | ||||
| 2025-08-14 | 13F | Rivernorth Capital Management, Llc | 81 830 | 441 |