Grunnleggende statistikk
| Institusjonelle eiere | 258 total, 258 long only, 0 short only, 0 long/short - change of 3,60% MRQ |
| Gjennomsnittlig porteføljeallokering | 0.2684 % - change of 50,27% MRQ |
| Institusjonelle aksjer (Long) | 10 858 895 (ex 13D/G) - change of 1,20MM shares 12,43% MRQ |
| Institusjonell verdi (Long) | $ 865 418 USD ($1000) |
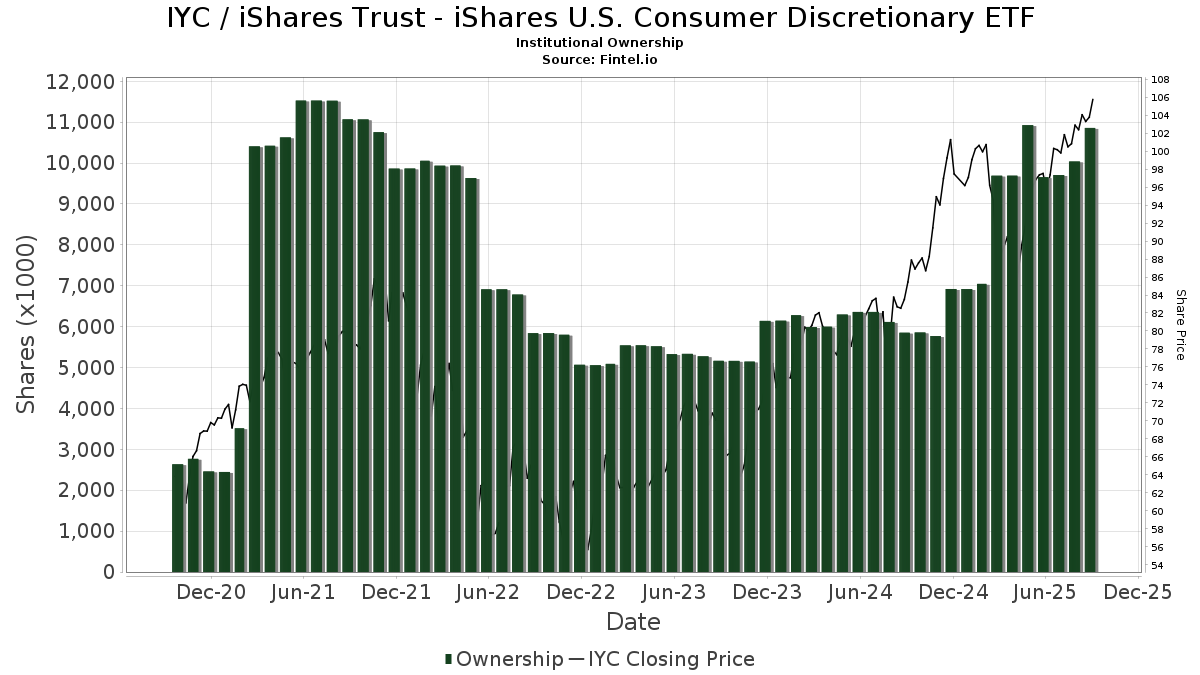
Institusjonelt eierskap og aksjonærer
iShares Trust - iShares U.S. Consumer Discretionary ETF (US:IYC) har 258 institusjonelle eiere og aksjonærer som har sendt inn 13D/G- eller 13F-skjemaer til Securities Exchange Commission (SEC). Disse institusjonene eier til sammen 10,858,895 aksjer. De største aksjonærene inkluderer Harel Insurance Investments & Financial Services Ltd., Morgan Stanley, Green Harvest Asset Management LLC, Bank Of America Corp /de/, UBS Group AG, Pinkerton Retirement Specialists, LLC, Mml Investors Services, Llc, Wells Fargo & Company/mn, Royal Bank Of Canada, and Raymond James Financial Inc .
iShares Trust - iShares U.S. Consumer Discretionary ETF (ARCA:IYC) institusjonell eierstruktur viser nåværende posisjoner i selskapet fordelt på institusjoner og fond, samt de siste endringene i posisjonsstørrelse. De største aksjonærene kan være individuelle investorer, verdipapirfond, hedgefond eller institusjoner. Schedule 13D indikerer at investoren eier (eller har eid) mer enn 5 % av selskapet og har til hensikt (eller hadde til hensikt) å aktivt forfølge en endring i forretningsstrategien. Schedule 13G indikerer en passiv investering på over 5 %.
The share price as of September 10, 2025 is 103,78 / share. Previously, on September 11, 2024, the share price was 83,51 / share. This represents an increase of 24,27% over that period.
Fondssentiment-score
Fondssentiment Score (også kjent som akkumulering av eierskap poengsum) viser hvilke aksjer som er mest kjøpt av fond. Den er resultatet av en sofistikert, kvantitativ flerfaktormodell som identifiserer selskaper med de høyeste nivåene av institusjonell akkumulering. Beregningsmodellen for poeng bruker en kombinasjon av den totale økningen i antall offentliggjorte eiere, endringer i porteføljeallokeringen til disse eierne og andre beregninger. Tallet går fra 0 til 100, der høyere tall indikerer en høyere grad av akkumulering i forhold til sammenlignbare selskaper, der 50 er gjennomsnittet.
Oppdateringsfrekvens: Daglig
Sjekk ut Ownership Explorer, som inneholder en liste over de høyest rangerte selskapene.
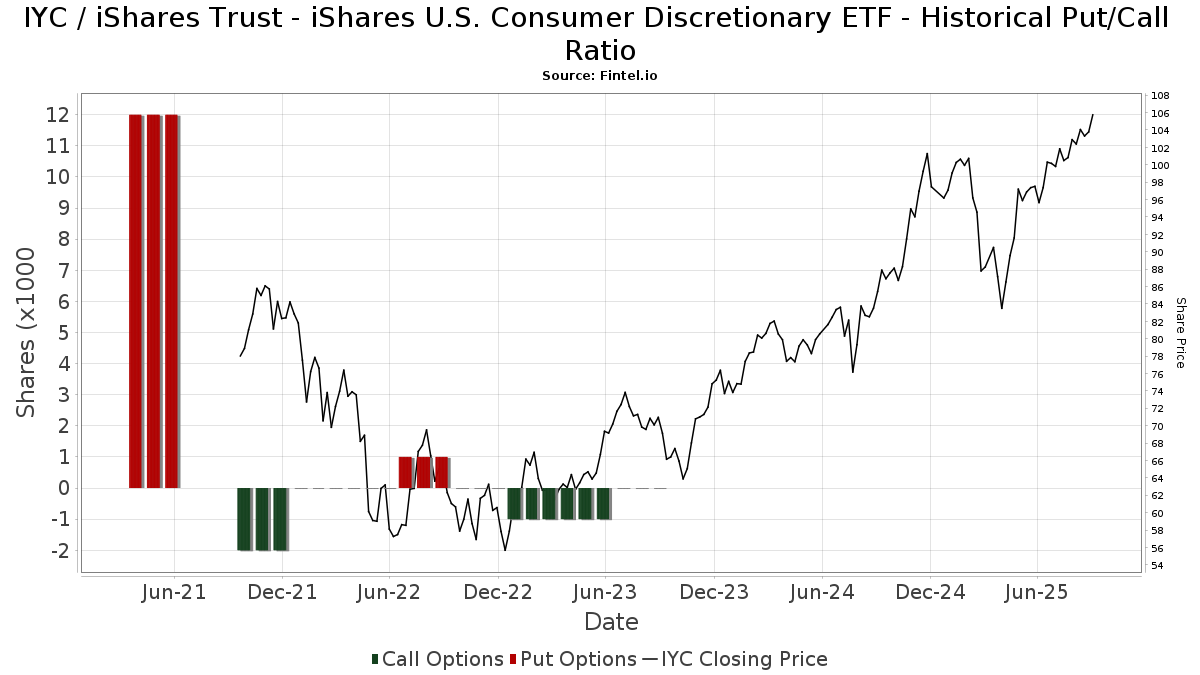
Institusjonell Put/Call-forhold
I tillegg til å rapportere standard aksje- og gjeldsemisjoner må institusjoner med mer enn 100 millioner kroner i forvaltningskapital også oppgi beholdningen av put- og callopsjoner. Siden put-opsjoner generelt indikerer et negativt sentiment, og call-opsjoner indikerer et positivt sentiment, kan vi få et inntrykk av det generelle institusjonelle sentimentet ved å plotte forholdet mellom put- og call-opsjoner. Diagrammet til høyre viser det historiske forholdet mellom put- og call-opsjoner for dette instrumentet.
Ved å bruke Put/Call-forholdet som en indikator på investorsentimentet kan man overvinne en av de viktigste svakhetene ved å bruke totalt institusjonelt eierskap, nemlig at en betydelig andel av forvaltningskapitalen investeres passivt for å følge indekser. Passivt forvaltede fond kjøper vanligvis ikke opsjoner, slik at indikatoren for put/call-forhold i større grad gjenspeiler stemningen i aktivt forvaltede fond.
13D/G-arkiveringer
Vi presenterer 13D/G-arkiveringene separat fra 13F-arkiveringene fordi de behandles forskjellig av SEC. 13D/G-arkiveringene kan sendes inn av grupper av investorer (med én leder), mens 13D/G-arkiveringene ikke kan sendes inn. Dette fører til situasjoner der en investor kan sende inn en 13D/G-rapport med én verdi for alle aksjene (som representerer alle aksjene som eies av investorgruppen), men deretter sende inn en 13F-melding med en annen verdi for alle aksjene (som kun representerer deres eget eierskap). Dette betyr at aksjeeierskap i 13D/G-arkiveringene og 13F-arkiveringene ofte ikke er direkte sammenlignbare, og vi presenterer dem derfor separat.
Merk: Fra og med 16. mai 2021 viser vi ikke lenger eiere som ikke har sendt inn en 13D/G i løpet av det siste året. Tidligere viste vi hele historikken for 13D/G-arkiveringer. Generelt må enheter som er pålagt å sende inn 13D/G-arkiveringer, sende inn minst én gang i året før de sender inn en avsluttende rapport. Det hender imidlertid at fond trekker seg ut av posisjoner uten å sende inn en avsluttende innlevering (dvs. at de avvikler), slik at visning av hele historikken av og til fører til forvirring om det nåværende eierskapet. For å unngå forvirring viser vi nå bare "nåværende" eiere, det vil si eiere som har sendt inn informasjon i løpet av det siste året.
Upgrade to unlock premium data.
13F- og NPORT-arkiveringer
Detaljer om 13F-arkiveringer er gratis. Detaljer om NP-arkiveringer krever et premium-medlemskap. Grønne rader indikerer nye posisjoner. Røde rader indikerer lukkede posisjoner. Klikk på lenke ikonet for å se hele transaksjonshistorikken.
Oppgrader
for å låse opp premiedata og eksportere til Excel. ![]() .
.
| Fildato | Kilde | Investor | Type | Gjennomsnittlig pris (estimert) |
Aksjer | Δ Aksjer (%) |
Rapportert verdi ($1000) | Verdi (%) | Portallokering (%) | |
|---|---|---|---|---|---|---|---|---|---|---|
| 2025-08-13 | 13F | Haverford Trust Co | 8 370 | 0,00 | 834 | 12,72 | ||||
| 2025-08-14 | 13F | EP Wealth Advisors, Inc. | 5 563 | 3,61 | 554 | 16,88 | ||||
| 2025-07-25 | 13F | Second Half Financial Partners, LLC | 0 | −100,00 | 0 | |||||
| 2025-07-16 | 13F | Advisors Management Group Inc /adv | 2 912 | 4,34 | 0 | |||||
| 2025-08-14 | 13F | D. E. Shaw & Co., Inc. | 4 658 | 68,89 | 464 | 90,95 | ||||
| 2025-08-18 | 13F/A | National Bank Of Canada /fi/ | 2 164 | −35,52 | 215 | −27,36 | ||||
| 2025-08-14 | 13F | Citadel Advisors Llc | 0 | −100,00 | 0 | |||||
| 2025-07-18 | 13F | USA Financial Portformulas Corp | 35 895 | 3 577 | ||||||
| 2025-07-30 | 13F | IMG Wealth Management, Inc. | 88 | 0,00 | 9 | 14,29 | ||||
| 2025-08-07 | 13F | Fountainhead AM, LLC | 2 193 | −62,79 | 219 | −58,08 | ||||
| 2025-07-28 | 13F | Patten & Patten Inc/tn | 7 732 | −1,65 | 770 | 10,95 | ||||
| 2025-07-30 | 13F | Canvas Wealth Advisors, LLC | 5 584 | 0,00 | 568 | 19,37 | ||||
| 2025-08-05 | 13F | Tiaa Trust, National Association | 4 260 | 0,00 | 424 | 12,77 | ||||
| 2025-04-22 | 13F | Synergy Financial Management, LLC | 0 | −100,00 | 0 | |||||
| 2025-08-06 | 13F | Simmons Bank | 12 050 | −1,95 | 1 201 | 10,60 | ||||
| 2025-07-22 | 13F | Beacon Financial Advisory LLC | 2 926 | 0,03 | 292 | 12,79 | ||||
| 2025-08-05 | 13F | Bank Of Montreal /can/ | 10 598 | 20,13 | 1 056 | 35,43 | ||||
| 2025-05-01 | 13F | WESPAC Advisors, LLC | 0 | −100,00 | 0 | |||||
| 2025-04-11 | 13F | Davis Capital Management | 348 | 0,00 | 31 | −9,09 | ||||
| 2025-08-04 | 13F | Spinnaker Trust | 13 928 | 0,00 | 1 388 | 12,76 | ||||
| 2025-08-12 | 13F | Pathstone Holdings, LLC | 0 | −100,00 | 0 | |||||
| 2025-05-12 | 13F | Americana Partners, LLC | 0 | −100,00 | 0 | |||||
| 2025-07-31 | 13F | Oppenheimer & Co Inc | 2 956 | 0,00 | 295 | 12,64 | ||||
| 2025-08-06 | 13F | Golden State Wealth Management, LLC | 143 | 0,00 | 14 | 16,67 | ||||
| 2025-08-11 | 13F | Private Advisor Group, LLC | 29 278 | 14,11 | 2 917 | 28,73 | ||||
| 2025-08-06 | 13F | Maltin Wealth Management, Inc. | 3 260 | 0,12 | 325 | 12,89 | ||||
| 2025-07-31 | 13F | Cambridge Investment Research Advisors, Inc. | 84 666 | 31,13 | 8 | 60,00 | ||||
| 2025-08-07 | 13F | Ibex Wealth Advisors | 8 957 | −14,79 | 892 | −3,88 | ||||
| 2025-08-14 | 13F | Ameriprise Financial Inc | 47 934 | −1,11 | 4 776 | 11,56 | ||||
| 2025-07-28 | 13F | Duncker Streett & Co Inc | 70 | 0,00 | 7 | 0,00 | ||||
| 2025-08-06 | 13F | Garrison Point Advisors, Llc | 13 870 | −2,05 | 1 382 | 10,56 | ||||
| 2025-07-22 | 13F | DAVENPORT & Co LLC | 14 426 | 18,94 | 1 437 | 34,17 | ||||
| 2025-08-13 | 13F | M&t Bank Corp | 6 001 | −30,89 | 598 | −22,06 | ||||
| 2025-05-14 | 13F | Hsbc Holdings Plc | 0 | −100,00 | 0 | |||||
| 2025-08-11 | 13F | GKV Capital Management Co., Inc. | 0 | −100,00 | 0 | |||||
| 2025-07-14 | 13F | U.S. Capital Wealth Advisors, LLC | 8 565 | −21,07 | 853 | −10,96 | ||||
| 2025-07-09 | 13F | Lifestyle Asset Management, Inc. | 10 004 | 997 | ||||||
| 2025-07-22 | 13F | Mascoma Wealth Management LLC | 1 000 | 0,00 | 100 | 12,50 | ||||
| 2025-05-14 | 13F | Snowden Capital Advisors LLC | 0 | −100,00 | 0 | |||||
| 2025-07-07 | 13F | Greenfield Savings Bank | 3 512 | 0,00 | 350 | 12,58 | ||||
| 2025-08-19 | 13F | Anchor Investment Management, LLC | 8 951 | −4,94 | 892 | 7,22 | ||||
| 2025-08-01 | 13F | Financial Counselors Inc | 0 | −100,00 | 0 | |||||
| 2025-08-05 | 13F | NewSquare Capital LLC | 36 | 4 | ||||||
| 2025-04-29 | 13F | Bank of New York Mellon Corp | 0 | −100,00 | 0 | −100,00 | ||||
| 2025-08-13 | 13F | Russell Investments Group, Ltd. | 28 | 3 | ||||||
| 2025-07-25 | 13F | Muirfield Wealth Advisors Llc | 6 307 | −12,15 | 628 | −0,95 | ||||
| 2025-08-06 | 13F | AE Wealth Management LLC | 49 247 | 32,41 | 4 907 | 49,35 | ||||
| 2025-08-12 | 13F | Holderness Investments Co | 2 632 | 0,04 | 262 | 12,93 | ||||
| 2025-07-10 | 13F | Wealth Enhancement Advisory Services, Llc | 2 801 | −7,89 | 282 | 5,22 | ||||
| 2025-07-24 | 13F | Ronald Blue Trust, Inc. | 375 | 0,00 | 37 | 12,12 | ||||
| 2025-08-12 | 13F | Park Square Financial Group, LLC | 72 | 0,00 | 7 | 16,67 | ||||
| 2025-08-12 | 13F | Founders Financial Alliance, LLC | 158 | −71,43 | 16 | −68,75 | ||||
| 2025-08-12 | 13F | O'shaughnessy Asset Management, Llc | 170 | 17 | ||||||
| 2025-08-15 | 13F | Morgan Stanley | 1 070 505 | 12,94 | 106 665 | 27,41 | ||||
| 2025-07-30 | 13F | Financial Perspectives, Inc | 760 | 0,00 | 76 | 11,94 | ||||
| 2025-08-14 | 13F | Susquehanna International Group, Llp | 0 | −100,00 | 0 | |||||
| 2025-07-10 | 13F | Global Financial Private Client, LLC | 0 | −100,00 | 0 | |||||
| 2025-07-17 | 13F | LexAurum Advisors, LLC | 2 899 | 2,22 | 289 | 15,20 | ||||
| 2025-07-30 | 13F | WESPAC Advisors SoCal, LLC | 9 904 | −65,57 | 987 | −61,18 | ||||
| 2025-07-23 | 13F | Prime Capital Investment Advisors, LLC | 5 580 | −35,28 | 556 | −26,94 | ||||
| 2025-08-07 | 13F | Samalin Investment Counsel, LLC | 3 883 | 1,86 | 387 | 14,88 | ||||
| 2025-08-12 | 13F | Pettyjohn, Wood & White, Inc | 5 500 | 0,00 | 548 | 12,99 | ||||
| 2025-08-19 | 13F | National Asset Management, Inc. | 3 264 | −36,01 | 325 | −33,67 | ||||
| 2025-08-14 | 13F | Goldman Sachs Group Inc | 112 178 | 26,12 | 11 177 | 42,27 | ||||
| 2025-08-08 | 13F | MTM Investment Management, LLC | 884 | 0,00 | 88 | 12,82 | ||||
| 2025-07-25 | 13F | Cwm, Llc | 6 812 | −0,80 | 1 | |||||
| 2025-07-16 | 13F | Minichmacgregor Wealth Management, Llc | 191 409 | 12,11 | 19 072 | 26,47 | ||||
| 2025-08-04 | 13F | Pinnacle Associates Ltd | 2 600 | 0,00 | 259 | 13,10 | ||||
| 2025-08-14 | 13F | Aqr Capital Management Llc | 2 688 | 268 | ||||||
| 2025-07-17 | 13F | Janney Montgomery Scott LLC | 5 717 | 0,32 | 1 | |||||
| 2025-08-05 | 13F | Huntington National Bank | 1 340 | 43,67 | ||||||
| 2025-08-14 | 13F | Stifel Financial Corp | 159 492 | 8,70 | 15 894 | 22,62 | ||||
| 2025-08-14 | 13F | Mariner, LLC | 33 137 | 166,72 | 3 302 | 200,91 | ||||
| 2025-07-28 | 13F | Hudson Capital Management LLC | 2 665 | 266 | ||||||
| 2025-05-12 | 13F | Simplex Trading, Llc | 0 | −100,00 | 0 | |||||
| 2025-08-12 | 13F | Proequities, Inc. | 0 | 0 | ||||||
| 2025-08-08 | 13F | Citizens Financial Group Inc/ri | 4 909 | 0,00 | 489 | 12,93 | ||||
| 2025-08-12 | 13F | Gladstone Institutional Advisory LLC | 4 492 | 73,64 | 448 | 96,05 | ||||
| 2025-07-15 | 13F | Well Done, LLC | 58 871 | 5 866 | ||||||
| 2025-08-07 | 13F | Allworth Financial LP | 1 180 | 0,00 | 118 | 12,50 | ||||
| 2025-07-24 | 13F | Blair William & Co/il | 5 433 | −0,80 | 541 | 12,01 | ||||
| 2025-08-06 | 13F | Moors & Cabot, Inc. | 6 408 | −81,69 | 638 | 1 578,95 | ||||
| 2025-08-06 | 13F | Commonwealth Equity Services, Llc | 70 143 | −2,10 | 7 | 0,00 | ||||
| 2025-08-14 | 13F | Sunbelt Securities, Inc. | 15 589 | −6,53 | 1 499 | 1,70 | ||||
| 2025-08-14 | 13F | UBS Group AG | 537 662 | −3,68 | 53 573 | 8,66 | ||||
| 2025-08-14 | 13F | Tudor Financial Inc. | 0 | −100,00 | 0 | |||||
| 2025-07-29 | 13F | Balboa Wealth Partners | 26 599 | 2 650 | ||||||
| 2025-07-17 | 13F/A | Capital Investment Advisors, LLC | 9 408 | 0,01 | 937 | 12,89 | ||||
| 2025-08-08 | 13F | Family Firm, Inc. | 0 | −100,00 | 0 | |||||
| 2025-08-15 | 13F | SkyView Investment Advisors, LLC | 0 | −100,00 | 0 | |||||
| 2025-07-16 | 13F | Dakota Wealth Management | 3 604 | 0,00 | 359 | 12,89 | ||||
| 2025-08-11 | 13F | TD Waterhouse Canada Inc. | 300 | 0,00 | 30 | 11,54 | ||||
| 2025-05-02 | 13F | Apollon Wealth Management, LLC | 0 | −100,00 | 0 | |||||
| 2025-07-16 | 13F | Southern Capital Advisors, Llc | 41 887 | 1,16 | 4 174 | 14,11 | ||||
| 2025-08-15 | 13F | CI Private Wealth, LLC | 20 814 | −23,49 | 2 074 | −13,70 | ||||
| 2025-08-19 | 13F | Advisory Services Network, LLC | 119 013 | −6,78 | 11 899 | 5,52 | ||||
| 2025-05-06 | 13F | Navellier & Associates Inc | 0 | −100,00 | 0 | |||||
| 2025-08-15 | 13F | Captrust Financial Advisors | 2 429 | −98,34 | 242 | −98,13 | ||||
| 2025-07-16 | 13F | West Branch Capital LLC | 68 | 0,00 | 7 | 0,00 | ||||
| 2025-08-01 | 13F | Gwn Securities Inc. | 0 | −100,00 | 0 | |||||
| 2025-08-13 | 13F | Marshall Wace, Llp | 2 594 | 258 | ||||||
| 2025-08-14 | 13F | Betterment LLC | 2 171 | 0 | ||||||
| 2025-08-14 | 13F | Wells Fargo & Company/mn | 334 853 | −10,23 | 33 365 | 1,27 | ||||
| 2025-05-07 | 13F | Norden Group Llc | 0 | −100,00 | 0 | |||||
| 2025-07-23 | 13F | West Paces Advisors Inc. | 422 | 100,95 | 42 | 133,33 | ||||
| 2025-07-28 | 13F | Harbour Investments, Inc. | 3 907 | 593,96 | 389 | 693,88 | ||||
| 2025-08-14 | 13F | Fmr Llc | 12 681 | 10,98 | 1 264 | 25,17 | ||||
| 2025-08-01 | 13F | Advisory Alpha, LLC | 2 187 | 218 | ||||||
| 2025-04-24 | 13F | Wright Fund Managment, LLC | 0 | −100,00 | 0 | |||||
| 2025-08-14 | 13F | Smartleaf Asset Management LLC | 18 989 | 22,22 | 1 891 | 38,26 | ||||
| 2025-04-28 | 13F | Clear Creek Financial Management, LLC | 0 | −100,00 | 0 | |||||
| 2025-07-17 | 13F | Patton Albertson Miller Group, Llc | 12 112 | 0,00 | 1 207 | 12,82 | ||||
| 2025-08-07 | 13F | Kestra Private Wealth Services, Llc | 2 350 | −35,86 | 234 | −27,55 | ||||
| 2025-08-14 | 13F | Bank Of America Corp /de/ | 853 831 | 9,09 | 85 076 | 23,06 | ||||
| 2025-08-04 | 13F | Spire Wealth Management | 0 | −100,00 | 0 | |||||
| 2025-07-23 | 13F | 1 North Wealth Services Llc | 615 | −34,22 | 61 | −25,61 | ||||
| 2025-08-14 | 13F | Wiley Bros.-aintree Capital, Llc | 10 066 | −3,92 | 1 003 | 8,68 | ||||
| 2025-05-09 | 13F | L & S Advisors Inc | 0 | −100,00 | 0 | |||||
| 2025-08-11 | 13F | Greykasell Wealth Strategies, Inc. | 2 896 | 0,00 | 289 | 12,94 | ||||
| 2025-08-14 | 13F | Mercer Global Advisors Inc /adv | 2 750 | 2,61 | 274 | 16,10 | ||||
| 2025-08-14 | 13F | Vivaldi Capital Management, LLC | 5 377 | 7,82 | 536 | 21,59 | ||||
| 2025-05-12 | 13F | Sandy Spring Bank | 1 660 | 0,00 | 147 | −8,18 | ||||
| 2025-08-13 | 13F | Continuum Advisory, LLC | 0 | −100,00 | 0 | |||||
| 2025-08-29 | 13F | Centaurus Financial, Inc. | 8 705 | 127,34 | 1 | |||||
| 2025-07-08 | 13F | Nbc Securities, Inc. | 200 | 0,00 | 0 | |||||
| 2025-08-12 | 13F | MAI Capital Management | 2 961 | −14,96 | 295 | −3,91 | ||||
| 2025-08-07 | 13F | Summit X, LLC | 4 821 | −3,70 | 480 | 8,60 | ||||
| 2025-08-14 | 13F | Essential Planning, LLC. | 2 160 | −10,00 | 215 | 1,90 | ||||
| 2025-04-29 | 13F | Resources Investment Advisors, LLC. | 0 | −100,00 | 0 | −100,00 | ||||
| 2025-07-24 | 13F | IFP Advisors, Inc | 2 216 | 0,82 | 221 | 13,40 | ||||
| 2025-08-08 | 13F | Hartland & Co., LLC | 655 | 0,00 | 65 | 14,04 | ||||
| 2025-08-15 | 13F | Kestra Advisory Services, LLC | 18 711 | 403,12 | 1 864 | 468,29 | ||||
| 2025-08-06 | 13F | Prospera Financial Services Inc | 127 384 | −38,06 | 12 693 | −30,12 | ||||
| 2025-08-13 | 13F | Virtue Capital Management, LLC | 11 688 | 24,34 | 1 165 | 40,24 | ||||
| 2025-07-29 | 13F | Koshinski Asset Management, Inc. | 11 145 | 0,01 | 1 111 | 12,80 | ||||
| 2025-08-18 | 13F | Front Row Advisors LLC | 1 390 | −24,86 | 138 | −15,34 | ||||
| 2025-05-02 | 13F | Fortis Group Advisors, LLC | 0 | −100,00 | 0 | |||||
| 2025-04-04 | 13F | Three Seasons Wealth, LLC | 0 | −100,00 | 0 | −100,00 | ||||
| 2025-08-14 | 13F | Mml Investors Services, Llc | 343 195 | 35,15 | 34 | 54,55 | ||||
| 2025-08-04 | 13F | AMG National Trust Bank | 12 452 | −0,40 | 1 241 | 12,32 | ||||
| 2025-08-14 | 13F | Glenview Trust Co | 3 158 | −40,59 | 315 | −33,05 | ||||
| 2025-07-29 | 13F | Signature Estate & Investment Advisors Llc | 6 317 | 0,14 | 629 | 12,93 | ||||
| 2025-07-30 | 13F | Clifford Swan Investment Counsel Llc | 4 000 | 0,00 | 399 | 12,75 | ||||
| 2025-07-25 | 13F | Genesee Capital Advisors, LLC | 14 396 | 65,03 | 1 434 | 86,23 | ||||
| 2025-07-29 | 13F | Stephens Inc /ar/ | 2 868 | 0,00 | 286 | 12,65 | ||||
| 2025-07-23 | 13F | Sax Wealth Advisors, Llc | 2 124 | 212 | ||||||
| 2025-07-30 | 13F | Cookson Peirce & Co Inc | 6 146 | −4,24 | 612 | 8,13 | ||||
| 2025-07-21 | 13F | Ameritas Advisory Services, LLC | 684 | 68 | ||||||
| 2025-07-24 | 13F | Wealthstar Advisors, Llc | 19 219 | 1 915 | ||||||
| 2025-08-01 | 13F | Zhang Financial LLC | 2 734 | 272 | ||||||
| 2025-07-02 | 13F | Central Pacific Bank - Trust Division | 81 | 0,00 | 8 | 14,29 | ||||
| 2025-04-30 | 13F | Moloney Securities Asset Management, LLC | 0 | −100,00 | 0 | |||||
| 2025-08-13 | 13F | VestGen Advisors, LLC | 23 124 | 10,61 | 2 304 | 24,81 | ||||
| 2025-06-30 | NP | Two Roads Shared Trust - Anfield U.S. Equity Sector Rotation ETF | 49 467 | 4 430 | ||||||
| 2025-08-14 | 13F | CoreCap Advisors, LLC | 5 843 | 15,63 | 582 | 30,49 | ||||
| 2025-05-12 | 13F | Townsquare Capital Llc | 0 | −100,00 | 0 | |||||
| 2025-09-04 | 13F/A | Advisor Group Holdings, Inc. | 150 149 | 1,39 | 14 961 | 14,38 | ||||
| 2025-07-08 | 13F | Arlington Trust Co LLC | 175 | 0,00 | 17 | 13,33 | ||||
| 2025-07-16 | 13F | Cadent Capital Advisors, LLC | 49 157 | 1,04 | 4 898 | 13,99 | ||||
| 2025-08-01 | 13F | Planning Directions Inc | 4 233 | 0,14 | 422 | 12,87 | ||||
| 2025-08-14 | 13F | Hrt Financial Lp | 0 | −100,00 | 0 | |||||
| 2025-08-14 | 13F | Zurich Insurance Group Ltd/FI | 40 500 | 4 059 | ||||||
| 2025-07-21 | 13F | Pflug Koory, LLC | 136 | 0,00 | 14 | 8,33 | ||||
| 2025-08-11 | 13F | Rothschild Investment Llc | 150 | 0,00 | 15 | 7,69 | ||||
| 2025-08-14 | 13F | Fwl Investment Management, Llc | 400 | 0,00 | 40 | 11,43 | ||||
| 2025-08-12 | 13F | Global Retirement Partners, LLC | 2 710 | 284,94 | 270 | 302,99 | ||||
| 2025-08-27 | 13F/A | Brinker Capital Investments, LLC | 4 595 | 458 | ||||||
| 2025-07-17 | 13F | Global Trust Asset Management, LLC | 0 | −100,00 | 0 | |||||
| 2025-08-12 | 13F | Jpmorgan Chase & Co | 28 568 | −64,00 | 2 847 | −59,40 | ||||
| 2025-08-14 | 13F | KKM Financial LLC | 9 693 | −8,20 | 966 | 3,54 | ||||
| 2025-05-01 | 13F | Coastal Investment Advisors, Inc. | 0 | −100,00 | 0 | |||||
| 2025-08-04 | 13F | Adell Harriman & Carpenter Inc | 5 560 | 0,00 | 554 | 12,63 | ||||
| 2025-08-14 | 13F | MGB Wealth Management, LLC | 1 936 | 0,00 | 193 | 12,94 | ||||
| 2025-07-14 | 13F | AdvisorNet Financial, Inc | 12 337 | −1,41 | 1 229 | 11,22 | ||||
| 2025-05-09 | 13F | J. Safra Sarasin Holding AG | 0 | −100,00 | 0 | |||||
| 2025-08-14 | 13F | Raymond James Financial Inc | 229 648 | 10,40 | 22 882 | 24,55 | ||||
| 2025-07-28 | 13F | Chesapeake Wealth Management | 3 220 | −6,12 | 321 | 5,96 | ||||
| 2025-08-01 | 13F | Envestnet Asset Management Inc | 54 465 | 41,27 | 5 427 | 59,35 | ||||
| 2025-08-15 | 13F | Cooksen Wealth, LLC | 21 | −93,84 | 2 | −92,59 | ||||
| 2025-07-23 | 13F | Independent Solutions Wealth Management, LLC | 2 786 | 9,77 | 278 | 23,66 | ||||
| 2025-08-05 | 13F | Optivise Advisory Services LLC | 13 034 | 0,00 | 1 299 | 12,77 | ||||
| 2025-08-08 | 13F | Pnc Financial Services Group, Inc. | 3 714 | −4,25 | 370 | 8,19 | ||||
| 2025-08-11 | 13F | Citigroup Inc | 6 505 | −42,13 | 648 | −34,68 | ||||
| 2025-07-29 | 13F | Private Trust Co Na | 352 | 0,00 | 35 | 12,90 | ||||
| 2025-07-15 | 13F | Eaton Financial Holdings Company, LLC | 30 083 | 0,00 | 2 997 | 12,80 | ||||
| 2025-08-18 | 13F | Geneos Wealth Management Inc. | 4 680 | 200,00 | 466 | 240,15 | ||||
| 2025-07-25 | 13F | Concurrent Investment Advisors, LLC | 5 723 | 29,57 | 570 | 46,15 | ||||
| 2025-08-12 | 13F | CIBC Private Wealth Group, LLC | 928 | −53,32 | 92 | −41,40 | ||||
| 2025-07-29 | 13F | Cottonwood Capital Advisors, Llc | 24 815 | −1,07 | 2 473 | 11,60 | ||||
| 2025-08-11 | 13F | Principal Securities, Inc. | 38 049 | 393,31 | 3 791 | 411,61 | ||||
| 2025-05-05 | 13F | Diversify Advisory Services, LLC | 0 | −100,00 | 0 | |||||
| 2025-08-04 | 13F | Eubel Brady & Suttman Asset Management Inc | 4 000 | 0,00 | 0 | |||||
| 2025-08-14 | 13F | Bnp Paribas Arbitrage, Sa | 51 400 | −48,96 | 5 121 | −42,42 | ||||
| 2025-08-14 | 13F | Royal Bank Of Canada | 261 507 | 1,20 | 26 056 | 14,16 | ||||
| 2025-08-06 | 13F | Csenge Advisory Group | 3 886 | 7,38 | 376 | 22,95 | ||||
| 2025-08-08 | 13F | Cetera Investment Advisers | 44 848 | 230,96 | 4 469 | 273,58 | ||||
| 2025-08-08 | 13F | Capital Investment Advisory Services, LLC | 1 260 | 0,16 | 126 | 12,61 | ||||
| 2025-05-07 | 13F | Vista Private Wealth Partners. LLC | 0 | −100,00 | 0 | |||||
| 2025-07-18 | 13F | TruNorth Capital Management, LLC | 0 | −100,00 | 0 | |||||
| 2025-07-14 | 13F | Whitener Capital Management, Inc. | 11 508 | −3,74 | 1 147 | 8,63 | ||||
| 2025-08-06 | 13F | Rps Advisory Solutions Llc | 2 062 | 205 | ||||||
| 2025-07-09 | 13F | Summit Financial Consulting LLC | 58 273 | −3,42 | 5 806 | 8,95 | ||||
| 2025-08-14 | 13F | Quantinno Capital Management LP | 7 794 | 23,24 | 777 | 39,07 | ||||
| 2025-07-17 | 13F | Tritonpoint Wealth, Llc | 21 301 | −4,36 | 2 122 | 7,88 | ||||
| 2025-07-10 | 13F | Focus Financial Network, Inc. | 2 942 | 4,62 | 293 | 18,15 | ||||
| 2025-07-10 | 13F | Ferguson Wellman Capital Management, Inc | 57 089 | −2,67 | 5 688 | 9,81 | ||||
| 2025-07-17 | 13F | Sound Income Strategies, LLC | 50 | −86,23 | 5 | −84,37 | ||||
| 2025-08-15 | 13F | Equitable Holdings, Inc. | 30 551 | 161,88 | 3 044 | 195,53 | ||||
| 2025-08-08 | 13F | Foundations Investment Advisors, LLC | 199 897 | 5,40 | 19 918 | 18,91 | ||||
| 2025-07-28 | 13F | Harbour Trust & Investment Management Co | 2 056 | 205 | ||||||
| 2025-05-15 | 13F | Lido Advisors, LLC | 0 | −100,00 | 0 | −100,00 | ||||
| 2025-08-12 | 13F | Wealthbridge Capital Management, Llc | 4 980 | −14,43 | 496 | −3,50 | ||||
| 2025-07-18 | 13F | Truist Financial Corp | 13 358 | −10,04 | 1 331 | 1,45 | ||||
| 2025-08-11 | 13F | HighTower Advisors, LLC | 14 012 | 2,11 | 1 396 | 15,18 | ||||
| 2025-07-18 | 13F | SOA Wealth Advisors, LLC. | 497 | 0,20 | 50 | 13,95 | ||||
| 2025-07-10 | 13F | Piscataqua Savings Bank | 40 | 0,00 | 4 | 0,00 | ||||
| 2025-08-13 | 13F | Pinkerton Retirement Specialists, LLC | 344 097 | 34 286 | ||||||
| 2025-08-26 | 13F/A | Thrivent Financial For Lutherans | 23 202 | 37,46 | 2 | 100,00 | ||||
| 2025-08-05 | 13F | Harel Insurance Investments & Financial Services Ltd. | 1 593 101 | 21,02 | 159 | 36,21 | ||||
| 2025-08-13 | 13F | Baird Financial Group, Inc. | 2 864 | −17,77 | 285 | −7,17 | ||||
| 2025-08-13 | 13F | Jones Financial Companies Lllp | 14 949 | 25,38 | 1 488 | 41,85 | ||||
| 2025-08-13 | 13F | Northwestern Mutual Wealth Management Co | 39 641 | 4,27 | 3 950 | 17,60 | ||||
| 2025-08-13 | 13F | Colonial Trust Advisors | 255 | 0,00 | 25 | 13,64 | ||||
| 2025-07-25 | 13F | SPC Financial, Inc. | 184 343 | 0,70 | 18 368 | 13,60 | ||||
| 2025-07-18 | 13F | Trust Co Of Vermont | 0 | −100,00 | 0 | |||||
| 2025-08-06 | 13F | Atlantic Union Bankshares Corp | 1 660 | 165 | ||||||
| 2025-08-11 | 13F | Ritter Daniher Financial Advisory LLC / DE | 190 | 0,00 | 19 | 12,50 | ||||
| 2025-08-14 | 13F | Jane Street Group, Llc | 28 030 | 71,83 | 2 793 | 93,89 | ||||
| 2025-08-07 | 13F | Midwest Trust Co | 3 560 | 355 | ||||||
| 2025-04-08 | 13F | Parallel Advisors, LLC | 0 | −100,00 | 0 | |||||
| 2025-07-30 | 13F | Gimbal Financial | 156 124 | 15 556 | ||||||
| 2025-08-08 | 13F | Gts Securities Llc | 4 083 | −73,21 | 407 | −69,84 | ||||
| 2025-07-30 | 13F | Whittier Trust Co Of Nevada Inc | 5 520 | 0,00 | 550 | 12,94 | ||||
| 2025-07-11 | 13F | Farther Finance Advisors, LLC | 1 796 | −19,82 | 179 | −10,55 | ||||
| 2025-07-30 | 13F | Brookstone Capital Management | 3 919 | −33,64 | 390 | −25,14 | ||||
| 2025-08-14 | 13F | Camarda Financial Advisors, LLC | 137 272 | 13 678 | ||||||
| 2025-04-30 | 13F | Sofos Investments, Inc. | 204 | −29,17 | 18 | −21,74 | ||||
| 2025-08-08 | 13F | Creative Planning | 9 261 | 3,95 | 923 | 17,30 | ||||
| 2025-08-13 | 13F | Flow Traders U.s. Llc | 0 | −100,00 | 0 | |||||
| 2025-07-30 | 13F | Sonata Capital Group Inc | 6 596 | 0,00 | 1 | |||||
| 2025-08-12 | 13F | BlackRock, Inc. | 27 606 | −41,23 | 2 751 | −33,70 | ||||
| 2025-08-13 | 13F | AMJ Financial Wealth Management | 3 443 | 7,39 | 343 | 21,20 | ||||
| 2025-08-04 | 13F | Buck Wealth Strategies, LLC | 10 163 | 52,92 | 1 013 | 72,40 | ||||
| 2025-08-05 | 13F | Transatlantique Private Wealth Llc | 32 653 | 7,08 | 3 254 | 20,79 | ||||
| 2025-07-18 | 13F | Bartlett & Co. Wealth Management Llc | 6 680 | 0,00 | 666 | 12,71 | ||||
| 2025-08-12 | 13F | AlphaCore Capital LLC | 11 | 0,00 | 1 | |||||
| 2025-08-15 | 13F | Tower Research Capital LLC (TRC) | 0 | −100,00 | 0 | |||||
| 2025-07-11 | 13F | Spence Asset Management | 11 879 | 10,25 | 1 | |||||
| 2025-07-30 | 13F | Wbh Advisory Inc | 0 | −100,00 | 0 | |||||
| 2025-08-06 | 13F | SOUTH STATE Corp | 320 | 0,00 | 32 | 10,71 | ||||
| 2025-08-14 | 13F | Quartz Partners, LLC | 2 228 | 222 | ||||||
| 2025-08-05 | 13F | Allstate Corp | 3 850 | 384 | ||||||
| 2025-08-07 | 13F | CENTRAL TRUST Co | 200 | 0,00 | 20 | 11,76 | ||||
| 2025-05-12 | 13F | FIL Ltd | 0 | −100,00 | 0 | |||||
| 2025-05-16 | 13F | Laidlaw Wealth Management LLC | 0 | −100,00 | 0 | |||||
| 2025-08-13 | 13F | Cresset Asset Management, LLC | 3 584 | 0,00 | 357 | 12,97 | ||||
| 2025-08-14 | 13F | Federation des caisses Desjardins du Quebec | 0 | −100,00 | 0 | |||||
| 2025-08-04 | 13F | Migdal Insurance & Financial Holdings Ltd. | 2 331 | −11,70 | 0 | |||||
| 2025-08-15 | 13F | Blue Chip Partners, Inc. | 2 205 | 220 | ||||||
| 2025-07-14 | 13F | Argentarii, LLC | 2 400 | 0,00 | 239 | 13,27 | ||||
| 2025-07-23 | 13F | Tyche Wealth Partners LLC | 2 321 | 0,04 | 231 | 13,24 | ||||
| 2025-08-13 | 13F | Quadrature Capital Ltd | 0 | −100,00 | 0 | |||||
| 2025-08-11 | 13F | Strategic Wealth Partners, Ltd. | 4 878 | 16,78 | 486 | 15,44 | ||||
| 2025-08-12 | 13F | LPL Financial LLC | 215 011 | 16,13 | 21 424 | 31,01 | ||||
| 2025-07-21 | 13F | Yeomans Consulting Group, Inc. | 10 240 | 1 023 | ||||||
| 2025-04-24 | 13F | First Merchants Corp | 0 | −100,00 | 0 | |||||
| 2025-08-13 | 13F | Renaissance Technologies Llc | 2 600 | 259 | ||||||
| 2025-08-12 | 13F | One Charles Private Wealth Services, LLC | 4 836 | −0,66 | 482 | 12,12 | ||||
| 2025-07-29 | 13F | Chevy Chase Trust Holdings, Inc. | 6 924 | 0,00 | 690 | 12,77 | ||||
| 2025-05-16 | 13F | Great Lakes Advisors, Llc | 0 | −100,00 | 0 | |||||
| 2025-08-12 | 13F | Sierra Summit Advisors Llc | 2 235 | 223 | ||||||
| 2025-07-29 | 13F | Chicago Partners Investment Group LLC | 3 001 | 0,13 | 306 | 11,31 | ||||
| 2025-07-16 | 13F | Stillwater Capital Advisors, LLC | 27 663 | −0,23 | 2 756 | 12,58 | ||||
| 2025-08-07 | 13F | Parkside Financial Bank & Trust | 661 | 535,58 | 66 | 622,22 | ||||
| 2025-08-14 | 13F | GWM Advisors LLC | 13 057 | −5,64 | 1 301 | 6,38 | ||||
| 2025-08-08 | 13F | Financial Gravity Companies, Inc. | 68 | −66,67 | 7 | −68,42 | ||||
| 2025-07-08 | 13F | Atlas Brown,Inc. | 2 515 | 0,16 | 251 | 13,12 | ||||
| 2025-08-05 | 13F | GPS Wealth Strategies Group, LLC | 1 931 | 0,10 | 192 | 12,94 | ||||
| 2025-08-13 | 13F | StoneX Group Inc. | 0 | −100,00 | 0 | −100,00 | ||||
| 2025-08-07 | 13F | Apeiron RIA LLC | 8 098 | 116,00 | 807 | 143,50 | ||||
| 2025-07-16 | 13F/A | CX Institutional | 165 | 243,75 | 0 | |||||
| 2025-08-06 | 13F | Stonebridge Financial Planning Group, LLC | 26 438 | −5,52 | 2 634 | 6,60 | ||||
| 2025-08-11 | 13F | Anfield Capital Management, LLC | 49 789 | −1,28 | 4 961 | 11,36 | ||||
| 2025-07-23 | 13F | Ameliora Wealth Management Ltd. | 11 000 | 0,00 | 1 096 | 12,87 | ||||
| 2025-07-28 | 13F | Private Wealth Asset Management, LLC | 2 400 | 0,00 | 239 | 13,27 | ||||
| 2025-07-15 | 13F | Patriot Investment Management Inc. | 4 853 | −7,08 | 484 | 4,77 | ||||
| 2025-07-07 | 13F | First Citizens Financial Corp | 51 740 | −13,28 | 5 155 | −2,16 | ||||
| 2025-08-14 | 13F | Comerica Bank | 7 607 | 0,11 | 758 | 12,82 | ||||
| 2025-07-17 | 13F | Lee Johnson Capital Management, Llc | 17 077 | 1 702 | ||||||
| 2025-08-08 | 13F | Symphony Financial Services, Inc. | 2 321 | 0,00 | 231 | 12,68 | ||||
| 2025-08-14 | 13F | Financial Engines Advisors L.L.C. | 3 331 | 332 | ||||||
| 2025-07-30 | 13F | Atlantic Edge Private Wealth Management, LLC | 580 | 0,00 | 58 | 11,76 | ||||
| 2025-08-04 | 13F | Atria Investments Llc | 8 765 | −1,73 | 873 | 10,93 | ||||
| 2025-04-02 | 13F/A | Picton Mahoney Asset Management | 0 | −100,00 | 0 | |||||
| 2025-07-28 | 13F | WJ Wealth Management, LLC | 3 880 | 0,00 | 387 | 12,87 | ||||
| 2025-04-25 | 13F | Westfuller Advisors, LLC | 0 | −100,00 | 0 | −100,00 | ||||
| 2025-07-15 | 13F | North Star Investment Management Corp. | 4 307 | 0,05 | 429 | 12,89 | ||||
| 2025-05-09 | 13F | Atria Wealth Solutions, Inc. | 0 | −100,00 | 0 | |||||
| 2025-08-11 | 13F | Bellwether Advisors, LLC | 1 | 0 | ||||||
| 2025-08-12 | 13F | Coldstream Capital Management Inc | 4 932 | 0,00 | 491 | 12,87 | ||||
| 2025-07-14 | 13F | Armstrong Advisory Group, Inc | 114 | 11 | ||||||
| 2025-07-23 | 13F | Lakeshore Capital Group, Inc. | 11 466 | −9,04 | 1 143 | 2,61 | ||||
| 2025-08-07 | 13F | Commerce Bank | 5 285 | 1,93 | 527 | 15,10 | ||||
| 2025-08-07 | 13F | Montag A & Associates Inc | 696 | 0,00 | 69 | 13,11 | ||||
| 2025-07-22 | 13F | Gsa Capital Partners Llp | 3 796 | 38,79 | 0 | |||||
| 2025-08-14 | 13F | Qube Research & Technologies Ltd | 58 146 | −15,58 | 5 794 | −4,77 | ||||
| 2025-07-28 | 13F | Mutual Advisors, LLC | 18 129 | 15,75 | 1 839 | 31,57 | ||||
| 2025-08-12 | 13F | Steward Partners Investment Advisory, Llc | 24 482 | 183,13 | 2 439 | 219,66 | ||||
| 2025-08-11 | 13F | United Capital Financial Advisers, Llc | 53 429 | 0,22 | 5 324 | 13,06 | ||||
| 2025-08-13 | 13F | Green Harvest Asset Management LLC | 1 027 290 | 5,45 | 102 359 | 18,96 | ||||
| 2025-08-26 | NP | Forethought Variable Insurance Trust - Global Atlantic BlackRock Selects Managed Risk Portfolio (formerly Global Atlantic BlackRock Global Allocation Managed Risk Portfolio) Global Atlantic BlackRock Global Allocation Managed Risk Portfolio | 27 286 | −38,39 | 2 719 | −30,50 | ||||
| 2025-08-19 | 13F | Newbridge Financial Services Group, Inc. | 155 | 15 | ||||||
| 2025-07-14 | 13F | Farmers & Merchants Investments Inc | 864 | 0,00 | 86 | 13,16 |