Grunnleggende statistikk
| Institusjonelle eiere | 237 total, 237 long only, 0 short only, 0 long/short - change of −1,66% MRQ |
| Gjennomsnittlig porteføljeallokering | 0.4384 % - change of −4,05% MRQ |
| Institusjonelle aksjer (Long) | 25 002 968 (ex 13D/G) - change of 0,47MM shares 1,91% MRQ |
| Institusjonell verdi (Long) | $ 1 601 548 USD ($1000) |
Institusjonelt eierskap og aksjonærer
First Trust Exchange-Traded Fund III - First Trust Long/Short Equity ETF (US:FTLS) har 237 institusjonelle eiere og aksjonærer som har sendt inn 13D/G- eller 13F-skjemaer til Securities Exchange Commission (SEC). Disse institusjonene eier til sammen 25,002,968 aksjer. De største aksjonærene inkluderer Morgan Stanley, Royal Bank Of Canada, Ameriprise Financial Inc, LPL Financial LLC, Raymond James Financial Inc, Cetera Investment Advisers, Envestnet Asset Management Inc, Truist Financial Corp, CENTRAL TRUST Co, and Stifel Financial Corp .
First Trust Exchange-Traded Fund III - First Trust Long/Short Equity ETF (ARCA:FTLS) institusjonell eierstruktur viser nåværende posisjoner i selskapet fordelt på institusjoner og fond, samt de siste endringene i posisjonsstørrelse. De største aksjonærene kan være individuelle investorer, verdipapirfond, hedgefond eller institusjoner. Schedule 13D indikerer at investoren eier (eller har eid) mer enn 5 % av selskapet og har til hensikt (eller hadde til hensikt) å aktivt forfølge en endring i forretningsstrategien. Schedule 13G indikerer en passiv investering på over 5 %.
The share price as of September 12, 2025 is 68,76 / share. Previously, on September 13, 2024, the share price was 62,59 / share. This represents an increase of 9,86% over that period.

Fondssentiment-score
Fondssentiment Score (også kjent som akkumulering av eierskap poengsum) viser hvilke aksjer som er mest kjøpt av fond. Den er resultatet av en sofistikert, kvantitativ flerfaktormodell som identifiserer selskaper med de høyeste nivåene av institusjonell akkumulering. Beregningsmodellen for poeng bruker en kombinasjon av den totale økningen i antall offentliggjorte eiere, endringer i porteføljeallokeringen til disse eierne og andre beregninger. Tallet går fra 0 til 100, der høyere tall indikerer en høyere grad av akkumulering i forhold til sammenlignbare selskaper, der 50 er gjennomsnittet.
Oppdateringsfrekvens: Daglig
Sjekk ut Ownership Explorer, som inneholder en liste over de høyest rangerte selskapene.
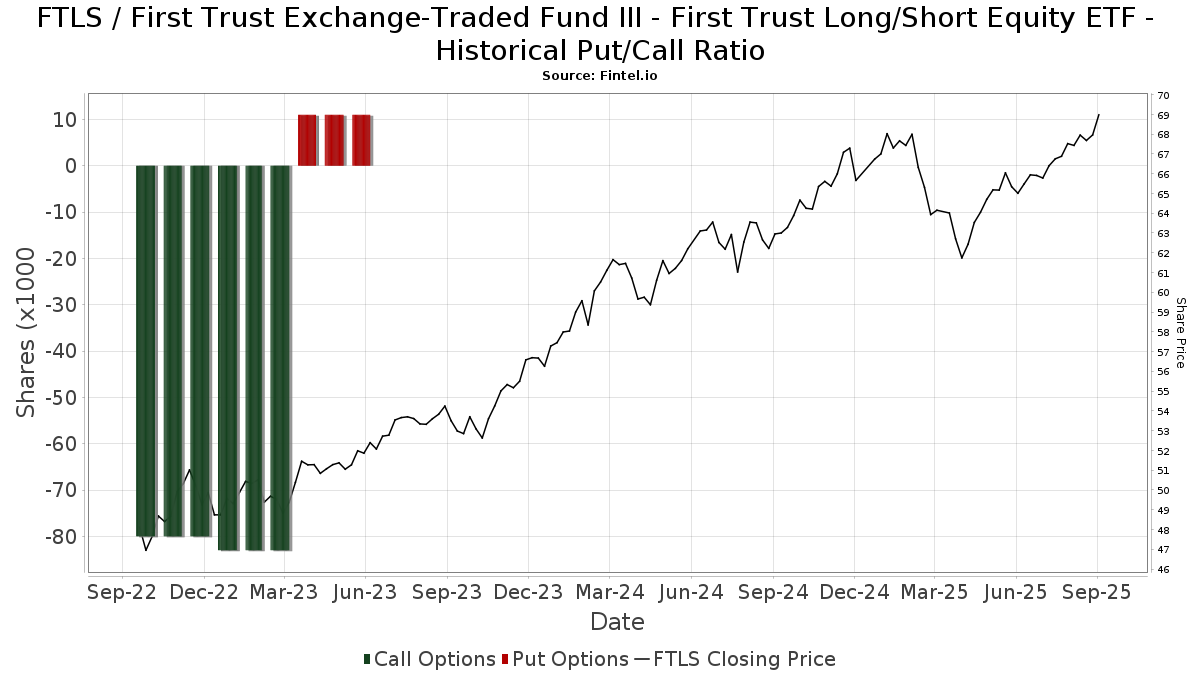
Institusjonell Put/Call-forhold
I tillegg til å rapportere standard aksje- og gjeldsemisjoner må institusjoner med mer enn 100 millioner kroner i forvaltningskapital også oppgi beholdningen av put- og callopsjoner. Siden put-opsjoner generelt indikerer et negativt sentiment, og call-opsjoner indikerer et positivt sentiment, kan vi få et inntrykk av det generelle institusjonelle sentimentet ved å plotte forholdet mellom put- og call-opsjoner. Diagrammet til høyre viser det historiske forholdet mellom put- og call-opsjoner for dette instrumentet.
Ved å bruke Put/Call-forholdet som en indikator på investorsentimentet kan man overvinne en av de viktigste svakhetene ved å bruke totalt institusjonelt eierskap, nemlig at en betydelig andel av forvaltningskapitalen investeres passivt for å følge indekser. Passivt forvaltede fond kjøper vanligvis ikke opsjoner, slik at indikatoren for put/call-forhold i større grad gjenspeiler stemningen i aktivt forvaltede fond.
13F- og NPORT-arkiveringer
Detaljer om 13F-arkiveringer er gratis. Detaljer om NP-arkiveringer krever et premium-medlemskap. Grønne rader indikerer nye posisjoner. Røde rader indikerer lukkede posisjoner. Klikk på lenke ikonet for å se hele transaksjonshistorikken.
Oppgrader
for å låse opp premiedata og eksportere til Excel. ![]() .
.
| Fildato | Kilde | Investor | Type | Gjennomsnittlig pris (estimert) |
Aksjer | Δ Aksjer (%) |
Rapportert verdi ($1000) | Verdi (%) | Portallokering (%) | |
|---|---|---|---|---|---|---|---|---|---|---|
| 2025-04-18 | 13F | Insigneo Advisory Services, Llc | 0 | −100,00 | 0 | |||||
| 2025-08-28 | NP | TFAFX - Tactical Growth Allocation Fund Class I | 6 739 | 0,00 | 447 | 3,48 | ||||
| 2025-08-13 | 13F | Baird Financial Group, Inc. | 43 329 | 0,24 | 2 872 | 3,68 | ||||
| 2025-08-14 | 13F | Harvest Investment Services, LLC | 10 485 | −0,29 | 695 | 3,12 | ||||
| 2025-07-08 | 13F | Richard P Slaughter Associates Inc | 30 704 | −73,73 | 2 035 | −72,83 | ||||
| 2025-07-16 | 13F | EdgeRock Capital LLC | 184 682 | 18,21 | 12 250 | 22,37 | ||||
| 2025-08-29 | 13F | Centaurus Financial, Inc. | 5 658 | −25,20 | 0 | |||||
| 2025-07-14 | 13F | Park Avenue Securities Llc | 9 301 | −0,52 | 1 | |||||
| 2025-08-12 | 13F | Cornerstone Wealth Management, LLC | 14 297 | 37,75 | 948 | 42,41 | ||||
| 2025-08-14 | 13F | Snowden Capital Advisors LLC | 6 912 | −0,32 | 458 | 3,15 | ||||
| 2025-07-11 | 13F | Seacrest Wealth Management, Llc | 0 | −100,00 | 0 | |||||
| 2025-07-21 | 13F | Ntv Asset Management Llc | 5 808 | 0,00 | 385 | 3,23 | ||||
| 2025-07-25 | 13F | Prostatis Group LLC | 55 485 | −10,13 | 3 678 | −7,05 | ||||
| 2025-08-06 | 13F | Savant Capital, LLC | 7 277 | −14,23 | 482 | −11,23 | ||||
| 2025-08-15 | 13F | Morgan Stanley | 6 137 971 | 0,21 | 406 825 | 3,65 | ||||
| 2025-08-05 | 13F | Frederick Financial Consultants, LLC | 26 483 | 15,12 | 1 755 | 19,06 | ||||
| 2025-07-17 | 13F | Montis Financial, LLC | 23 242 | 12,18 | 1 540 | 16,05 | ||||
| 2025-08-13 | 13F | Jones Financial Companies Lllp | 0 | −100,00 | 0 | |||||
| 2025-07-30 | 13F | First Citizens Bank & Trust Co | 6 642 | −63,25 | 440 | −62,00 | ||||
| 2025-08-11 | 13F | Nations Financial Group Inc, /ia/ /adv | 17 268 | 3,89 | 1 145 | 7,42 | ||||
| 2025-07-22 | 13F | Old National Bancorp /in/ | 38 141 | 6,08 | 2 528 | 9,73 | ||||
| 2025-08-15 | 13F | Kestra Advisory Services, LLC | 44 054 | 8,43 | 2 920 | 12,14 | ||||
| 2025-07-15 | 13F | Avaii Wealth Management, Llc | 11 707 | −8,75 | 776 | −5,72 | ||||
| 2025-07-23 | 13F | RiverTree Advisors, LLC | 15 550 | −20,05 | 1 031 | −17,34 | ||||
| 2025-08-08 | 13F | Pnc Financial Services Group, Inc. | 2 464 | 815,99 | 163 | 858,82 | ||||
| 2025-07-30 | 13F | Meadow Creek Wealth Advisors Llc | 13 319 | 6,28 | 883 | 9,84 | ||||
| 2025-08-12 | 13F | LPL Financial LLC | 2 363 387 | 4,56 | 156 645 | 8,15 | ||||
| 2025-08-11 | 13F | Synergy Investment Management, LLC | 0 | −100,00 | 0 | |||||
| 2025-08-12 | 13F | BlackRock, Inc. | 1 455 | −13,85 | 96 | −11,11 | ||||
| 2025-08-14 | 13F | Mariner, LLC | 13 465 | 55,25 | 892 | 60,72 | ||||
| 2025-08-14 | 13F | Comerica Bank | 236 207 | 81,77 | 15 656 | 88,00 | ||||
| 2025-08-06 | 13F | Ethos Financial Group, LLC | 170 099 | 8,83 | 11 274 | 9,61 | ||||
| 2025-07-24 | 13F | Ronald Blue Trust, Inc. | 0 | −100,00 | 0 | |||||
| 2025-07-28 | 13F | WealthPlan Investment Management, LLC | 215 979 | 47,30 | 14 315 | 52,37 | ||||
| 2025-07-29 | 13F | Koshinski Asset Management, Inc. | 56 181 | −1,77 | 3 724 | 1,61 | ||||
| 2025-08-06 | 13F | SOUTH STATE Corp | 0 | −100,00 | 0 | |||||
| 2025-07-18 | 13F | Cooper Financial Group | 17 682 | −4,05 | 1 172 | −0,76 | ||||
| 2025-07-14 | 13F | Sowell Financial Services LLC | 108 047 | 32,09 | 7 161 | 36,63 | ||||
| 2025-08-07 | 13F | Kestra Private Wealth Services, Llc | 17 471 | −36,11 | 1 158 | −33,96 | ||||
| 2025-07-21 | 13F | Ameritas Advisory Services, LLC | 12 748 | −41,80 | 845 | −40,10 | ||||
| 2025-08-14 | 13F | Advisor OS, LLC | 17 782 | 297,45 | 1 179 | 311,89 | ||||
| 2025-07-03 | 13F | City Center Advisors, LLC | 9 831 | −4,22 | 652 | −0,91 | ||||
| 2025-08-07 | 13F | Runnymede Capital Advisors, Inc. | 0 | −100,00 | 0 | −100,00 | ||||
| 2025-07-09 | 13F | FOCUS Wealth Advisors, LLC | 91 696 | 0,62 | 6 078 | 4,08 | ||||
| 2025-08-14 | 13F | Wiley Bros.-aintree Capital, Llc | 0 | −100,00 | 0 | |||||
| 2025-08-14 | 13F | Royal Bank Of Canada | 2 549 033 | 29,37 | 168 950 | 33,81 | ||||
| 2025-07-10 | 13F | Kmg Fiduciary Partners, Llc | 25 308 | −0,51 | 1 677 | 2,88 | ||||
| 2025-07-14 | 13F | Golden State Equity Partners | 17 520 | −2,97 | 1 161 | 0,35 | ||||
| 2025-08-04 | 13F | Pensionmark Financial Group, Llc | 34 076 | −8,11 | 2 259 | −4,97 | ||||
| 2025-08-14 | 13F | Integrated Wealth Concepts LLC | 66 477 | −8,14 | 4 406 | −4,98 | ||||
| 2025-07-18 | 13F | Philip James Wealth Mangement, LLC | 122 878 | 0,19 | 8 144 | 3,63 | ||||
| 2025-08-07 | 13F | Rathbone Brothers plc | 7 901 | 10,97 | 524 | 14,69 | ||||
| 2025-07-17 | 13F | Janney Montgomery Scott LLC | 76 501 | 9,58 | 5 | 25,00 | ||||
| 2025-05-15 | 13F/A | Orion Portfolio Solutions, LLC | 98 311 | −4,44 | 6 300 | −6,96 | ||||
| 2025-07-14 | 13F | GAMMA Investing LLC | 1 357 | 0,00 | 90 | 3,49 | ||||
| 2025-08-06 | 13F | Wedbush Securities Inc | 9 858 | 5,16 | 1 | |||||
| 2025-08-11 | 13F | Cornerstone Planning Group LLC | 218 908 | 9,61 | 14 492 | 16,23 | ||||
| 2025-07-29 | 13F | Balboa Wealth Partners | 9 938 | 189,06 | 659 | 199,09 | ||||
| 2025-08-11 | 13F | Principal Securities, Inc. | 1 061 | 11,10 | 70 | 12,90 | ||||
| 2025-08-01 | 13F | Envestnet Asset Management Inc | 579 756 | 8,55 | 38 426 | 12,28 | ||||
| 2025-08-12 | 13F | Financial Advocates Investment Management | 7 482 | −35,90 | 496 | −33,73 | ||||
| 2025-07-23 | 13F | L.K. Benson & Company, P.C. | 3 791 | 0,00 | 251 | 3,72 | ||||
| 2025-08-07 | 13F | Allworth Financial LP | 2 176 | −12,58 | 144 | −7,69 | ||||
| 2025-07-24 | 13F | Cyndeo Wealth Partners, LLC | 12 964 | 2,34 | 859 | 5,92 | ||||
| 2025-08-12 | 13F | Steward Partners Investment Advisory, Llc | 47 814 | −43,15 | 3 169 | −41,20 | ||||
| 2025-08-13 | 13F | Cerity Partners LLC | 55 304 | 57,66 | 3 666 | 63,11 | ||||
| 2025-07-15 | 13F | Traction Financial Partners, LLC | 3 190 | 211 | ||||||
| 2025-07-24 | 13F | Live Oak Investment Partners | 75 620 | 0,14 | 5 012 | 3,60 | ||||
| 2025-08-07 | 13F | LFA - Lugano Financial Advisors SA | 64 285 | 11,24 | 4 261 | 15,07 | ||||
| 2025-08-12 | 13F | Maripau Wealth Management Llc | 3 313 | −2,47 | 220 | 0,92 | ||||
| 2025-08-01 | 13F | Ashton Thomas Private Wealth, LLC | 16 379 | 24,38 | 1 086 | 28,71 | ||||
| 2025-08-04 | 13F | Flagship Harbor Advisors, Llc | 107 543 | 0,37 | 7 128 | 3,80 | ||||
| 2025-08-12 | 13F | Centric Wealth Management | 135 858 | 0,64 | 9 101 | 5,21 | ||||
| 2025-08-12 | 13F | Calton & Associates, Inc. | 6 224 | 413 | ||||||
| 2025-08-19 | 13F | Advisory Services Network, LLC | 45 373 | 10,60 | 3 029 | 15,22 | ||||
| 2025-08-14 | 13F | Stifel Financial Corp | 310 932 | 0,51 | 20 612 | 3,96 | ||||
| 2025-07-29 | 13F | Stratos Wealth Partners, LTD. | 79 636 | 4,15 | 5 278 | 7,74 | ||||
| 2025-08-18 | 13F | Geneos Wealth Management Inc. | 12 882 | 52,58 | 854 | 57,67 | ||||
| 2025-07-21 | 13F | Matauro, Llc | 4 203 | −8,31 | 279 | −5,12 | ||||
| 2025-05-15 | 13F | Newbridge Financial Services Group, Inc. | 0 | −100,00 | 0 | |||||
| 2025-07-22 | 13F | Simplicity Wealth,LLC | 53 577 | 204,87 | 3 551 | 215,36 | ||||
| 2025-08-14 | 13F | UBS Group AG | 45 863 | −10,81 | 3 040 | −7,77 | ||||
| 2025-08-14 | 13F | Susquehanna International Group, Llp | 0 | −100,00 | 0 | |||||
| 2025-04-22 | 13F | Breakthru Advisory Services, Llc | 0 | −100,00 | 0 | |||||
| 2025-08-12 | 13F | Jpmorgan Chase & Co | 27 654 | −96,47 | 1 833 | −96,35 | ||||
| 2025-08-05 | 13F | Sigma Planning Corp | 48 865 | −23,24 | 3 239 | −20,62 | ||||
| 2025-08-13 | 13F | GeoWealth Management, LLC | 11 319 | −0,60 | 750 | 2,88 | ||||
| 2025-08-01 | 13F | Rossby Financial, LCC | 468 | 0,00 | 31 | 6,90 | ||||
| 2025-07-29 | 13F | Stratos Wealth Advisors, LLC | 25 878 | −0,60 | 1 715 | 2,82 | ||||
| 2025-08-14 | 13F | Harwood Advisory Group, LLC | 35 349 | 21,37 | 2 343 | 22,23 | ||||
| 2025-08-08 | 13F | Crossmark Global Holdings, Inc. | 7 633 | −0,27 | 505 | 3,27 | ||||
| 2025-08-14 | 13F | Benjamin Edwards Inc | 53 779 | 41,00 | 3 564 | 45,83 | ||||
| 2025-07-29 | 13F | Signature Estate & Investment Advisors Llc | 27 988 | −0,04 | 1 855 | 3,40 | ||||
| 2025-08-14 | 13F | Raymond James Financial Inc | 673 403 | 45,19 | 44 633 | 50,17 | ||||
| 2025-08-06 | 13F | First Horizon Advisors, Inc. | 0 | 0 | ||||||
| 2025-08-13 | 13F | SMART Wealth LLC | 20 367 | 7,71 | 1 350 | 11,40 | ||||
| 2025-08-14 | 13F | Chilton Investment Co Llc | 5 196 | 344 | ||||||
| 2025-07-17 | 13F | Oakworth Capital, Inc. | 1 400 | 0,00 | 93 | 3,37 | ||||
| 2025-08-11 | 13F | Amara Financial, Llc. | 5 401 | 0,02 | 358 | 3,18 | ||||
| 2025-07-30 | 13F | TFB Advisors LLC | 7 102 | 26,37 | 471 | 30,56 | ||||
| 2025-07-31 | 13F | Oppenheimer & Co Inc | 52 411 | 11,72 | 3 474 | 15,54 | ||||
| 2025-08-14 | 13F | GWM Advisors LLC | 18 915 | 157,80 | 1 254 | 166,60 | ||||
| 2025-05-16 | 13F | Laidlaw Wealth Management LLC | 0 | −100,00 | 0 | −100,00 | ||||
| 2025-07-17 | 13F | Park Place Capital Corp | 357 | 0,00 | 24 | 4,55 | ||||
| 2025-08-14 | 13F | Wells Fargo & Company/mn | 119 | −64,90 | 8 | −66,67 | ||||
| 2025-08-14 | 13F | IHT Wealth Management, LLC | 14 177 | −50,91 | 940 | −49,24 | ||||
| 2025-07-24 | 13F | MSH Capital Advisors LLC | 22 160 | 1 469 | ||||||
| 2025-08-14 | 13F | Graney & King, LLC | 2 957 | 0,07 | 196 | 3,70 | ||||
| 2025-08-15 | 13F | Captrust Financial Advisors | 75 517 | −4,77 | 5 005 | −1,50 | ||||
| 2025-07-25 | 13F | Envestnet Portfolio Solutions, Inc. | 14 441 | −74,05 | 957 | −73,16 | ||||
| 2025-08-12 | 13F | CIBC Private Wealth Group, LLC | 1 | −97,73 | 0 | −100,00 | ||||
| 2025-08-05 | 13F | Lord & Richards Wealth Management, LLC | 0 | −100,00 | 0 | |||||
| 2025-08-08 | 13F | SBI Securities Co., Ltd. | 327 | −41,50 | 22 | −40,00 | ||||
| 2025-07-29 | 13F | International Assets Investment Management, Llc | 5 268 | −2,10 | 349 | 1,45 | ||||
| 2025-08-15 | 13F | Fsb Premier Wealth Management, Inc. | 5 966 | 11,37 | 395 | 15,16 | ||||
| 2025-07-15 | 13F | Armis Advisers, LLC | 79 182 | 1,35 | 5 248 | 4,83 | ||||
| 2025-08-11 | 13F | TD Waterhouse Canada Inc. | 3 263 | 0,00 | 215 | 3,37 | ||||
| 2025-08-14 | 13F | Hilltop Holdings Inc. | 7 659 | 1,69 | 508 | 5,19 | ||||
| 2025-07-25 | 13F | Apollon Wealth Management, LLC | 28 428 | −0,36 | 1 884 | 3,06 | ||||
| 2025-05-12 | 13F | Owen LaRue, LLC | 0 | −100,00 | 0 | |||||
| 2025-07-22 | 13F | Belpointe Asset Management LLC | 59 150 | −13,14 | 3 921 | −10,15 | ||||
| 2025-08-14 | 13F | Quantinno Capital Management LP | 5 192 | 344 | ||||||
| 2025-08-13 | 13F | Virtue Capital Management, LLC | 0 | −100,00 | 0 | |||||
| 2025-07-14 | 13F | Iams Wealth Management, Llc | 8 658 | −11,33 | 574 | −8,32 | ||||
| 2025-08-13 | 13F | WCG Wealth Advisors LLC | 12 272 | −6,01 | 813 | −2,75 | ||||
| 2025-07-22 | 13F | Wealthcare Advisory Partners LLC | 3 192 | 212 | ||||||
| 2025-05-01 | 13F | Stephens Inc /ar/ | 0 | −100,00 | 0 | −100,00 | ||||
| 2025-07-30 | 13F | Fairway Wealth LLC | 28 575 | 0,28 | 1 894 | 3,73 | ||||
| 2025-08-05 | 13F | GPS Wealth Strategies Group, LLC | 213 | −99,70 | 14 | −99,70 | ||||
| 2025-08-28 | NP | TFAQX - TFA Quantitative Fund Class I | 25 000 | 96,85 | 1 657 | 103,81 | ||||
| 2025-07-25 | NP | LALT - First Trust Multi-Strategy Alternative ETF | 64 462 | 25,50 | 4 224 | 23,80 | ||||
| 2025-07-21 | 13F | Ameriflex Group, Inc. | 0 | −100,00 | 0 | |||||
| 2025-08-11 | 13F | Western Wealth Management, LLC | 7 468 | 0,04 | 495 | 3,35 | ||||
| 2025-08-08 | 13F | Beacon Harbor Wealth Advisors, Inc. | 0 | −100,00 | 0 | |||||
| 2025-08-08 | 13F | Cetera Investment Advisers | 631 308 | 7,58 | 41 843 | 11,27 | ||||
| 2025-07-28 | 13F | WealthPLAN Partners, LLC | 101 265 | −39,40 | 6 712 | −37,32 | ||||
| 2025-08-05 | 13F | Optivise Advisory Services LLC | 4 122 | −0,02 | 273 | 3,41 | ||||
| 2025-08-06 | 13F | Golden State Wealth Management, LLC | 70 501 | −1,30 | 4 673 | 2,08 | ||||
| 2025-08-12 | 13F | Richmond Investment Services, LLC | 39 513 | 105,68 | 2 619 | 112,67 | ||||
| 2025-07-31 | 13F | Cambridge Investment Research Advisors, Inc. | 240 105 | 9,76 | 16 | 7,14 | ||||
| 2025-05-12 | 13F | American Alpha Advisors, LLC | 0 | −100,00 | 0 | −100,00 | ||||
| 2025-08-13 | 13F | Plan Group Financial, LLC | 3 472 | 0,00 | 230 | 3,60 | ||||
| 2025-07-17 | 13F | Wagner Wealth Management, Llc | 21 | −58,82 | 1 | −66,67 | ||||
| 2025-07-22 | 13F | DAVENPORT & Co LLC | 4 653 | −2,62 | 308 | 0,65 | ||||
| 2025-08-04 | 13F | IFG Advisory, LLC | 5 623 | 0,07 | 373 | 3,33 | ||||
| 2025-08-27 | 13F/A | Brinker Capital Investments, LLC | 89 340 | −9,13 | 5 921 | −6,00 | ||||
| 2025-07-29 | 13F | Crux Wealth Advisors | 9 268 | 25,68 | 614 | 30,08 | ||||
| 2025-08-08 | 13F | Avantax Advisory Services, Inc. | 68 886 | −5,77 | 4 566 | −2,54 | ||||
| 2025-08-14 | 13F | Bank Of America Corp /de/ | 10 494 | 578,78 | 696 | 602,02 | ||||
| 2025-07-18 | 13F | Provident Wealth Management, LLC | 8 810 | −11,31 | 584 | −8,33 | ||||
| 2025-08-05 | 13F | Carolinas Wealth Consulting Llc | 0 | −100,00 | 0 | −100,00 | ||||
| 2025-08-08 | 13F | Larson Financial Group LLC | 728 | 0,41 | 48 | 4,35 | ||||
| 2025-07-31 | 13F | Sage Mountain Advisors LLC | 3 040 | 201 | ||||||
| 2025-07-17 | 13F | Fifth Third Securities, Inc. | 7 625 | 505 | ||||||
| 2025-07-17 | 13F | Sound Income Strategies, LLC | 0 | −100,00 | 0 | |||||
| 2025-08-06 | 13F | Quadrant Private Wealth Management, LLC | 0 | −100,00 | 0 | |||||
| 2025-07-23 | 13F | Morey & Quinn Wealth Partners, LLC | 4 769 | 0,00 | 316 | 3,61 | ||||
| 2025-08-08 | 13F | Kingsview Wealth Management, LLC | 56 770 | 12,86 | 3 763 | 16,72 | ||||
| 2025-08-07 | 13F | Legacy Financial Advisors, Inc. | 41 250 | 2 734 | ||||||
| 2025-08-12 | 13F | Wood Tarver Financial Group, LLC | 4 592 | 0 | ||||||
| 2025-08-06 | 13F | AE Wealth Management LLC | 12 518 | −26,24 | 830 | −23,74 | ||||
| 2025-05-12 | 13F | Independent Advisor Alliance | 0 | −100,00 | 0 | |||||
| 2025-08-14 | 13F | CoreCap Advisors, LLC | 801 | 46,44 | 53 | 51,43 | ||||
| 2025-08-13 | 13F | EverSource Wealth Advisors, LLC | 265 | 126,50 | 18 | 142,86 | ||||
| 2025-08-19 | 13F | National Asset Management, Inc. | 28 218 | −7,24 | 1 870 | −6,55 | ||||
| 2025-05-09 | 13F | Cary Street Partners Financial Llc | 0 | −100,00 | 0 | |||||
| 2025-07-30 | 13F | Patten Group, Inc. | 29 687 | −3,93 | 1 968 | −0,66 | ||||
| 2025-08-15 | 13F | First Heartland Consultants, Inc. | 9 927 | 9,12 | 658 | 12,89 | ||||
| 2025-07-08 | 13F | Nbc Securities, Inc. | 6 108 | 660,65 | 0 | |||||
| 2025-07-31 | 13F | Moloney Securities Asset Management, LLC | 11 246 | 0,74 | 745 | 4,20 | ||||
| 2025-08-06 | 13F | Moors & Cabot, Inc. | 6 418 | 19,21 | 425 | 23,19 | ||||
| 2025-07-22 | 13F | Merit Financial Group, LLC | 30 707 | 2 035 | ||||||
| 2025-08-12 | 13F | Proequities, Inc. | 0 | 0 | ||||||
| 2025-08-14 | 13F | Modern Wealth Management, LLC | 18 581 | −85,77 | 1 232 | −85,28 | ||||
| 2025-05-01 | 13F | Grant/GrossMendelsohn, LLC | 4 936 | −29,10 | 312 | −31,88 | ||||
| 2025-08-04 | 13F | Assetmark, Inc | 74 147 | 3,14 | 4 914 | 6,69 | ||||
| 2025-07-29 | 13F | Private Trust Co Na | 3 581 | 10,18 | 237 | 13,94 | ||||
| 2025-07-25 | 13F | Atria Wealth Solutions, Inc. | 12 318 | −69,25 | 816 | −68,20 | ||||
| 2025-08-12 | 13F | Gladstone Institutional Advisory LLC | 3 626 | 4,65 | 240 | 8,11 | ||||
| 2025-07-18 | 13F | Truist Financial Corp | 427 431 | 1,29 | 28 330 | 4,77 | ||||
| 2025-08-18 | 13F/A | National Bank Of Canada /fi/ | 1 305 | 0,00 | 86 | 3,61 | ||||
| 2025-07-14 | 13F | U.S. Capital Wealth Advisors, LLC | 21 631 | 0,32 | 1 434 | 3,77 | ||||
| 2025-07-28 | 13F | BRYN MAWR TRUST Co | 1 834 | 54,90 | 122 | 61,33 | ||||
| 2025-07-24 | 13F | IFP Advisors, Inc | 25 340 | 5,60 | 1 680 | 9,24 | ||||
| 2025-08-14 | 13F | Sunbelt Securities, Inc. | 187 | 12 | ||||||
| 2025-04-11 | 13F | Insight Advisors, LLC/ PA | 0 | −100,00 | 0 | |||||
| 2025-08-14 | 13F | Jane Street Group, Llc | 7 585 | −69,26 | 503 | −68,25 | ||||
| 2025-08-01 | 13F | Transcend Wealth Collective, Llc | 0 | −100,00 | 0 | |||||
| 2025-08-13 | 13F | Transce3nd, LLC | 129 | 3 125,00 | 9 | |||||
| 2025-08-12 | 13F | Change Path, LLC | 61 952 | 3,37 | 4 106 | 6,93 | ||||
| 2025-04-29 | 13F | Onyx Bridge Wealth Group LLC | 0 | −100,00 | 0 | |||||
| 2025-07-14 | 13F | Financial Enhancement Group LLC | 116 993 | −50,59 | 7 699 | −47,65 | ||||
| 2025-07-16 | 13F/A | CX Institutional | 623 | −1,74 | 0 | |||||
| 2025-05-06 | 13F | Rsm Us Wealth Management Llc | 0 | −100,00 | 0 | |||||
| 2025-07-31 | 13F | Hobart Private Capital, LLC | 307 223 | 0,98 | 20 363 | 4,45 | ||||
| 2025-08-04 | 13F | Creekmur Asset Management LLC | 402 | 27 | ||||||
| 2025-08-05 | 13F | Bank of New York Mellon Corp | 22 934 | 2,75 | 1 520 | 6,29 | ||||
| 2025-08-11 | 13F | NewEdge Wealth, LLC | 8 302 | 6,42 | 550 | 10,22 | ||||
| 2025-08-13 | 13F | StoneX Group Inc. | 11 896 | 2,97 | 788 | 6,49 | ||||
| 2025-08-06 | 13F | Prospera Financial Services Inc | 14 912 | −1,38 | 989 | 1,96 | ||||
| 2025-05-16 | 13F/A | Kestra Investment Management, LLC | 0 | −100,00 | 0 | |||||
| 2025-08-13 | 13F | Capital Analysts, Inc. | 4 938 | −1,65 | 0 | |||||
| 2025-08-11 | 13F | Lcnb Corp | 46 211 | −6,62 | 3 063 | −3,41 | ||||
| 2025-07-11 | 13F | Farther Finance Advisors, LLC | 467 | 455,95 | 31 | 500,00 | ||||
| 2025-09-04 | 13F/A | Advisor Group Holdings, Inc. | 218 598 | 8,10 | 14 485 | 11,76 | ||||
| 2025-08-15 | 13F | Asset Allocation Strategies LLC | 36 827 | 16,82 | 2 441 | 20,79 | ||||
| 2025-05-15 | 13F | Creative Planning | 0 | −100,00 | 0 | |||||
| 2025-08-11 | 13F | United Advisor Group, LLC | 4 238 | 1,51 | 281 | 4,87 | ||||
| 2025-07-31 | 13F | Stegent Equity Advisors, Inc. | 61 093 | −2,13 | 4 049 | 1,25 | ||||
| 2025-07-07 | 13F | Thurston, Springer, Miller, Herd & Titak, Inc. | 237 | 16 | ||||||
| 2025-08-08 | 13F | Citizens Financial Group Inc/ri | 20 774 | −47,43 | 1 377 | −45,66 | ||||
| 2025-08-14 | 13F | Colony Group, LLC | 18 216 | −20,47 | 1 207 | −17,72 | ||||
| 2025-08-20 | 13F/A | Coppell Advisory Solutions LLC | 116 591 | 29,85 | 7 699 | 35,60 | ||||
| 2025-08-15 | 13F | Equitable Holdings, Inc. | 68 334 | 11,43 | 4 529 | 15,27 | ||||
| 2025-07-07 | 13F | Nova Wealth Management, Inc. | 189 | 13 | ||||||
| 2025-08-14 | 13F | Warren Averett Asset Management, LLC | 3 636 | −33,91 | 241 | −31,82 | ||||
| 2025-07-15 | 13F | World Equity Group, Inc. | 261 966 | 10,37 | 17 363 | 14,16 | ||||
| 2025-08-07 | 13F | Resources Investment Advisors, LLC. | 12 673 | −14,15 | 840 | −11,22 | ||||
| 2025-08-12 | 13F | MAI Capital Management | 134 | 0,75 | 9 | 0,00 | ||||
| 2025-04-21 | 13F | O'Dell Group, LLC | 0 | −100,00 | 0 | |||||
| 2025-05-08 | 13F | Heritage Wealth Advisors | 0 | −100,00 | 0 | |||||
| 2025-08-13 | 13F | Maia Wealth LLC | 25 311 | 20,07 | 1 678 | 27,33 | ||||
| 2025-08-14 | 13F | Pinnacle Family Advisors, LLC | 4 037 | 10,09 | 268 | 14,10 | ||||
| 2025-08-12 | 13F | Global Retirement Partners, LLC | 35 789 | 46,95 | 2 372 | 48,06 | ||||
| 2025-08-11 | 13F | HighTower Advisors, LLC | 186 486 | −8,35 | 12 360 | −5,20 | ||||
| 2025-08-08 | 13F | Comprehensive Financial Planning, Inc./PA | 512 | −0,58 | 34 | 0,00 | ||||
| 2025-08-13 | 13F | First Trust Advisors Lp | 67 002 | −7,18 | 4 441 | −4,00 | ||||
| 2025-07-28 | 13F | Harbour Investments, Inc. | 98 714 | 28,17 | 6 543 | 32,56 | ||||
| 2025-08-14 | 13F | Ausdal Financial Partners, Inc. | 50 795 | 8,30 | 3 367 | 12,01 | ||||
| 2025-07-11 | 13F | SILVER OAK SECURITIES, Inc | 18 405 | 0,12 | 1 220 | 4,55 | ||||
| 2025-08-14 | 13F | Ameriprise Financial Inc | 2 417 461 | 10,57 | 160 161 | 14,31 | ||||
| 2025-07-25 | 13F | Cwm, Llc | 186 296 | −2,42 | 12 | 0,00 | ||||
| 2025-07-31 | 13F | Cardinal Point Capital Management, ULC | 118 969 | −4,18 | 7 885 | −0,89 | ||||
| 2025-08-01 | 13F | Brookwood Investment Group LLC | 12 268 | 8,56 | 813 | 12,29 | ||||
| 2025-04-29 | 13F | Pure Portfolios Holdings Llc | 0 | −100,00 | 0 | |||||
| 2025-08-11 | 13F | Private Advisor Group, LLC | 126 301 | −16,47 | 8 371 | −13,60 | ||||
| 2025-07-16 | 13F | Twelve Points Wealth Management LLC | 11 988 | 6,54 | 795 | 10,12 | ||||
| 2025-07-30 | 13F | IMG Wealth Management, Inc. | 71 719 | 9,40 | 4 754 | 13,17 | ||||
| 2025-08-13 | 13F | Northwestern Mutual Wealth Management Co | 82 | 0,00 | 5 | 0,00 | ||||
| 2025-07-15 | 13F | Oregon Pacific Wealth Management, LLC | 31 834 | −3,45 | 2 110 | −0,14 | ||||
| 2025-07-09 | 13F | Dynamic Advisor Solutions LLC | 29 626 | 19,69 | 1 964 | 23,77 | ||||
| 2025-08-14 | 13F | Mml Investors Services, Llc | 85 539 | 8,84 | 6 | 0,00 | ||||
| 2025-08-14 | 13F | Acas, Llc | 50 045 | −1,47 | 3 379 | 4,39 | ||||
| 2025-08-12 | 13F | Viawealth, Llc | 70 396 | −10,69 | 4 666 | −7,62 | ||||
| 2025-08-13 | 13F | Legacy Capital Wealth Partners, LLC | 14 105 | −4,82 | 935 | −1,58 | ||||
| 2025-08-06 | 13F | Commonwealth Equity Services, Llc | 93 521 | −23,14 | 6 | −14,29 | ||||
| 2025-07-15 | 13F | Revisor Wealth Management LLC | 5 659 | 374 | ||||||
| 2025-08-07 | 13F | Brio Consultants, LLC | 84 485 | −2,74 | 5 600 | 0,59 | ||||
| 2025-08-14 | 13F | Atomi Financial Group, Inc. | 167 359 | 0,71 | 11 093 | 4,17 | ||||
| 2025-07-10 | 13F | Signal Advisors Wealth, LLC | 16 407 | 22,25 | 1 087 | 26,40 | ||||
| 2025-08-11 | 13F | Rothschild Investment Llc | 12 728 | 0,00 | 844 | 3,44 | ||||
| 2025-08-29 | NP | COIDX - IDX Commodity Opportunities Fund Institutional Class Shares | 7 500 | 497 | ||||||
| 2025-07-28 | 13F | RFG Advisory, LLC | 25 948 | 610,13 | 1 720 | 634,62 | ||||
| 2025-08-07 | 13F | CENTRAL TRUST Co | 414 753 | 12,05 | 27 490 | 15,90 | ||||
| 2025-08-11 | 13F | Lake Street Financial Llc | 8 496 | 563 | ||||||
| 2025-08-12 | 13F | O'shaughnessy Asset Management, Llc | 0 | −100,00 | 0 | |||||
| 2025-04-17 | 13F | Authentikos Wealth Advisory, LLC | 0 | −100,00 | 0 | |||||
| 2025-08-07 | 13F | PFG Advisors | 16 965 | 14,21 | 1 124 | 18,19 | ||||
| 2025-07-24 | 13F | Us Bancorp \de\ | 1 145 | 21,04 | 76 | 25,00 | ||||
| 2025-08-12 | 13F | SRS Capital Advisors, Inc. | 17 926 | −0,05 | 1 188 | 3,39 | ||||
| 2025-07-07 | 13F | Global Wealth Strategies & Associates | 16 553 | −7,43 | 1 097 | −4,19 | ||||
| 2025-07-25 | 13F | Concurrent Investment Advisors, LLC | 12 953 | −35,43 | 859 | −33,23 | ||||
| 2025-08-04 | 13F | Atria Investments Llc | 12 087 | 6,35 | 801 | 10,03 | ||||
| 2025-07-30 | 13F | Parcion Private Wealth LLC | 16 182 | 10,59 | 1 073 | 14,41 | ||||
| 2025-08-14 | 13F | LaSalle St. Investment Advisors, LLC | 24 158 | 1,86 | 2 | 0,00 | ||||
| 2025-07-09 | 13F | Reyes Financial Architecture, Inc. | 4 168 | −31,90 | 276 | −29,59 | ||||
| 2025-04-29 | 13F | Brookstone Capital Management | 0 | −100,00 | 0 | |||||
| 2025-07-10 | 13F | Wealth Enhancement Advisory Services, Llc | 67 518 | −0,61 | 4 476 | 2,85 | ||||
| 2025-08-05 | 13F | Strategic Financial Concepts, LLC | 0 | −100,00 | 0 | |||||
| 2025-08-13 | 13F | Proactive Wealth Strategies LLC | 87 093 | 2,96 | 6 | 0,00 | ||||
| 2025-07-23 | 13F | Kingswood Wealth Advisors, Llc | 67 929 | 8,12 | 4 502 | 11,82 | ||||
| 2025-08-14 | 13F/A | Rockefeller Capital Management L.P. | 25 735 | 20,49 | 1 706 | 24,63 | ||||
| 2025-08-05 | 13F | Bank Of Montreal /can/ | 5 786 | 11,29 | 384 | 15,02 | ||||
| 2025-05-15 | 13F | Concorde Asset Management, LLC | 7 482 | 10,24 | 469 | 5,16 | ||||
| 2025-08-07 | 13F | Vise Technologies, Inc. | 13 848 | 104,19 | 918 | 105,61 | ||||
| 2025-08-13 | 13F | Mount Yale Investment Advisors, LLC | 0 | −100,00 | 0 | |||||
| 2025-08-13 | 13F | Gateway Wealth Partners, LLC | 29 892 | −10,75 | 1 981 | −7,69 |