Grunnleggende statistikk
| Institusjonelle eiere | 192 total, 192 long only, 0 short only, 0 long/short - change of 3,78% MRQ |
| Gjennomsnittlig porteføljeallokering | 0.1849 % - change of −31,32% MRQ |
| Institusjonelle aksjer (Long) | 6 418 265 (ex 13D/G) - change of −0,27MM shares −4,03% MRQ |
| Institusjonell verdi (Long) | $ 706 727 USD ($1000) |
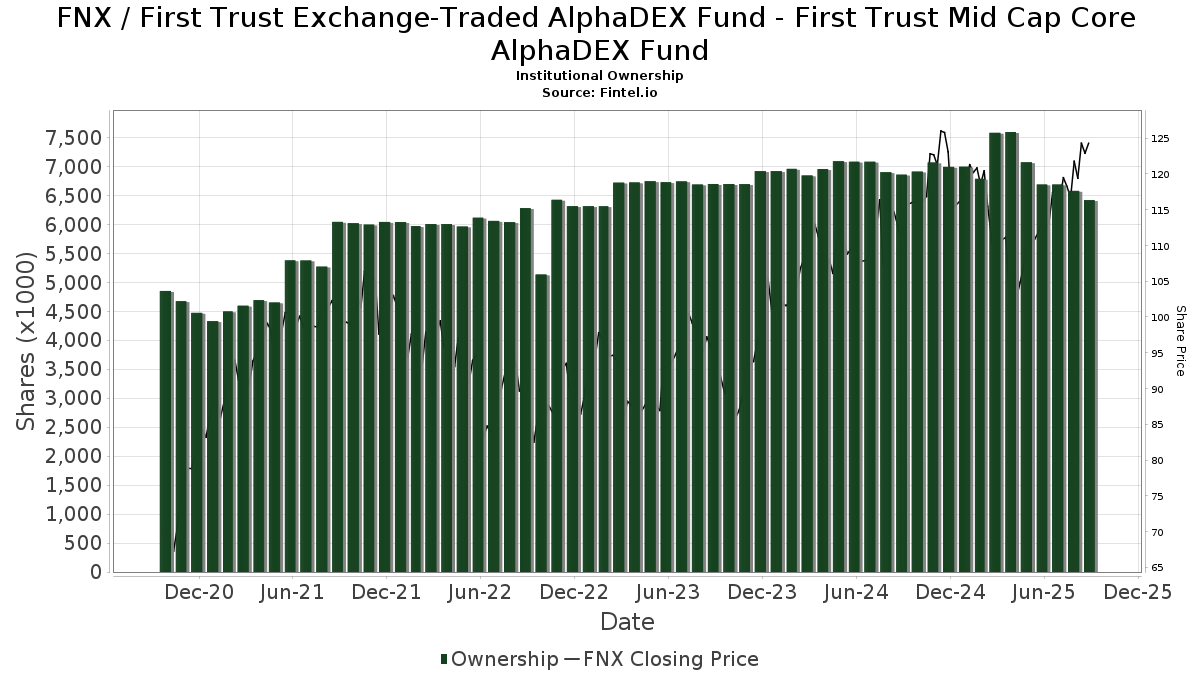
Institusjonelt eierskap og aksjonærer
First Trust Exchange-Traded AlphaDEX Fund - First Trust Mid Cap Core AlphaDEX Fund (US:FNX) har 192 institusjonelle eiere og aksjonærer som har sendt inn 13D/G- eller 13F-skjemaer til Securities Exchange Commission (SEC). Disse institusjonene eier til sammen 6,418,265 aksjer. De største aksjonærene inkluderer Morgan Stanley, LPL Financial LLC, Wells Fargo & Company/mn, Raymond James Financial Inc, Royal Bank Of Canada, UBS Group AG, Baird Financial Group, Inc., Cetera Investment Advisers, HighTower Advisors, LLC, and Three Cord True Wealth Management, LLC .
First Trust Exchange-Traded AlphaDEX Fund - First Trust Mid Cap Core AlphaDEX Fund (NasdaqGM:FNX) institusjonell eierstruktur viser nåværende posisjoner i selskapet fordelt på institusjoner og fond, samt de siste endringene i posisjonsstørrelse. De største aksjonærene kan være individuelle investorer, verdipapirfond, hedgefond eller institusjoner. Schedule 13D indikerer at investoren eier (eller har eid) mer enn 5 % av selskapet og har til hensikt (eller hadde til hensikt) å aktivt forfølge en endring i forretningsstrategien. Schedule 13G indikerer en passiv investering på over 5 %.
The share price as of September 11, 2025 is 126,44 / share. Previously, on September 12, 2024, the share price was 111,42 / share. This represents an increase of 13,48% over that period.
Fondssentiment-score
Fondssentiment Score (også kjent som akkumulering av eierskap poengsum) viser hvilke aksjer som er mest kjøpt av fond. Den er resultatet av en sofistikert, kvantitativ flerfaktormodell som identifiserer selskaper med de høyeste nivåene av institusjonell akkumulering. Beregningsmodellen for poeng bruker en kombinasjon av den totale økningen i antall offentliggjorte eiere, endringer i porteføljeallokeringen til disse eierne og andre beregninger. Tallet går fra 0 til 100, der høyere tall indikerer en høyere grad av akkumulering i forhold til sammenlignbare selskaper, der 50 er gjennomsnittet.
Oppdateringsfrekvens: Daglig
Sjekk ut Ownership Explorer, som inneholder en liste over de høyest rangerte selskapene.
Institusjonell Put/Call-forhold
I tillegg til å rapportere standard aksje- og gjeldsemisjoner må institusjoner med mer enn 100 millioner kroner i forvaltningskapital også oppgi beholdningen av put- og callopsjoner. Siden put-opsjoner generelt indikerer et negativt sentiment, og call-opsjoner indikerer et positivt sentiment, kan vi få et inntrykk av det generelle institusjonelle sentimentet ved å plotte forholdet mellom put- og call-opsjoner. Diagrammet til høyre viser det historiske forholdet mellom put- og call-opsjoner for dette instrumentet.
Ved å bruke Put/Call-forholdet som en indikator på investorsentimentet kan man overvinne en av de viktigste svakhetene ved å bruke totalt institusjonelt eierskap, nemlig at en betydelig andel av forvaltningskapitalen investeres passivt for å følge indekser. Passivt forvaltede fond kjøper vanligvis ikke opsjoner, slik at indikatoren for put/call-forhold i større grad gjenspeiler stemningen i aktivt forvaltede fond.

13F- og NPORT-arkiveringer
Detaljer om 13F-arkiveringer er gratis. Detaljer om NP-arkiveringer krever et premium-medlemskap. Grønne rader indikerer nye posisjoner. Røde rader indikerer lukkede posisjoner. Klikk på lenke ikonet for å se hele transaksjonshistorikken.
Oppgrader
for å låse opp premiedata og eksportere til Excel. ![]() .
.
| Fildato | Kilde | Investor | Type | Gjennomsnittlig pris (estimert) |
Aksjer | Δ Aksjer (%) |
Rapportert verdi ($1000) | Verdi (%) | Portallokering (%) | |
|---|---|---|---|---|---|---|---|---|---|---|
| 2025-08-14 | 13F | Goldman Sachs Group Inc | 6 663 | 765 | ||||||
| 2025-07-29 | 13F | Empirical Asset Management, LLC | 14 716 | 1,48 | 1 690 | 6,96 | ||||
| 2025-07-16 | 13F | Perigon Wealth Management, LLC | 16 882 | −0,59 | 1 939 | 4,76 | ||||
| 2025-07-01 | 13F | Park National Corp /oh/ | 10 919 | 0,83 | 1 254 | 6,27 | ||||
| 2025-08-06 | 13F | Wedbush Securities Inc | 2 109 | −0,19 | 0 | |||||
| 2025-08-06 | 13F | Commonwealth Equity Services, Llc | 69 240 | −1,55 | 8 | 0,00 | ||||
| 2025-08-15 | 13F | Truefg, Llc | 2 315 | 266 | ||||||
| 2025-08-07 | 13F | Cahill Financial Advisors Inc | 1 970 | 0,00 | 226 | 5,61 | ||||
| 2025-08-05 | 13F | American Institute for Advanced Investment Management, LLP | 1 755 | −46,49 | 202 | −43,70 | ||||
| 2025-08-11 | 13F | Citigroup Inc | 742 | 0,00 | 85 | 6,25 | ||||
| 2025-08-11 | 13F | Nations Financial Group Inc, /ia/ /adv | 3 204 | −1,51 | 368 | 3,67 | ||||
| 2025-04-29 | 13F | Resources Investment Advisors, LLC. | 0 | −100,00 | 0 | −100,00 | ||||
| 2025-08-05 | 13F | Fortress Wealth Group, LLC | 38 247 | −4,18 | 4 464 | 5,91 | ||||
| 2025-08-11 | 13F | Principal Securities, Inc. | 1 012 | −1,46 | 116 | −1,69 | ||||
| 2025-08-29 | 13F | Centaurus Financial, Inc. | 1 776 | 12,33 | 0 | |||||
| 2025-07-15 | 13F | Mather Group, Llc. | 0 | −100,00 | 0 | |||||
| 2025-07-09 | 13F | Keystone Wealth Services, LLC | 8 187 | −2,22 | 940 | 3,07 | ||||
| 2025-07-28 | 13F | RFG Advisory, LLC | 2 879 | −1,34 | 331 | 3,77 | ||||
| 2025-07-30 | 13F/A | KPP Advisory Services LLC | 3 463 | 0,00 | 398 | 5,31 | ||||
| 2025-07-18 | 13F | Pure Financial Advisors, Inc. | 2 105 | 2,09 | 242 | 7,59 | ||||
| 2025-08-07 | 13F | PFG Advisors | 5 364 | −2,28 | 616 | 3,01 | ||||
| 2025-08-14 | 13F | Integrated Wealth Concepts LLC | 1 896 | 218 | ||||||
| 2025-05-12 | 13F | Virtu Financial LLC | 0 | −100,00 | 0 | |||||
| 2025-07-14 | 13F | ABLE Financial Group, LLC | 0 | −100,00 | 0 | |||||
| 2025-05-12 | 13F | Independent Advisor Alliance | 0 | −100,00 | 0 | |||||
| 2025-05-14 | 13F | Flow Traders U.s. Llc | 0 | −100,00 | 0 | |||||
| 2025-08-14 | 13F | Old Mission Capital Llc | 5 053 | 580 | ||||||
| 2025-08-12 | 13F | Bedel Financial Consulting, Inc. | 16 900 | 0,00 | 1 941 | 7,54 | ||||
| 2025-07-03 | 13F | Higgins & Schmidt Wealth Strategies LLC | 4 804 | −2,16 | 552 | 2,99 | ||||
| 2025-08-14 | 13F | Financial Advisory Service, Inc. | 2 171 | −0,69 | 249 | 4,62 | ||||
| 2025-08-14 | 13F | IHT Wealth Management, LLC | 4 328 | −12,21 | 497 | −7,45 | ||||
| 2025-08-04 | 13F | Atria Investments Llc | 9 800 | −77,40 | 1 126 | −76,19 | ||||
| 2025-08-13 | 13F | Per Stirling Capital Management, LLC. | 41 839 | −35,60 | 4 805 | −32,13 | ||||
| 2025-08-14 | 13F | Mariner, LLC | 3 709 | −6,20 | 426 | −1,16 | ||||
| 2025-07-17 | 13F | Janney Montgomery Scott LLC | 48 931 | −6,39 | 6 | 0,00 | ||||
| 2025-08-13 | 13F | Northwestern Mutual Wealth Management Co | 56 553 | 18,44 | 6 495 | 24,83 | ||||
| 2025-07-17 | 13F | Sound Income Strategies, LLC | 0 | −100,00 | 0 | |||||
| 2025-07-17 | 13F | City Holding Co | 825 | 0,00 | 95 | 5,62 | ||||
| 2025-08-07 | 13F | Rathbone Brothers plc | 5 384 | −2,18 | 618 | 3,17 | ||||
| 2025-09-04 | 13F/A | Advisor Group Holdings, Inc. | 94 332 | −3,11 | 10 836 | 2,11 | ||||
| 2025-08-06 | 13F | Paladin Advisory Group, LLC | 31 | 4 | ||||||
| 2025-07-31 | 13F | Brinker Capital Investments, LLC | 0 | −100,00 | 0 | −100,00 | ||||
| 2025-08-12 | 13F | Quantum Private Wealth, LLC | 3 355 | 0,00 | 385 | 5,48 | ||||
| 2025-08-07 | 13F | Kestra Private Wealth Services, Llc | 42 671 | 6,86 | 4 901 | 12,62 | ||||
| 2025-05-05 | 13F | Lindbrook Capital, Llc | 275 | 0,00 | 30 | −6,45 | ||||
| 2025-07-29 | 13F | AssuredPartners Investment Advisors, LLC | 11 736 | −90,02 | 1 348 | −89,49 | ||||
| 2025-07-22 | 13F | Woodmont Investment Counsel Llc | 6 007 | 15,08 | 690 | 21,30 | ||||
| 2025-08-12 | 13F/A | Cozad Asset Management Inc | 14 414 | −0,82 | 1 655 | 4,55 | ||||
| 2025-08-14 | 13F | Comerica Bank | 19 256 | −0,95 | 2 212 | 4,39 | ||||
| 2025-08-12 | 13F | LPL Financial LLC | 914 162 | 0,26 | 104 991 | 5,66 | ||||
| 2025-07-17 | 13F | Sterling Investment Advisors, Ltd. | 10 195 | 0,00 | 1 171 | 5,31 | ||||
| 2025-07-23 | 13F | BankPlus Trust Department | 290 | 0,00 | 33 | 6,45 | ||||
| 2025-07-11 | 13F | Pinnacle Bancorp, Inc. | 100 | 0,00 | 11 | 10,00 | ||||
| 2025-07-22 | 13F | McElhenny Sheffield Capital Management, LLC | 51 000 | 51 | ||||||
| 2025-07-29 | 13F | Salomon & Ludwin, LLC | 90 | 0,00 | 11 | 11,11 | ||||
| 2025-08-08 | 13F | Intrua Financial, LLC | 1 866 | −2,81 | 214 | 2,39 | ||||
| 2025-08-13 | 13F | Luminist Capital LLC | 53 | 0,00 | 6 | 20,00 | ||||
| 2025-08-07 | 13F | Lakeridge Wealth Management LLC | 79 719 | 6,39 | 9 156 | 12,12 | ||||
| 2025-08-11 | 13F | Western Wealth Management, LLC | 36 555 | 4,21 | 4 198 | 9,84 | ||||
| 2025-07-25 | 13F | Priebe Wealth Holdings LLC | 8 459 | −53,09 | 972 | −50,59 | ||||
| 2025-08-15 | 13F | Kestra Advisory Services, LLC | 72 545 | −62,25 | 8 332 | −60,22 | ||||
| 2025-08-14 | 13F | Mpwm Advisory Solutions, Llc | 1 555 | 179 | ||||||
| 2025-08-14 | 13F | Marshall Investment Management, Llc | 0 | −100,00 | 0 | |||||
| 2025-08-14 | 13F | Fmr Llc | 4 921 | 37,73 | 565 | 45,24 | ||||
| 2025-08-14 | 13F | Potentia Wealth | 8 253 | −20,96 | 948 | −16,71 | ||||
| 2025-07-31 | 13F | Oppenheimer & Co Inc | 15 099 | −0,12 | 1 734 | 5,28 | ||||
| 2025-07-15 | 13F | LVZ Advisors, Inc. | 16 275 | 0,75 | 1 869 | 6,19 | ||||
| 2025-08-13 | 13F | MONECO Advisors, LLC | 3 854 | −13,86 | 443 | −9,24 | ||||
| 2025-08-05 | 13F | Sigma Planning Corp | 1 857 | −27,86 | 213 | −23,93 | ||||
| 2025-08-14 | 13F | Sunbelt Securities, Inc. | 204 | −0,49 | 24 | 4,55 | ||||
| 2025-08-13 | 13F | EverSource Wealth Advisors, LLC | 12 | 0,00 | 1 | 0,00 | ||||
| 2025-08-14 | 13F | Transamerica Financial Advisors, Inc. | 78 | 0,00 | 9 | |||||
| 2025-08-08 | 13F | Pnc Financial Services Group, Inc. | 3 365 | 0,18 | 387 | 5,46 | ||||
| 2025-07-25 | 13F | M3 Advisory Group, LLC | 1 939 | −1,57 | 223 | 3,74 | ||||
| 2025-04-29 | 13F | Hm Payson & Co | 1 737 | −22,35 | 189 | −26,74 | ||||
| 2025-08-12 | 13F | Steward Partners Investment Advisory, Llc | 5 586 | −1,69 | 642 | 3,55 | ||||
| 2025-08-01 | 13F | Envestnet Asset Management Inc | 17 025 | −13,31 | 1 955 | −8,64 | ||||
| 2025-07-22 | 13F | Belpointe Asset Management LLC | 3 391 | 0,00 | 389 | 5,42 | ||||
| 2025-05-02 | 13F | Cullen/frost Bankers, Inc. | 0 | −100,00 | 0 | |||||
| 2025-08-14 | 13F | Snowden Capital Advisors LLC | 20 799 | −0,18 | 2 389 | 5,20 | ||||
| 2025-08-14 | 13F | GWM Advisors LLC | 10 010 | −0,87 | 1 150 | 4,45 | ||||
| 2025-07-21 | 13F | Ameritas Advisory Services, LLC | 1 618 | −32,13 | 186 | −32,73 | ||||
| 2025-08-08 | 13F | Condor Capital Management | 2 918 | 0,00 | 335 | 5,35 | ||||
| 2025-07-15 | 13F | Farrell Financial LLC | 1 778 | 204 | ||||||
| 2025-07-29 | 13F | Chicago Partners Investment Group LLC | 59 810 | −0,67 | 7 146 | 10,74 | ||||
| 2025-07-23 | 13F | Element Wealth, LLC | 3 071 | 0,00 | 353 | 5,39 | ||||
| 2025-07-31 | 13F | Cambridge Investment Research Advisors, Inc. | 53 200 | −5,64 | 6 | 0,00 | ||||
| 2025-08-04 | 13F | Spire Wealth Management | 6 | −99,44 | 1 | −100,00 | ||||
| 2025-07-25 | 13F | Envestnet Portfolio Solutions, Inc. | 4 076 | 0,00 | 468 | 5,41 | ||||
| 2025-08-05 | 13F | Key FInancial Inc | 289 | 0,00 | 33 | 6,45 | ||||
| 2025-08-12 | 13F | Howe & Rusling Inc | 0 | −100,00 | 0 | |||||
| 2025-05-15 | 13F | Advisory Services Network, LLC | 0 | −100,00 | 0 | |||||
| 2025-07-29 | 13F | BKM Wealth Management, LLC | 1 942 | 7,53 | 223 | 13,78 | ||||
| 2025-08-07 | 13F | Allworth Financial LP | 2 077 | 0,05 | 239 | 9,68 | ||||
| 2025-08-14 | 13F | Stifel Financial Corp | 90 823 | −2,33 | 10 431 | 2,94 | ||||
| 2025-07-21 | 13F | Ameriflex Group, Inc. | 0 | −100,00 | 0 | |||||
| 2025-07-29 | 13F | Stratos Wealth Partners, LTD. | 41 409 | 7,47 | 4 756 | 13,24 | ||||
| 2025-08-18 | 13F/A | National Bank Of Canada /fi/ | 94 | −95,36 | 11 | −95,52 | ||||
| 2025-08-06 | 13F | Bensler, LLC | 2 189 | 251 | ||||||
| 2025-08-06 | 13F/A | Three Cord True Wealth Management, LLC | 116 858 | 4,97 | 13 421 | 10,62 | ||||
| 2025-08-11 | 13F | Anderson Financial Strategies, LLC | 0 | −100,00 | 0 | |||||
| 2025-08-12 | 13F | O'shaughnessy Asset Management, Llc | 680 | 78 | ||||||
| 2025-08-05 | 13F | GPS Wealth Strategies Group, LLC | 6 881 | 6,47 | 790 | 12,22 | ||||
| 2025-07-25 | 13F | Apollon Wealth Management, LLC | 4 696 | −0,09 | 539 | 5,27 | ||||
| 2025-07-14 | 13F | GAMMA Investing LLC | 927 | 0,00 | 106 | 4,95 | ||||
| 2025-08-14 | 13F | Hrt Financial Lp | 2 145 | 0 | ||||||
| 2025-08-14 | 13F | Great Valley Advisor Group, Inc. | 3 230 | −5,08 | 371 | 0,27 | ||||
| 2025-08-12 | 13F | Jpmorgan Chase & Co | 278 | −19,65 | 32 | −16,22 | ||||
| 2025-08-11 | 13F | Pinnacle Wealth Planning Services, Inc. | 2 097 | 0,00 | 241 | 5,26 | ||||
| 2025-08-14 | 13F | Jane Street Group, Llc | 0 | −100,00 | 0 | |||||
| 2025-08-14 | 13F | Raymond James Financial Inc | 487 310 | −4,26 | 55 968 | 0,90 | ||||
| 2025-08-04 | 13F | Creekmur Asset Management LLC | 136 | 0,00 | 16 | 7,14 | ||||
| 2025-07-29 | 13F | Crux Wealth Advisors | 7 996 | −58,47 | 918 | −56,24 | ||||
| 2025-08-19 | 13F | Anchor Investment Management, LLC | 273 | 0,00 | 31 | 6,90 | ||||
| 2025-08-13 | 13F | Elios Financial Group Inc. | 2 282 | −0,13 | 262 | 5,22 | ||||
| 2025-08-13 | 13F | Continuum Advisory, LLC | 0 | −100,00 | 0 | |||||
| 2025-07-08 | 13F | Nbc Securities, Inc. | 15 807 | 29,23 | 2 | 0,00 | ||||
| 2025-08-15 | 13F | Tower Research Capital LLC (TRC) | 5 | 66,67 | 1 | |||||
| 2025-08-14 | 13F | Wiley Bros.-aintree Capital, Llc | 14 516 | 98,50 | 1 667 | 110,75 | ||||
| 2025-08-12 | 13F | Global Retirement Partners, LLC | 956 | 0,31 | 110 | −0,91 | ||||
| 2025-08-11 | 13F | Hexagon Capital Partners LLC | 0 | −100,00 | 0 | |||||
| 2025-07-30 | 13F | Pacific Sun Financial Corp | 10 104 | −4,17 | 1 160 | 0,96 | ||||
| 2025-08-06 | 13F | Golden State Wealth Management, LLC | 289 | 0,35 | 33 | 6,45 | ||||
| 2025-08-13 | 13F | Twin Peaks Wealth Advisors, LLC | 134 | 16 | ||||||
| 2025-08-14 | 13F | Royal Bank Of Canada | 275 693 | 18,52 | 31 663 | 24,90 | ||||
| 2025-07-07 | 13F | Thurston, Springer, Miller, Herd & Titak, Inc. | 7 854 | 902 | ||||||
| 2025-07-30 | 13F | D.a. Davidson & Co. | 54 227 | −4,81 | 6 228 | 0,32 | ||||
| 2025-08-08 | 13F | Kingsview Wealth Management, LLC | 2 102 | −7,89 | 241 | −2,82 | ||||
| 2025-08-08 | 13F | Cetera Investment Advisers | 169 323 | −0,66 | 19 447 | 4,69 | ||||
| 2025-05-15 | 13F | Lido Advisors, LLC | 0 | −100,00 | 0 | |||||
| 2025-07-23 | 13F | Morey & Quinn Wealth Partners, LLC | 2 843 | −7,48 | 327 | −2,40 | ||||
| 2025-07-23 | 13F | Trifecta Capital Advisors, LLC | 134 | 0,00 | 15 | 7,14 | ||||
| 2025-08-12 | 13F | CIBC Private Wealth Group, LLC | 122 | −50,00 | 14 | −39,13 | ||||
| 2025-08-14 | 13F | Citadel Advisors Llc | 11 539 | −22,07 | 1 325 | −17,85 | ||||
| 2025-07-24 | 13F | Blair William & Co/il | 409 | 47 | ||||||
| 2025-08-08 | 13F | Gts Securities Llc | 14 259 | −74,48 | 1 638 | −73,12 | ||||
| 2025-08-12 | 13F | Nemes Rush Group LLC | 41 | 0,00 | 5 | 0,00 | ||||
| 2025-05-15 | 13F | National Wealth Management Group, LLC | 3 269 | −0,94 | 356 | −6,56 | ||||
| 2025-07-31 | 13F | FSM Wealth Advisors, LLC | 21 279 | 2 488 | ||||||
| 2025-07-18 | 13F | Truist Financial Corp | 18 408 | −3,00 | 2 114 | 2,22 | ||||
| 2025-08-06 | 13F | Moors & Cabot, Inc. | 3 553 | −2,12 | 408 | 3,29 | ||||
| 2025-07-28 | 13F | Private Wealth Asset Management, LLC | 854 | 0,00 | 98 | 5,38 | ||||
| 2025-08-14 | 13F | Benjamin Edwards Inc | 26 484 | −27,87 | 3 042 | −23,99 | ||||
| 2025-08-14 | 13F | CoreCap Advisors, LLC | 276 | 0,00 | 32 | 3,33 | ||||
| 2025-07-24 | 13F | IFP Advisors, Inc | 898 | 0,00 | 103 | 6,19 | ||||
| 2025-08-06 | 13F | Prospera Financial Services Inc | 31 699 | −4,38 | 3 641 | 0,77 | ||||
| 2025-08-13 | 13F | StoneX Group Inc. | 2 725 | −2,12 | 313 | 2,97 | ||||
| 2025-07-25 | 13F | Cwm, Llc | 5 031 | 0,06 | 1 | |||||
| 2025-08-14 | 13F | Susquehanna International Group, Llp | 40 988 | 285,15 | 4 707 | 306,13 | ||||
| 2025-08-13 | 13F | Virtue Capital Management, LLC | 0 | −100,00 | 0 | |||||
| 2025-08-12 | 13F | Proequities, Inc. | 0 | 0 | ||||||
| 2025-08-13 | 13F | Jones Financial Companies Lllp | 11 161 | 13,48 | 1 281 | 20,30 | ||||
| 2025-08-08 | 13F | Creative Planning | 13 234 | −34,00 | 1 520 | −30,48 | ||||
| 2025-05-01 | 13F | Quest 10 Wealth Builders, Inc. | 75 | −81,48 | 8 | −82,61 | ||||
| 2025-07-23 | 13F | Tcfg Wealth Management, Llc | 3 647 | 0,00 | 419 | 5,29 | ||||
| 2025-08-14 | 13F | UBS Group AG | 223 675 | 11,43 | 25 689 | 17,44 | ||||
| 2025-07-28 | 13F | Harbour Investments, Inc. | 12 684 | 6,13 | 1 457 | 11,83 | ||||
| 2025-08-14 | 13F | Wells Fargo & Company/mn | 782 117 | 14,99 | 89 826 | 21,18 | ||||
| 2025-07-31 | 13F | Aspen Capital Management, LLC | 2 084 | 0,00 | 239 | 5,29 | ||||
| 2025-08-12 | 13F | Richmond Investment Services, LLC | 4 178 | 100,10 | 480 | 111,01 | ||||
| 2025-08-08 | 13F | Avantax Advisory Services, Inc. | 23 151 | −14,65 | 2 659 | −10,08 | ||||
| 2025-08-19 | 13F | National Asset Management, Inc. | 64 951 | 75,22 | 7 460 | 73,91 | ||||
| 2025-04-21 | 13F | PSI Advisors, LLC | 0 | −100,00 | 0 | |||||
| 2025-07-07 | 13F | Park Edge Advisors, LLC | 2 871 | −5,43 | 330 | −0,30 | ||||
| 2025-07-10 | 13F | Three Seasons Wealth, LLC | 4 809 | −13,41 | 552 | −8,76 | ||||
| 2025-07-29 | 13F | Private Trust Co Na | 2 367 | −17,35 | 272 | −13,14 | ||||
| 2025-08-12 | 13F | MAI Capital Management | 2 351 | 0,00 | 270 | 5,47 | ||||
| 2025-07-24 | 13F | Us Bancorp \de\ | 3 645 | 1,25 | 419 | 6,63 | ||||
| 2025-07-15 | 13F | World Equity Group, Inc. | 3 468 | 5,73 | 398 | 11,48 | ||||
| 2025-07-25 | 13F | Atria Wealth Solutions, Inc. | 0 | −100,00 | 0 | |||||
| 2025-08-11 | 13F | United Advisor Group, LLC | 7 186 | 0,08 | 825 | 5,50 | ||||
| 2025-08-08 | 13F | Larson Financial Group LLC | 1 044 | 0,19 | 120 | 5,31 | ||||
| 2025-08-13 | 13F | First Trust Advisors Lp | 2 228 | 0,50 | 256 | 5,81 | ||||
| 2025-07-29 | 13F | Stephens Inc /ar/ | 11 144 | −0,13 | 1 280 | 5,18 | ||||
| 2025-08-08 | 13F | Citizens Financial Group Inc/ri | 7 339 | −59,70 | 843 | −57,56 | ||||
| 2025-07-11 | 13F | Farther Finance Advisors, LLC | 2 406 | −7,85 | 276 | −3,16 | ||||
| 2025-07-14 | 13F | Southland Equity Partners LLC | 7 267 | −0,62 | 835 | 4,77 | ||||
| 2025-08-11 | 13F | Private Advisor Group, LLC | 26 128 | 1,58 | 3 001 | 7,03 | ||||
| 2025-08-14 | 13F | Two Sigma Securities, Llc | 2 827 | 325 | ||||||
| 2025-08-15 | 13F | First Heartland Consultants, Inc. | 3 839 | −3,64 | 441 | 1,38 | ||||
| 2025-05-12 | 13F | Sandy Spring Bank | 387 | 0,00 | 42 | −4,55 | ||||
| 2025-07-23 | 13F | Trueblood Wealth Management, LLC | 1 758 | 202 | ||||||
| 2025-08-13 | 13F | Russell Investments Group, Ltd. | 9 | −25,00 | 1 | 0,00 | ||||
| 2025-08-04 | 13F | Assetmark, Inc | 1 075 | 1 785,96 | 123 | 1 950,00 | ||||
| 2025-08-13 | 13F | Baird Financial Group, Inc. | 176 257 | 7,28 | 20 243 | 13,06 | ||||
| 2025-08-18 | 13F/A | Westwood Holdings Group Inc | 1 987 | −26,35 | 228 | −22,45 | ||||
| 2025-08-08 | 13F | MTM Investment Management, LLC | 243 | 28 | ||||||
| 2025-08-12 | 13F | J.w. Cole Advisors, Inc. | 2 131 | 245 | ||||||
| 2025-08-14 | 13F | Warren Averett Asset Management, LLC | 2 417 | 278 | ||||||
| 2025-05-15 | 13F | Mercer Global Advisors Inc /adv | 0 | −100,00 | 0 | |||||
| 2025-07-21 | 13F | DHJJ Financial Advisors, Ltd. | 11 295 | −8,87 | 1 297 | −3,93 | ||||
| 2025-08-11 | 13F | Blue Bell Private Wealth Management, Llc | 2 900 | 0,00 | 333 | 5,38 | ||||
| 2025-08-15 | 13F | Morgan Stanley | 1 112 844 | −8,94 | 127 810 | −4,03 | ||||
| 2025-05-13 | 13F | Quadrant Capital Group Llc | 0 | −100,00 | 0 | |||||
| 2025-07-25 | 13F | Concurrent Investment Advisors, LLC | 1 815 | 208 | ||||||
| 2025-07-11 | 13F | Kaydan Wealth Management, Inc. | 12 849 | −1,09 | 1 476 | 4,24 | ||||
| 2025-08-18 | 13F | Geneos Wealth Management Inc. | 3 457 | 101,93 | 397 | 113,44 | ||||
| 2025-08-11 | 13F | Tidemark, LLC | 889 | 0,00 | 102 | 6,25 | ||||
| 2025-08-14 | 13F | Bank Of America Corp /de/ | 103 936 | −28,05 | 11 937 | −24,18 | ||||
| 2025-07-16 | 13F | Independent Wealth Network Inc. | 3 861 | −0,23 | 443 | 5,23 | ||||
| 2025-07-10 | 13F | Kozak & Associates, Inc. | 94 | 0,00 | 11 | 22,22 | ||||
| 2025-08-13 | 13F | Proactive Wealth Strategies LLC | 12 226 | 0,23 | 1 | 0,00 | ||||
| 2025-07-10 | 13F | Wealth Enhancement Advisory Services, Llc | 19 377 | 0,09 | 2 289 | 8,49 | ||||
| 2025-08-14 | 13F | Smartleaf Asset Management LLC | 101 | 0,00 | 12 | 10,00 | ||||
| 2025-08-15 | 13F | Cornerstone Financial Group, LLC /NE/ | 1 904 | 0,21 | 219 | 2,35 | ||||
| 2025-08-14 | 13F | Mml Investors Services, Llc | 6 875 | −25,27 | 1 | −100,00 | ||||
| 2025-08-13 | 13F | Solutions 4 Wealth, Ltd | 22 404 | 4,93 | 2 573 | 10,62 | ||||
| 2025-08-15 | 13F | Equitable Holdings, Inc. | 8 918 | −1,90 | 1 024 | 3,43 | ||||
| 2025-07-23 | 13F | Kingswood Wealth Advisors, Llc | 1 856 | 0,11 | 213 | 5,45 | ||||
| 2025-08-12 | 13F | SRS Capital Advisors, Inc. | 1 479 | −61,01 | 170 | −59,08 | ||||
| 2025-07-15 | 13F | BKA Wealth Consulting, Inc. | 2 096 | −0,14 | 241 | 5,26 | ||||
| 2025-08-11 | 13F | HighTower Advisors, LLC | 125 891 | 1,31 | 14 459 | 6,77 | ||||
| 2025-08-06 | 13F | Atlantic Union Bankshares Corp | 387 | 44 | ||||||
| 2025-07-23 | 13F | Bellevue Asset Management, Llc | 23 690 | −1,59 | 2 721 | 3,70 | ||||
| 2025-08-20 | 13F/A | Coppell Advisory Solutions LLC | 3 001 | 0,00 | 344 | 8,86 | ||||
| 2025-08-13 | 13F | Alerus Financial Na | 258 | 30 |
Other Listings
| MX:FNX |