Grunnleggende statistikk
| Institusjonelle eiere | 198 total, 197 long only, 0 short only, 1 long/short - change of 19,28% MRQ |
| Gjennomsnittlig porteføljeallokering | 0.6604 % - change of −7,66% MRQ |
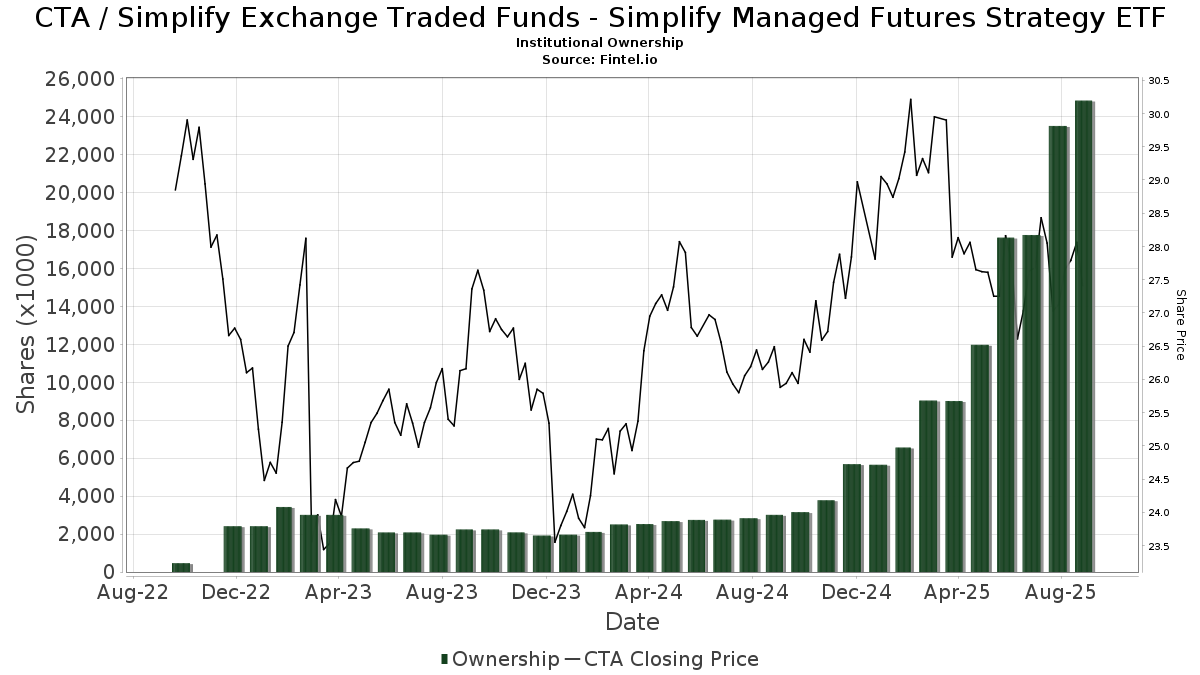
| Institusjonelle aksjer (Long) | 24 847 080 (ex 13D/G) - change of 7,22MM shares 40,98% MRQ |
| Institusjonell verdi (Long) | $ 587 237 USD ($1000) |
Institusjonelt eierskap og aksjonærer
Simplify Exchange Traded Funds - Simplify Managed Futures Strategy ETF (US:CTA) har 198 institusjonelle eiere og aksjonærer som har sendt inn 13D/G- eller 13F-skjemaer til Securities Exchange Commission (SEC). Disse institusjonene eier til sammen 24,847,080 aksjer. De største aksjonærene inkluderer Cwm, Llc, Bank Of America Corp /de/, AE Wealth Management LLC, Boothe Investment Group, Inc., LPL Financial LLC, Beacon Capital Management, LLC, Private Advisor Group, LLC, Pasadena Private Wealth, LLC, Envestnet Asset Management Inc, and Peak Financial Advisors Llc .
Simplify Exchange Traded Funds - Simplify Managed Futures Strategy ETF (ARCA:CTA) institusjonell eierstruktur viser nåværende posisjoner i selskapet fordelt på institusjoner og fond, samt de siste endringene i posisjonsstørrelse. De største aksjonærene kan være individuelle investorer, verdipapirfond, hedgefond eller institusjoner. Schedule 13D indikerer at investoren eier (eller har eid) mer enn 5 % av selskapet og har til hensikt (eller hadde til hensikt) å aktivt forfølge en endring i forretningsstrategien. Schedule 13G indikerer en passiv investering på over 5 %.
The share price as of September 12, 2025 is 27,43 / share. Previously, on September 13, 2024, the share price was 26,29 / share. This represents an increase of 4,34% over that period.
Fondssentiment-score
Fondssentiment Score (også kjent som akkumulering av eierskap poengsum) viser hvilke aksjer som er mest kjøpt av fond. Den er resultatet av en sofistikert, kvantitativ flerfaktormodell som identifiserer selskaper med de høyeste nivåene av institusjonell akkumulering. Beregningsmodellen for poeng bruker en kombinasjon av den totale økningen i antall offentliggjorte eiere, endringer i porteføljeallokeringen til disse eierne og andre beregninger. Tallet går fra 0 til 100, der høyere tall indikerer en høyere grad av akkumulering i forhold til sammenlignbare selskaper, der 50 er gjennomsnittet.
Oppdateringsfrekvens: Daglig
Sjekk ut Ownership Explorer, som inneholder en liste over de høyest rangerte selskapene.
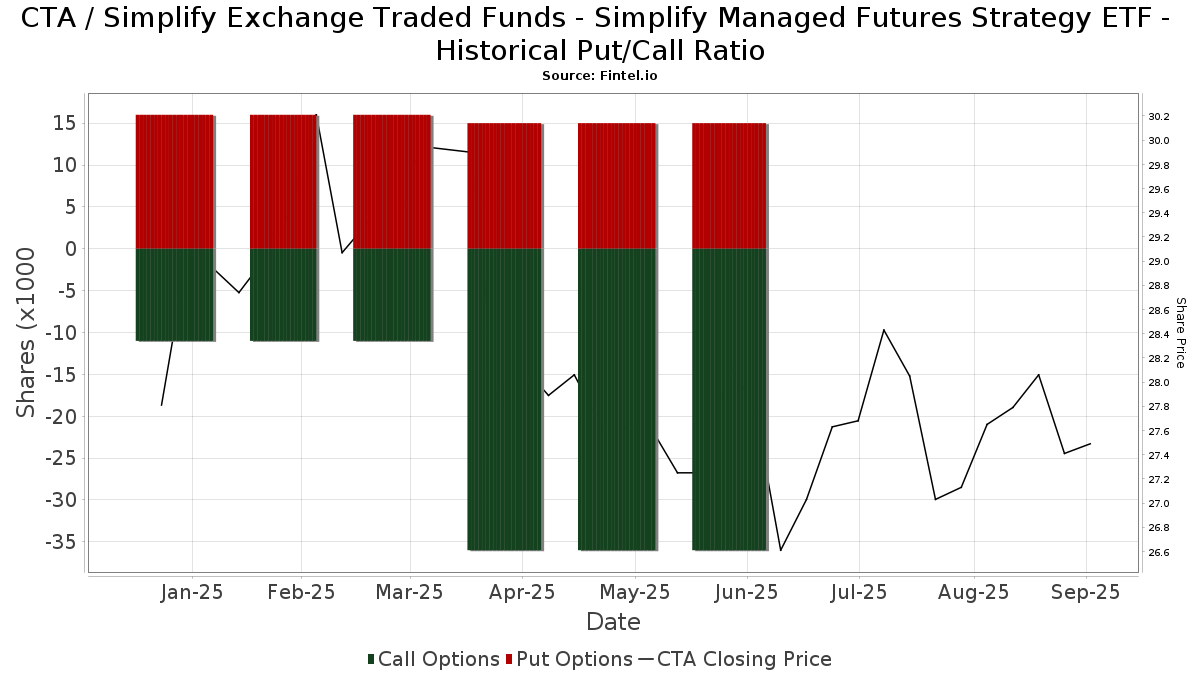
Institusjonell Put/Call-forhold
I tillegg til å rapportere standard aksje- og gjeldsemisjoner må institusjoner med mer enn 100 millioner kroner i forvaltningskapital også oppgi beholdningen av put- og callopsjoner. Siden put-opsjoner generelt indikerer et negativt sentiment, og call-opsjoner indikerer et positivt sentiment, kan vi få et inntrykk av det generelle institusjonelle sentimentet ved å plotte forholdet mellom put- og call-opsjoner. Diagrammet til høyre viser det historiske forholdet mellom put- og call-opsjoner for dette instrumentet.
Ved å bruke Put/Call-forholdet som en indikator på investorsentimentet kan man overvinne en av de viktigste svakhetene ved å bruke totalt institusjonelt eierskap, nemlig at en betydelig andel av forvaltningskapitalen investeres passivt for å følge indekser. Passivt forvaltede fond kjøper vanligvis ikke opsjoner, slik at indikatoren for put/call-forhold i større grad gjenspeiler stemningen i aktivt forvaltede fond.
13F- og NPORT-arkiveringer
Detaljer om 13F-arkiveringer er gratis. Detaljer om NP-arkiveringer krever et premium-medlemskap. Grønne rader indikerer nye posisjoner. Røde rader indikerer lukkede posisjoner. Klikk på lenke ikonet for å se hele transaksjonshistorikken.
Oppgrader
for å låse opp premiedata og eksportere til Excel. ![]() .
.
| Fildato | Kilde | Investor | Type | Gjennomsnittlig pris (estimert) |
Aksjer | Δ Aksjer (%) |
Rapportert verdi ($1000) | Verdi (%) | Portallokering (%) | |
|---|---|---|---|---|---|---|---|---|---|---|
| 2025-07-16 | 13F | Kennedy Investment Group | 8 077 | 216 | ||||||
| 2025-06-25 | NP | QAI - IQ Hedge Multi-Strategy Tracker ETF | 237 088 | 143,98 | 6 653 | 140,23 | ||||
| 2025-08-13 | 13F | Smith, Moore & Co. | 0 | −100,00 | 0 | |||||
| 2025-07-31 | 13F | Brighton Jones Llc | 37 818 | 0,94 | 1 011 | −8,84 | ||||
| 2025-08-13 | 13F | Continuum Advisory, LLC | 0 | −100,00 | 0 | |||||
| 2025-05-23 | NP | FIG - Simplify Macro Strategy ETF | 66 957 | −52,30 | 1 982 | −49,40 | ||||
| 2025-04-17 | 13F | Howard Bailey Securities, Llc | 0 | −100,00 | 0 | |||||
| 2025-08-11 | 13F | Western Wealth Management, LLC | 35 556 | 951 | ||||||
| 2025-08-14 | 13F | Mariner, LLC | 125 526 | 38,53 | 3 357 | 25,13 | ||||
| 2025-07-18 | 13F | PFG Investments, LLC | 65 480 | 35,04 | 1 751 | 21,95 | ||||
| 2025-08-08 | 13F | Austin Wealth Management, LLC | 84 380 | 2 318 | ||||||
| 2025-07-10 | 13F | Wealth Enhancement Advisory Services, Llc | 84 576 | 151,41 | 2 290 | 130,15 | ||||
| 2025-08-11 | 13F | Principal Securities, Inc. | 45 459 | 7 104,28 | 1 216 | 7 047,06 | ||||
| 2025-07-30 | 13F | Drive Wealth Management, Llc | 0 | −100,00 | 0 | |||||
| 2025-07-10 | 13F | PMV Capital Advisers, LLC | 103 273 | 2 762 | ||||||
| 2025-08-14 | 13F | GWM Advisors LLC | 439 | −95,95 | 12 | −96,56 | ||||
| 2025-08-08 | 13F | Avantax Advisory Services, Inc. | 28 769 | 6,94 | 769 | −3,39 | ||||
| 2025-09-04 | 13F | Beacon Capital Management, Inc. | 186 965 | 0,00 | 4 999 | −3,08 | ||||
| 2025-08-14 | 13F | Susquehanna International Group, Llp | 108 196 | 2 893 | ||||||
| 2025-07-25 | 13F | Cwm, Llc | 2 375 839 | 10 420,48 | 64 | |||||
| 2025-07-31 | 13F | Fielder Capital Group LLC | 342 726 | 9 164 | ||||||
| 2025-08-06 | 13F | Golden State Wealth Management, LLC | 376 | 95,83 | 10 | 100,00 | ||||
| 2025-07-15 | 13F | Retirement Guys Formula Llc | 51 277 | 40,54 | 1 371 | 27,06 | ||||
| 2025-08-07 | 13F | Aspen Wealth Strategies, LLC | 182 167 | 2,88 | 4 871 | −7,06 | ||||
| 2025-08-14 | 13F | Clg Llc | 108 206 | −8,92 | 2 893 | −17,72 | ||||
| 2025-07-16 | 13F | ORG Partners LLC | 19 186 | −0,84 | 513 | −10,63 | ||||
| 2025-08-06 | 13F | Wedbush Securities Inc | 14 448 | 0 | ||||||
| 2025-07-28 | 13F | Aries Wealth Management | 55 481 | 8,20 | 1 484 | −2,24 | ||||
| 2025-07-09 | 13F | Fermata Advisors, LLC | 34 622 | 57,22 | 926 | 42,09 | ||||
| 2025-07-31 | 13F | Boothe Investment Group, Inc. | 1 091 693 | 29 192 | ||||||
| 2025-08-13 | 13F | Great Diamond Partners, LLC | 12 118 | −2,43 | 324 | −11,72 | ||||
| 2025-07-16 | 13F | Cambridge Advisors Inc. | 21 697 | 10,32 | 580 | −0,34 | ||||
| 2025-07-22 | 13F | Wealthcare Advisory Partners LLC | 121 141 | 0,77 | 3 239 | −8,97 | ||||
| 2025-08-14 | 13F | Harwood Advisory Group, LLC | 53 666 | 1 435 | ||||||
| 2025-08-13 | 13F/A | StoneX Group Inc. | 11 353 | 295 | ||||||
| 2025-07-17 | 13F | Archford Capital Strategies, LLC | 162 917 | 3,11 | 4 356 | −6,84 | ||||
| 2025-07-11 | 13F | Farther Finance Advisors, LLC | 33 369 | −12,73 | 892 | −21,62 | ||||
| 2025-07-31 | 13F | Cambridge Investment Research Advisors, Inc. | 282 412 | 5,95 | 8 | 0,00 | ||||
| 2025-08-01 | 13F | Pasadena Private Wealth, LLC | 642 421 | 18,76 | 17 178 | 7,29 | ||||
| 2025-07-30 | NP | ENDW - Cambria Endowment Style ETF | 85 291 | 2 312 | ||||||
| 2025-08-01 | 13F | Brookwood Investment Group LLC | 14 970 | 12,97 | 400 | 2,04 | ||||
| 2025-07-25 | 13F | R. W. Roge & Company, Inc. | 157 465 | 103,26 | 4 | 100,00 | ||||
| 2025-07-09 | 13F | Reyes Financial Architecture, Inc. | 4 927 | 22,50 | 132 | 10,08 | ||||
| 2025-04-28 | 13F | DAVENPORT & Co LLC | 0 | −100,00 | 0 | |||||
| 2025-07-08 | 13F | Parallel Advisors, LLC | 489 | 13 | ||||||
| 2025-08-14 | 13F | Napa Wealth Management | 263 528 | −6,65 | 7 047 | −15,68 | ||||
| 2025-07-18 | 13F | Magnolia Private Wealth, LLC | 72 135 | 172,87 | 1 929 | 146,55 | ||||
| 2025-07-28 | 13F | J.Safra Asset Management Corp | 1 946 | 52 | ||||||
| 2025-08-04 | 13F | Whalen Wealth Management Inc. | 0 | −100,00 | 0 | |||||
| 2025-07-15 | 13F | Revisor Wealth Management LLC | 18 699 | 117,61 | 514 | 102,36 | ||||
| 2025-07-29 | 13F | Private Trust Co Na | 681 | 16,01 | 18 | 5,88 | ||||
| 2025-07-15 | 13F | Elevated Capital Advisors, LLC | 192 050 | 0,00 | 5 685 | 0,00 | ||||
| 2025-08-15 | 13F | Global View Capital Management LLC | 24 130 | −12,00 | 645 | −20,47 | ||||
| 2025-04-29 | 13F | Bank of New York Mellon Corp | 0 | −100,00 | 0 | |||||
| 2025-07-23 | 13F | Tcfg Wealth Management, Llc | 70 754 | 2,43 | 1 892 | −7,49 | ||||
| 2025-08-05 | 13F | Simplex Trading, Llc | 761 | −67,88 | 0 | |||||
| 2025-08-07 | 13F | Blackston Financial Advisory Group, LLC | 32 556 | 871 | ||||||
| 2025-08-14 | 13F | UBS Group AG | 7 616 | −22,08 | 204 | −29,76 | ||||
| 2025-08-18 | 13F | Tactive Advisors, LLC | 11 157 | 298 | ||||||
| 2025-07-22 | 13F | Belpointe Asset Management LLC | 199 895 | 4,41 | 5 345 | −5,68 | ||||
| 2025-08-14 | 13F | Mpwm Advisory Solutions, Llc | 481 | 0,00 | 13 | −14,29 | ||||
| 2025-08-04 | 13F | Atria Investments Llc | 214 147 | 21,12 | 5 726 | 9,42 | ||||
| 2025-08-13 | 13F | Cambria Investment Management, L.P. | 85 291 | 2 281 | ||||||
| 2025-08-06 | 13F | Commonwealth Equity Services, Llc | 7 534 | −55,69 | 0 | |||||
| 2025-08-12 | 13F | Ameritas Investment Partners, Inc. | 68 | 2 | ||||||
| 2025-08-13 | 13F | Brown Advisory Inc | 8 668 | 0,00 | 232 | −9,77 | ||||
| 2025-08-25 | NP | MAINSTAY VP FUNDS TRUST - MainStay VP IQ Hedge Multi-Strategy Portfolio Initial Class | 70 630 | 127,27 | 1 889 | 105,44 | ||||
| 2025-08-06 | 13F | Axim Planning & Wealth | 27 191 | 115,43 | 727 | 94,91 | ||||
| 2025-08-14 | 13F | Great Valley Advisor Group, Inc. | 23 041 | 616 | ||||||
| 2025-08-14 | 13F | Money Concepts Capital Corp | 14 056 | −91,85 | 376 | −92,65 | ||||
| 2025-07-24 | 13F | Fischer Investment Strategies, Llc | 39 462 | −78,64 | 1 055 | −80,71 | ||||
| 2025-08-12 | 13F | Global Retirement Partners, LLC | 1 749 | 47 | ||||||
| 2025-07-18 | 13F | Philip James Wealth Mangement, LLC | 207 438 | 4,21 | 5 547 | −5,87 | ||||
| 2025-08-14 | 13F | Jane Street Group, Llc | 137 103 | 3 666 | ||||||
| 2025-08-14 | 13F | Stifel Financial Corp | 128 985 | −6,95 | 3 449 | −15,94 | ||||
| 2025-08-13 | 13F | WCG Wealth Advisors LLC | 0 | −100,00 | 0 | |||||
| 2025-05-15 | 13F/A | Orion Portfolio Solutions, LLC | 423 211 | −6,72 | 12 527 | −1,00 | ||||
| 2025-08-13 | 13F | Manning & Napier Advisors Llc | 401 | 11 | ||||||
| 2025-07-18 | 13F | Astor Investment Management LLC | 163 635 | −3,75 | 4 376 | −13,06 | ||||
| 2025-08-14 | 13F | Integrated Wealth Concepts LLC | 36 204 | 9,07 | 968 | −1,43 | ||||
| 2025-07-17 | 13F | KWB Wealth | 75 464 | 2 234 | ||||||
| 2025-08-12 | 13F | Cowa, Llc | 205 019 | 26,32 | 5 487 | 14,22 | ||||
| 2025-08-13 | 13F | Cary Street Partners Financial Llc | 20 616 | −26,60 | 551 | −33,69 | ||||
| 2025-08-14 | 13F | Raymond James Financial Inc | 215 027 | 5 750 | ||||||
| 2025-08-29 | 13F | Evolution Wealth Management Inc. | 1 150 | 31 | ||||||
| 2025-08-14 | 13F | Federation des caisses Desjardins du Quebec | 1 137 | 0,00 | 30 | −9,09 | ||||
| 2025-07-18 | 13F | Truist Financial Corp | 325 132 | 1 687,42 | 8 694 | 1 515,99 | ||||
| 2025-08-06 | 13F | Moors & Cabot, Inc. | 0 | −100,00 | 0 | |||||
| 2025-07-23 | 13F | WESPAC Advisors, LLC | 49 334 | −3,20 | 1 319 | −12,53 | ||||
| 2025-08-01 | 13F | Envestnet Asset Management Inc | 635 079 | 38,49 | 16 982 | 25,11 | ||||
| 2025-08-14 | 13F | IHT Wealth Management, LLC | 23 720 | 23,72 | 634 | 11,82 | ||||
| 2025-08-14 | 13F | Royal Bank Of Canada | 32 787 | −68,77 | 877 | −71,78 | ||||
| 2025-08-11 | 13F | Private Advisor Group, LLC | 649 039 | 52,00 | 17 355 | 37,31 | ||||
| 2025-08-01 | 13F | Gwn Securities Inc. | 11 946 | 320 | ||||||
| 2025-08-05 | 13F | Bank Of Montreal /can/ | 30 | −99,64 | 1 | −100,00 | ||||
| 2025-08-14 | 13F | CoreCap Advisors, LLC | 1 478 | −20,24 | 40 | −27,78 | ||||
| 2025-07-25 | 13F | Sharp Financial Services, LLC | 49 490 | 46,68 | 1 323 | 32,57 | ||||
| 2025-07-24 | 13F | Morton Brown Family Wealth, LLC | 0 | −100,00 | 0 | |||||
| 2025-07-22 | 13F | Miracle Mile Advisors, LLC | 55 263 | −8,37 | 1 478 | −17,25 | ||||
| 2025-07-30 | 13F | Brookstone Capital Management | 35 756 | −4,01 | 956 | −13,25 | ||||
| 2025-08-11 | 13F | Theory Financial Llc | 0 | −100,00 | 0 | |||||
| 2025-08-06 | 13F | Ethos Financial Group, LLC | 135 791 | 11,79 | 3 631 | 7,20 | ||||
| 2025-08-06 | 13F | First Horizon Advisors, Inc. | 459 | 12 | ||||||
| 2025-07-21 | 13F | Andina Capital Management, LLC | 51 167 | 0,43 | 1 368 | −9,28 | ||||
| 2025-07-28 | 13F | Harbour Investments, Inc. | 46 795 | −2,81 | 1 251 | −12,21 | ||||
| 2025-08-08 | 13F | Crossmark Global Holdings, Inc. | 31 897 | 30,77 | 852 | 18,52 | ||||
| 2025-07-18 | 13F | B.O.S.S. Retirement Advisors, LLC | 47 972 | 127,92 | 1 283 | 105,78 | ||||
| 2025-08-12 | 13F | CIBC Private Wealth Group, LLC | 1 139 | −19,45 | 30 | −23,08 | ||||
| 2025-08-14 | 13F | Hrt Financial Lp | 9 133 | 0 | ||||||
| 2025-08-08 | NP | QALTX - Quantified Alternative Investment Fund Investor Class Shares | 5 045 | −71,15 | 135 | −74,08 | ||||
| 2025-04-25 | 13F | New Wave Wealth Advisors Llc | 0 | −100,00 | 0 | |||||
| 2025-07-15 | 13F | Fifth Third Bancorp | 729 | 19 | ||||||
| 2025-08-13 | 13F | Baird Financial Group, Inc. | 74 832 | 163,96 | 2 001 | 138,50 | ||||
| 2025-07-24 | 13F | IFP Advisors, Inc | 9 299 | 14,77 | 249 | 3,77 | ||||
| 2025-08-12 | 13F | Steward Partners Investment Advisory, Llc | 220 239 | 8,43 | 5 889 | −2,05 | ||||
| 2025-07-16 | 13F | ORG Wealth Partners, LLC | 42 570 | 5,24 | 1 139 | −5,32 | ||||
| 2025-07-11 | 13F | Deane Retirement Strategies, Inc. | 195 651 | 30 470,47 | 5 232 | 28 961,11 | ||||
| 2025-07-31 | 13F | Longview Financial Advisors, Inc. | 187 965 | −5,27 | 5 026 | −14,42 | ||||
| 2025-08-11 | 13F | Empowered Funds, LLC | 85 291 | 2 281 | ||||||
| 2025-08-13 | 13F | Legacy Capital Wealth Partners, LLC | 0 | −100,00 | 0 | |||||
| 2025-08-06 | 13F | Csenge Advisory Group | 9 604 | 1,54 | 260 | −1,89 | ||||
| 2025-08-14 | 13F | Wells Fargo & Company/mn | 347 892 | −1,85 | 9 303 | −11,33 | ||||
| 2025-08-11 | 13F | Advisor Resource Council | 7 543 | −96,82 | 202 | −97,04 | ||||
| 2025-07-25 | 13F | We Are One Seven, LLC | 13 650 | 0,73 | 365 | −8,98 | ||||
| 2025-08-05 | 13F | Optivise Advisory Services LLC | 76 564 | 25,04 | 2 047 | 12,97 | ||||
| 2025-08-18 | 13F/A | National Bank Of Canada /fi/ | 22 555 | 0,49 | 602 | −9,35 | ||||
| 2025-08-14 | 13F | Mml Investors Services, Llc | 164 441 | 43,34 | 4 | 33,33 | ||||
| 2025-08-12 | 13F | LPL Financial LLC | 853 567 | 14,74 | 22 824 | 3,66 | ||||
| 2025-08-19 | 13F | Advisory Services Network, LLC | 0 | −100,00 | 0 | |||||
| 2025-09-10 | 13F | WT Wealth Management | 28 615 | 28,93 | 765 | 16,62 | ||||
| 2025-09-04 | 13F/A | Advisor Group Holdings, Inc. | 234 131 | 204,20 | 6 282 | 175,77 | ||||
| 2025-07-10 | 13F | Worth Asset Management, LLC | 0 | −100,00 | 0 | |||||
| 2025-07-23 | 13F | Secured Retirement Advisors, Llc | 45 536 | 11,50 | 1 218 | 0,75 | ||||
| 2025-08-07 | 13F | Resources Investment Advisors, LLC. | 0 | −100,00 | 0 | |||||
| 2025-08-12 | 13F | AlphaCore Capital LLC | 0 | −100,00 | 0 | |||||
| 2025-07-14 | 13F | Legacy Capital Group California, Inc. | 41 792 | 0,63 | 1 118 | −9,11 | ||||
| 2025-08-06 | 13F | Decker Retirement Planning Inc. | 34 611 | 136,17 | 925 | 113,63 | ||||
| 2025-08-06 | 13F | Pekin Hardy Strauss, Inc. | 63 795 | 1 706 | ||||||
| 2025-08-13 | 13F | Luminist Capital LLC | 13 623 | −1,32 | 365 | −11,22 | ||||
| 2025-07-29 | 13F | Fundamentun, Llc | 122 866 | 43,31 | 3 285 | 29,48 | ||||
| 2025-08-14 | 13F | Principia Wealth Advisory, LLC | 5 624 | 150 | ||||||
| 2025-08-15 | 13F | Kestra Advisory Services, LLC | 36 935 | 83,34 | 988 | 65,60 | ||||
| 2025-08-15 | 13F | WFA of San Diego, LLC | 1 329 | 1 256,12 | 36 | 1 650,00 | ||||
| 2025-04-22 | 13F | World Equity Group, Inc. | 0 | −100,00 | 0 | |||||
| 2025-08-01 | 13F | Solstein Capital, LLC | 12 516 | 1 652,94 | 335 | 1 490,48 | ||||
| 2025-08-06 | 13F | Entrewealth, Llc | 17 659 | 472 | ||||||
| 2025-08-06 | 13F | Able Wealth Management LLC | 13 562 | 363 | ||||||
| 2025-08-11 | 13F | HighTower Advisors, LLC | 522 298 | −26,05 | 13 966 | −33,20 | ||||
| 2025-08-11 | 13F | Resurgent Financial Advisors LLC | 15 734 | 421 | ||||||
| 2025-08-12 | 13F | Guerra Advisors Inc | 17 759 | 475 | ||||||
| 2025-07-28 | 13F | SFG Wealth Management, LLC. | 0 | −100,00 | 0 | |||||
| 2025-08-05 | 13F | Advisors Preferred, LLC | 5 045 | −71,15 | 135 | −74,04 | ||||
| 2025-08-13 | 13F | Transce3nd, LLC | 9 950 | −2,67 | 266 | −11,92 | ||||
| 2025-08-08 | 13F | POM Investment Strategies, LLC | 300 265 | 4,92 | 8 029 | −5,22 | ||||
| 2025-07-07 | 13F | Upper Left Wealth Management, LLC | 99 735 | −18,86 | 2 667 | −26,72 | ||||
| 2025-04-30 | 13F | Axxcess Wealth Management, Llc | 0 | −100,00 | 0 | |||||
| 2025-07-07 | 13F | Global Wealth Strategies & Associates | 39 617 | −5,90 | 1 059 | −15,01 | ||||
| 2025-08-14 | 13F | Wiley Bros.-aintree Capital, Llc | 9 728 | 260 | ||||||
| 2025-05-16 | 13F/A | Kestra Investment Management, LLC | 0 | −100,00 | 0 | |||||
| 2025-08-13 | 13F | Northwestern Mutual Wealth Management Co | 3 297 | 88 | ||||||
| 2025-04-14 | 13F | Lloyd Advisory Services, LLC. | 0 | −100,00 | 0 | |||||
| 2025-08-07 | 13F | Authentikos Wealth Advisory, LLC | 97 459 | −23,61 | 2 606 | −30,99 | ||||
| 2025-08-07 | 13F | Encompass More Asset Management | 72 434 | −23,12 | 1 937 | −30,56 | ||||
| 2025-07-17 | 13F | Beacon Capital Management, LLC | 743 247 | 3,08 | 19 874 | −6,88 | ||||
| 2025-07-29 | 13F | Latitude Advisors, LLC | 8 864 | 237 | ||||||
| 2025-08-12 | 13F | Proequities, Inc. | 0 | 0 | ||||||
| 2025-08-01 | 13F | FSA Advisors, Inc. | 116 645 | 89,37 | 3 119 | 71,09 | ||||
| 2025-08-12 | 13F | Coldstream Capital Management Inc | 0 | −100,00 | 0 | |||||
| 2025-08-12 | 13F | Park Square Financial Group, LLC | 15 572 | 520,40 | 416 | 462,16 | ||||
| 2025-08-07 | 13F | Nwam Llc | 32 260 | −1,14 | 905 | −6,32 | ||||
| 2025-08-14 | 13F | Bank Of America Corp /de/ | 1 727 721 | 0,75 | 46 199 | −8,98 | ||||
| 2025-08-13 | 13F | GeoWealth Management, LLC | 11 816 | −1,31 | 316 | −11,02 | ||||
| 2025-08-18 | 13F | Geneos Wealth Management Inc. | 500 | −99,06 | 13 | −99,17 | ||||
| 2025-08-14 | 13F | Comerica Bank | 2 | −99,84 | 0 | −100,00 | ||||
| 2025-08-14 | 13F | Hilltop Holdings Inc. | 35 582 | −8,39 | 951 | −17,23 | ||||
| 2025-08-13 | 13F | VestGen Advisors, LLC | 9 292 | 248 | ||||||
| 2025-06-30 | NP | ASTIX - Astor Dynamic Allocation Fund Class I shares | 73 194 | 0,00 | 2 054 | −1,58 | ||||
| 2025-08-07 | 13F | Parkside Financial Bank & Trust | 3 103 | 0,00 | 83 | −9,89 | ||||
| 2025-07-10 | 13F | Professional Financial Advisors, LLC | 12 184 | 326 | ||||||
| 2025-08-08 | 13F | Altiora Financial Group, LLC | 395 833 | 0,91 | 10 585 | −8,84 | ||||
| 2025-07-07 | 13F | Insight Wealth Strategies, LLC | 13 099 | 351 | ||||||
| 2025-07-24 | 13F | Eastern Bank | 0 | −100,00 | 0 | |||||
| 2025-08-06 | 13F | AE Wealth Management LLC | 1 198 924 | 23,34 | 32 059 | 11,42 | ||||
| 2025-07-09 | 13F | Dynamic Advisor Solutions LLC | 317 566 | 56,25 | 8 492 | 41,14 | ||||
| 2025-08-06 | 13F | Nvwm, Llc | 100 | 0,00 | 3 | 0,00 | ||||
| 2025-08-12 | 13F | Change Path, LLC | 109 754 | 729,84 | 2 935 | 650,38 | ||||
| 2025-07-01 | 13F | Burkett Financial Services, Llc | 0 | −100,00 | 0 | |||||
| 2025-08-07 | 13F | Proficio Capital Partners LLC | 43 965 | 390,41 | 1 176 | 343,40 | ||||
| 2025-07-31 | 13F | Oppenheimer & Co Inc | 35 122 | 939 | ||||||
| 2025-08-27 | 13F/A | Brinker Capital Investments, LLC | 531 164 | 25,51 | 14 203 | 13,38 | ||||
| 2025-07-09 | 13F | Tounjian Advisory Partners, Llc | 9 028 | −24,82 | 267 | −24,79 | ||||
| 2025-07-30 | 13F | Mid-American Wealth Advisory Group, Inc. | 55 | −99,73 | 1 | −99,84 | ||||
| 2025-07-09 | 13F | Fiduciary Alliance LLC | 64 684 | 1 730 | ||||||
| 2025-08-04 | 13F | L.m. Kohn & Company | 12 321 | 7,85 | 329 | −2,66 | ||||
| 2025-07-17 | 13F | Janney Montgomery Scott LLC | 0 | −100,00 | 0 | |||||
| 2025-08-08 | 13F/A | Ignite Planners, LLC | 142 359 | 19,36 | 3 946 | 19,36 | ||||
| 2025-07-14 | 13F | Financial Enhancement Group LLC | 117 554 | 2,85 | 3 277 | 1,90 | ||||
| 2025-07-15 | 13F | FMA Wealth Management, LLC | 46 715 | 16,83 | 1 249 | 8,80 | ||||
| 2025-08-14 | 13F | Betterment LLC | 19 867 | 0,36 | 1 | |||||
| 2025-04-23 | 13F | Bessemer Group Inc | 0 | −100,00 | 0 | |||||
| 2025-07-17 | 13F | Global Trust Asset Management, LLC | 592 | 0,00 | 16 | −11,76 | ||||
| 2025-08-15 | 13F | Orcam Financial Group | 10 140 | 0,00 | 271 | −9,67 | ||||
| 2025-05-02 | 13F | Capital A Wealth Management, LLC | 290 509 | 8 599 | ||||||
| 2025-08-29 | NP | COIDX - IDX Commodity Opportunities Fund Institutional Class Shares | 15 000 | 400 | ||||||
| 2025-08-14 | 13F | Colony Group, LLC | 24 866 | 665 | ||||||
| 2025-07-25 | 13F | Apollon Wealth Management, LLC | 83 865 | 22,34 | 2 243 | 10,50 | ||||
| 2025-08-01 | 13F | Delta Investment Management, LLC | 35 302 | 944 | ||||||
| 2025-05-01 | 13F | Quest 10 Wealth Builders, Inc. | 526 | −42,70 | 16 | −40,00 | ||||
| 2025-08-07 | 13F | Allworth Financial LP | 301 | −74,94 | 8 | −75,76 | ||||
| 2025-07-29 | 13F | Stratos Wealth Advisors, LLC | 28 214 | −54,26 | 754 | −58,68 | ||||
| 2025-07-07 | 13F | Peak Financial Advisors Llc | 540 375 | 65,22 | 14 450 | 49,25 | ||||
| 2025-08-12 | 13F | Jpmorgan Chase & Co | 100 | 0,00 | 3 | 0,00 | ||||
| 2025-07-29 | 13F | Stratos Wealth Partners, LTD. | 46 893 | −35,29 | 1 254 | −41,59 | ||||
| 2025-08-14 | 13F | L2 Asset Management, LLC | 34 441 | 921 | ||||||
| 2025-07-23 | 13F | Prime Capital Investment Advisors, LLC | 20 431 | −84,29 | 546 | −85,82 | ||||
| 2025-07-31 | 13F | Stegent Equity Advisors, Inc. | 30 257 | 6,19 | 809 | −4,03 | ||||
| 2025-04-15 | 13F | Reuter James Wealth Management, Llc | 0 | −100,00 | 0 | |||||
| 2025-08-07 | 13F | Simplify Asset Management Inc. | 0 | −100,00 | 0 | |||||
| 2025-08-14 | 13F | Clark Capital Management Group, Inc. | 310 132 | 318,59 | 8 293 | 278,11 | ||||
| 2025-08-12 | 13F | Cumberland Partners Ltd | 112 220 | 0,22 | 3 001 | −9,47 | ||||
| 2025-08-01 | 13F | New York Life Investment Management Llc | 320 834 | 142,47 | 8 579 | 119,08 | ||||
| 2025-07-17 | 13F | Raleigh Capital Management Inc. | 3 321 | −8,79 | 89 | −17,76 | ||||
| 2025-08-14 | 13F | Css Llc/il | 140 635 | 13,11 | 3 761 | 2,17 | ||||
| 2025-08-15 | 13F | Morgan Stanley | 277 517 | 4,91 | 7 421 | −5,22 | ||||
| 2025-07-21 | 13F | Ameritas Advisory Services, LLC | 2 442 | 65 | ||||||
| 2025-08-14 | 13F | Citadel Advisors Llc | 64 175 | 773,84 | 1 716 | 690,78 | ||||
| 2025-08-14 | 13F | Citadel Advisors Llc | Put | 15 600 | −3,11 | 417 | −12,39 | |||
| 2025-07-23 | 13F | Clear Creek Financial Management, LLC | 125 998 | −62,37 | 3 369 | −66,00 | ||||
| 2025-07-18 | 13F | Centricity Wealth Management, LLC | 711 | 19 | ||||||
| 2025-08-14 | 13F | Citadel Advisors Llc | Call | 36 900 | 235,45 | 987 | 203,38 |