Grunnleggende statistikk
| Institusjonelle eiere | 317 total, 317 long only, 0 short only, 0 long/short - change of 3,25% MRQ |
| Gjennomsnittlig porteføljeallokering | 0.3866 % - change of −12,63% MRQ |
| Institusjonelle aksjer (Long) | 48 405 454 (ex 13D/G) - change of −4,15MM shares −7,89% MRQ |
| Institusjonell verdi (Long) | $ 2 650 726 USD ($1000) |
Institusjonelt eierskap og aksjonærer
iShares Trust - iShares California Muni Bond ETF (US:CMF) har 317 institusjonelle eiere og aksjonærer som har sendt inn 13D/G- eller 13F-skjemaer til Securities Exchange Commission (SEC). Disse institusjonene eier til sammen 48,405,454 aksjer. De største aksjonærene inkluderer Wealthfront Advisers Llc, Charles Schwab Investment Management Inc, Fmr Llc, Jane Street Group, Llc, Morgan Stanley, Bailard, Inc., Facet Wealth, Inc., Syon Capital Llc, EP Wealth Advisors, Inc., and Bank Of America Corp /de/ .
iShares Trust - iShares California Muni Bond ETF (ARCA:CMF) institusjonell eierstruktur viser nåværende posisjoner i selskapet fordelt på institusjoner og fond, samt de siste endringene i posisjonsstørrelse. De største aksjonærene kan være individuelle investorer, verdipapirfond, hedgefond eller institusjoner. Schedule 13D indikerer at investoren eier (eller har eid) mer enn 5 % av selskapet og har til hensikt (eller hadde til hensikt) å aktivt forfølge en endring i forretningsstrategien. Schedule 13G indikerer en passiv investering på over 5 %.
The share price as of September 10, 2025 is 56,75 / share. Previously, on September 11, 2024, the share price was 57,96 / share. This represents a decline of 2,09% over that period.

Fondssentiment-score
Fondssentiment Score (også kjent som akkumulering av eierskap poengsum) viser hvilke aksjer som er mest kjøpt av fond. Den er resultatet av en sofistikert, kvantitativ flerfaktormodell som identifiserer selskaper med de høyeste nivåene av institusjonell akkumulering. Beregningsmodellen for poeng bruker en kombinasjon av den totale økningen i antall offentliggjorte eiere, endringer i porteføljeallokeringen til disse eierne og andre beregninger. Tallet går fra 0 til 100, der høyere tall indikerer en høyere grad av akkumulering i forhold til sammenlignbare selskaper, der 50 er gjennomsnittet.
Oppdateringsfrekvens: Daglig
Sjekk ut Ownership Explorer, som inneholder en liste over de høyest rangerte selskapene.
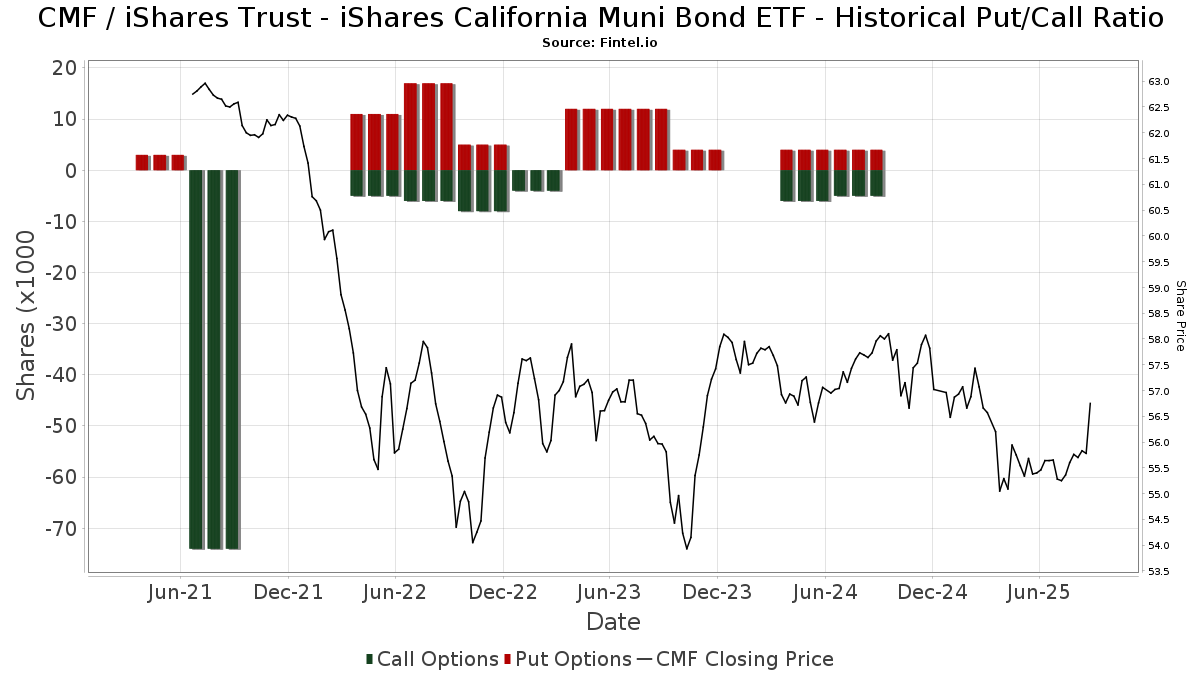
Institusjonell Put/Call-forhold
I tillegg til å rapportere standard aksje- og gjeldsemisjoner må institusjoner med mer enn 100 millioner kroner i forvaltningskapital også oppgi beholdningen av put- og callopsjoner. Siden put-opsjoner generelt indikerer et negativt sentiment, og call-opsjoner indikerer et positivt sentiment, kan vi få et inntrykk av det generelle institusjonelle sentimentet ved å plotte forholdet mellom put- og call-opsjoner. Diagrammet til høyre viser det historiske forholdet mellom put- og call-opsjoner for dette instrumentet.
Ved å bruke Put/Call-forholdet som en indikator på investorsentimentet kan man overvinne en av de viktigste svakhetene ved å bruke totalt institusjonelt eierskap, nemlig at en betydelig andel av forvaltningskapitalen investeres passivt for å følge indekser. Passivt forvaltede fond kjøper vanligvis ikke opsjoner, slik at indikatoren for put/call-forhold i større grad gjenspeiler stemningen i aktivt forvaltede fond.
13D/G-arkiveringer
Vi presenterer 13D/G-arkiveringene separat fra 13F-arkiveringene fordi de behandles forskjellig av SEC. 13D/G-arkiveringene kan sendes inn av grupper av investorer (med én leder), mens 13D/G-arkiveringene ikke kan sendes inn. Dette fører til situasjoner der en investor kan sende inn en 13D/G-rapport med én verdi for alle aksjene (som representerer alle aksjene som eies av investorgruppen), men deretter sende inn en 13F-melding med en annen verdi for alle aksjene (som kun representerer deres eget eierskap). Dette betyr at aksjeeierskap i 13D/G-arkiveringene og 13F-arkiveringene ofte ikke er direkte sammenlignbare, og vi presenterer dem derfor separat.
Merk: Fra og med 16. mai 2021 viser vi ikke lenger eiere som ikke har sendt inn en 13D/G i løpet av det siste året. Tidligere viste vi hele historikken for 13D/G-arkiveringer. Generelt må enheter som er pålagt å sende inn 13D/G-arkiveringer, sende inn minst én gang i året før de sender inn en avsluttende rapport. Det hender imidlertid at fond trekker seg ut av posisjoner uten å sende inn en avsluttende innlevering (dvs. at de avvikler), slik at visning av hele historikken av og til fører til forvirring om det nåværende eierskapet. For å unngå forvirring viser vi nå bare "nåværende" eiere, det vil si eiere som har sendt inn informasjon i løpet av det siste året.
Upgrade to unlock premium data.
13F- og NPORT-arkiveringer
Detaljer om 13F-arkiveringer er gratis. Detaljer om NP-arkiveringer krever et premium-medlemskap. Grønne rader indikerer nye posisjoner. Røde rader indikerer lukkede posisjoner. Klikk på lenke ikonet for å se hele transaksjonshistorikken.
Oppgrader
for å låse opp premiedata og eksportere til Excel. ![]() .
.
| Fildato | Kilde | Investor | Type | Gjennomsnittlig pris (estimert) |
Aksjer | Δ Aksjer (%) |
Rapportert verdi ($1000) | Verdi (%) | Portallokering (%) | |
|---|---|---|---|---|---|---|---|---|---|---|
| 2025-08-04 | 13F | Bristlecone Advisors, LLC | 17 065 | −0,20 | 951 | −1,14 | ||||
| 2025-08-14 | 13F | Mariner, LLC | 826 709 | −2,67 | 46 077 | −3,60 | ||||
| 2025-08-13 | 13F | Rinkey Investments | 244 258 | 177,03 | 13 615 | 174,37 | ||||
| 2025-07-09 | 13F | Chesley Taft & Associates LLC | 7 050 | 42,42 | 393 | 41,01 | ||||
| 2025-08-12 | 13F | Global Retirement Partners, LLC | 11 987 | 228,68 | 668 | 221,15 | ||||
| 2025-05-14 | 13F | Van Hulzen Asset Management, LLC | 0 | −100,00 | 0 | |||||
| 2025-07-25 | 13F | Envestnet Portfolio Solutions, Inc. | 239 443 | 16,95 | 13 347 | 15,83 | ||||
| 2025-08-01 | 13F | Envestnet Asset Management Inc | 519 514 | 10,71 | 28 958 | 9,65 | ||||
| 2025-08-12 | 13F | RiverFront Investment Group, LLC | 64 738 | 49,92 | 3 608 | 48,48 | ||||
| 2025-08-14 | 13F | GWM Advisors LLC | 116 458 | −6,66 | 6 491 | −7,55 | ||||
| 2025-07-01 | 13F | First National Bank Sioux Falls | 0 | −100,00 | 0 | |||||
| 2025-07-28 | 13F | Harbour Investments, Inc. | 0 | −100,00 | 0 | |||||
| 2025-07-29 | 13F | Two West Capital Advisors LLC | 13 137 | 87,94 | 726 | 90,05 | ||||
| 2025-08-08 | 13F | Gts Securities Llc | 160 618 | 8 953 | ||||||
| 2025-07-31 | 13F | Buckingham Strategic Partners | 5 839 | −51,30 | 325 | −51,78 | ||||
| 2025-08-08 | 13F | Creative Planning | 200 340 | −17,46 | 11 167 | −18,25 | ||||
| 2025-08-13 | 13F | Cerity Partners LLC | 226 840 | −3,95 | 12 644 | −4,88 | ||||
| 2025-08-12 | 13F | Fca Corp /tx | 3 636 | −16,72 | 203 | −17,55 | ||||
| 2025-08-13 | 13F | Parkworth Wealth Management, Inc. | 41 | −37,88 | 2 | −33,33 | ||||
| 2025-07-15 | 13F | Tenon Financial LLC | 12 798 | 0,00 | 713 | −0,97 | ||||
| 2025-08-01 | 13F | Gwn Securities Inc. | 3 726 | −92,44 | 208 | −92,45 | ||||
| 2025-08-05 | 13F | Westside Investment Management, Inc. | 40 272 | −3,49 | 2 245 | −4,43 | ||||
| 2025-08-14 | 13F | Colony Group, LLC | 163 725 | 6,19 | 9 126 | 5,17 | ||||
| 2025-04-22 | 13F/A | NorthRock Partners, LLC | 0 | −100,00 | 0 | |||||
| 2025-07-31 | 13F | Cambridge Investment Research Advisors, Inc. | 5 266 | −17,32 | 0 | |||||
| 2025-08-01 | 13F | Ashton Thomas Private Wealth, LLC | 13 896 | 775 | ||||||
| 2025-08-06 | 13F | Golden State Wealth Management, LLC | 5 319 | −22,62 | 296 | −23,32 | ||||
| 2025-05-06 | 13F | WESPAC Advisors SoCal, LLC | 0 | −100,00 | 0 | |||||
| 2025-08-14 | 13F | Sherman Asset Management, Inc. | 3 744 | 5,08 | 209 | 4,00 | ||||
| 2025-04-23 | 13F | Integris Wealth Management, LLC | 0 | −100,00 | 0 | |||||
| 2025-07-08 | 13F | 21 West Wealth Management LLC | 29 095 | 1 622 | ||||||
| 2025-07-30 | 13F | LifeWealth Investments, LLC | 15 806 | 0,00 | 881 | −0,90 | ||||
| 2025-08-07 | 13F | Brio Consultants, LLC | 199 252 | −41,21 | 11 106 | −41,78 | ||||
| 2025-08-14 | 13F | Goldman Sachs Group Inc | 100 882 | 1 522,42 | 5 623 | 1 511,17 | ||||
| 2025-08-08 | 13F | Kingsview Wealth Management, LLC | 4 372 | −17,83 | 244 | −18,73 | ||||
| 2025-08-13 | 13F | North Berkeley Wealth Management, LLC | 6 892 | −34,53 | 384 | −35,14 | ||||
| 2025-05-06 | 13F | a16z Perennial Management, L.P. | 0 | −100,00 | 0 | −100,00 | ||||
| 2025-08-05 | 13F | Elyxium Wealth, LLC | 4 333 | −28,57 | 242 | −29,33 | ||||
| 2025-07-09 | 13F | Pacific Capital Wealth Advisors, Inc | 10 189 | −57,18 | 567 | −57,73 | ||||
| 2025-08-14 | 13F | Stifel Financial Corp | 37 886 | 26,08 | 2 112 | 24,84 | ||||
| 2025-07-16 | 13F | Magnus Financial Group LLC | 4 408 | 0,62 | 246 | −0,41 | ||||
| 2025-08-08 | 13F | Union Savings Bank | 6 411 | 6,30 | 355 | 4,72 | ||||
| 2025-08-12 | 13F | Charles Schwab Investment Management Inc | 7 717 458 | −24,78 | 430 171 | −25,51 | ||||
| 2025-06-23 | NP | SRCMX - California Municipal Fund Class A | 702 | 0,00 | 39 | 0,00 | ||||
| 2025-05-09 | 13F | Citizens Financial Group Inc/ri | 0 | −100,00 | 0 | |||||
| 2025-07-25 | 13F | Investment Advisory Group, LLC | 11 400 | 0,00 | 635 | −0,94 | ||||
| 2025-08-14 | 13F | Raymond James Financial Inc | 130 977 | −27,45 | 7 301 | −28,14 | ||||
| 2025-08-13 | 13F | Continuum Advisory, LLC | 0 | −100,00 | 0 | |||||
| 2025-07-11 | 13F | Westfuller Advisors, LLC | 64 463 | 0,02 | 3 593 | −0,94 | ||||
| 2025-08-01 | 13F | Strategic Financial Services, Inc, | 0 | −100,00 | 0 | −100,00 | ||||
| 2025-08-06 | 13F | Longview Financial Advisors LLC | 150 | 78,57 | 8 | 100,00 | ||||
| 2025-08-12 | 13F | Deutsche Bank Ag\ | 80 350 | −30,80 | 4 479 | −31,48 | ||||
| 2025-07-23 | 13F | Valmark Advisers, Inc. | 70 659 | 0,11 | 3 939 | −0,86 | ||||
| 2025-08-06 | 13F | Summit Wealth Group, LLC | 6 436 | 0,00 | 0 | |||||
| 2025-08-13 | 13F | Northwestern Mutual Wealth Management Co | 87 919 | −26,67 | 4 901 | −27,38 | ||||
| 2025-07-16 | 13F | Perigon Wealth Management, LLC | 0 | −100,00 | 0 | |||||
| 2025-08-14 | 13F/A | Rockefeller Capital Management L.P. | 33 988 | 8,91 | 1 895 | 7,86 | ||||
| 2025-05-15 | 13F | Millennium Management Llc | 0 | −100,00 | 0 | −100,00 | ||||
| 2025-08-14 | 13F | Mercer Global Advisors Inc /adv | 382 533 | 23,73 | 21 322 | 22,55 | ||||
| 2025-08-14 | 13F | Citadel Advisors Llc | 34 045 | −8,37 | 1 898 | −9,28 | ||||
| 2025-08-11 | 13F | Bell Investment Advisors, Inc | 18 775 | −74,68 | 1 047 | −74,93 | ||||
| 2025-07-07 | 13F | Vishria Bird Financial Group, LLC | 0 | −100,00 | 0 | |||||
| 2025-07-08 | 13F | ShankerValleau Wealth Advisors, Inc. | 6 185 | 0,00 | 345 | −1,15 | ||||
| 2025-08-05 | 13F | Tme Financial, Inc. | 7 999 | −35,42 | 446 | −36,15 | ||||
| 2025-08-08 | 13F | VERITY Wealth Advisors | 10 915 | 0,00 | 608 | −0,98 | ||||
| 2025-08-12 | 13F | Proequities, Inc. | 0 | 0 | ||||||
| 2025-07-23 | 13F | Steel Peak Wealth Management LLC | 59 865 | 7,95 | 3 337 | 6,89 | ||||
| 2025-08-13 | 13F | Argyle Capital Partners, LLC | 22 853 | −2,28 | 1 274 | −3,27 | ||||
| 2025-07-17 | 13F | Neumann Capital Management, LLC | 0 | −100,00 | 0 | |||||
| 2025-07-17 | 13F | Keystone Global Partners, LLC | 17 106 | −0,61 | 953 | −1,55 | ||||
| 2025-08-12 | 13F | Founders Financial Alliance, LLC | 0 | −100,00 | 0 | |||||
| 2025-08-11 | 13F | First American Trust, Fsb | 95 601 | 7,91 | 5 329 | 6,88 | ||||
| 2025-08-11 | 13F | Tidemark, LLC | 1 050 | 0,00 | 59 | −1,69 | ||||
| 2025-08-11 | 13F | Conquis Financial Llc | 27 072 | 42,88 | 1 509 | 41,46 | ||||
| 2025-08-15 | 13F | WFA of San Diego, LLC | 465 | 26 | ||||||
| 2025-08-14 | 13F | Atomi Financial Group, Inc. | 67 188 | 20,56 | 3 745 | 19,42 | ||||
| 2025-07-22 | 13F | Wealthcare Advisory Partners LLC | 22 698 | 13,60 | 1 265 | 12,54 | ||||
| 2025-08-11 | 13F | Wealthspire Advisors, LLC | 45 622 | −22,99 | 2 543 | −23,73 | ||||
| 2025-07-09 | 13F | Affinity Capital Advisors, LLC | 246 258 | 66,03 | 13 726 | 69,25 | ||||
| 2025-08-12 | 13F | Calton & Associates, Inc. | 0 | −100,00 | 0 | |||||
| 2025-08-05 | 13F | Bank Of Montreal /can/ | 124 879 | −44,39 | 6 961 | −44,93 | ||||
| 2025-08-14 | 13F | Syon Capital Llc | 1 205 909 | −10,43 | 67 217 | −11,29 | ||||
| 2025-08-14 | 13F | Royal Bank Of Canada | 404 780 | −6,98 | 22 562 | −7,88 | ||||
| 2025-08-14 | 13F | Evergreen Capital Management Llc | 38 184 | 11,87 | 2 128 | 10,78 | ||||
| 2025-07-23 | 13F | Morton Capital Management LLC/CA | 3 626 | 0,78 | 202 | 0,00 | ||||
| 2025-08-11 | 13F | Strategic Wealth Partners, Ltd. | 3 095 | 173 | ||||||
| 2025-07-22 | 13F | Team Financial Group, LLC | 33 | 2 | ||||||
| 2025-07-21 | 13F | Empirical Financial Services, LLC d.b.a. Empirical Wealth Management | 24 295 | −28,51 | 1 354 | −29,18 | ||||
| 2025-08-12 | 13F | MAI Capital Management | 27 513 | −15,71 | 1 534 | −16,55 | ||||
| 2025-08-14 | 13F | Wells Fargo & Company/mn | 469 502 | 3,88 | 26 170 | 2,89 | ||||
| 2025-07-24 | 13F | Us Bancorp \de\ | 66 807 | 12,05 | 3 724 | 10,97 | ||||
| 2025-08-13 | 13F | Flow Traders U.s. Llc | 20 956 | 35,91 | 1 | |||||
| 2025-07-08 | 13F | Parallel Advisors, LLC | 27 174 | −68,64 | 1 515 | −68,95 | ||||
| 2025-07-10 | 13F | Wealth Enhancement Advisory Services, Llc | 8 401 | −51,13 | 467 | −51,81 | ||||
| 2025-07-22 | 13F | McNaughton Wealth Management, LLC | 25 472 | −16,67 | 1 420 | −17,50 | ||||
| 2025-07-23 | 13F | Prime Capital Investment Advisors, LLC | 73 417 | −12,60 | 4 092 | −13,43 | ||||
| 2025-07-30 | 13F | Caliber Wealth Management, LLC / KS | 8 164 | 455 | ||||||
| 2025-08-07 | 13F | Shared Vision Wealth Group LLC | 4 507 | −60,33 | 250 | −61,03 | ||||
| 2025-08-15 | 13F | Captrust Financial Advisors | 342 904 | 66,75 | 19 113 | 65,15 | ||||
| 2025-07-15 | 13F | Bank Of Stockton | 72 851 | −5,11 | 4 061 | −6,02 | ||||
| 2025-07-09 | 13F | Dynamic Advisor Solutions LLC | 25 908 | −10,06 | 1 444 | −10,92 | ||||
| 2025-07-03 | 13F | Garde Capital, Inc. | 119 008 | −2,72 | 6 634 | −3,66 | ||||
| 2025-07-22 | 13F | Merit Financial Group, LLC | 39 443 | 2 199 | ||||||
| 2025-08-08 | 13F | Larson Financial Group LLC | 1 671 | 11,40 | 93 | 10,71 | ||||
| 2025-08-14 | 13F | Integrated Wealth Concepts LLC | 34 249 | −7,43 | 1 909 | −8,31 | ||||
| 2025-08-14 | 13F | Mml Investors Services, Llc | 84 955 | 30,99 | 5 | 33,33 | ||||
| 2025-08-11 | 13F | Perennial Investment Advisors, LLC | 7 433 | 26,58 | 414 | 25,45 | ||||
| 2025-08-05 | 13F | Gould Asset Management Llc /ca/ | 42 855 | −12,39 | 2 389 | −13,23 | ||||
| 2025-08-27 | 13F/A | Brinker Capital Investments, LLC | 16 733 | −8,15 | 933 | −9,07 | ||||
| 2025-07-21 | 13F | Ameritas Advisory Services, LLC | 407 | 23 | ||||||
| 2025-08-12 | 13F | Running Point Capital Advisors, LLC | 27 840 | 3,92 | 1 552 | 2,92 | ||||
| 2025-08-15 | 13F | WealthCollab, LLC | 39 113 | 10,34 | 2 180 | 9,27 | ||||
| 2025-07-28 | 13F | WealthPlan Investment Management, LLC | 32 174 | 1 793 | ||||||
| 2025-08-11 | 13F | Rothschild Investment Llc | 750 | 0,00 | 42 | −2,38 | ||||
| 2025-08-12 | 13F | NFP Retirement, Inc. | 4 875 | 0,76 | 272 | −0,37 | ||||
| 2025-07-30 | 13F | Exencial Wealth Advisors, Llc | 4 593 | 2,34 | 256 | 1,59 | ||||
| 2025-08-07 | 13F | Curtis Advisory Group, LLC | 26 294 | 30,80 | 1 466 | 29,53 | ||||
| 2025-08-08 | 13F | Cetera Investment Advisers | 219 757 | −5,67 | 12 249 | −6,57 | ||||
| 2025-08-11 | 13F | Aptus Capital Advisors, LLC | 704 | 0,00 | 39 | 0,00 | ||||
| 2025-08-14 | 13F | Two Sigma Securities, Llc | 4 976 | 277 | ||||||
| 2025-08-14 | 13F | McIlrath & Eck, LLC | 31 810 | 4,34 | 1 773 | 3,38 | ||||
| 2025-07-10 | 13F | IMPACTfolio, LLC | 4 929 | 0,00 | 275 | −1,08 | ||||
| 2025-07-25 | 13F | Atria Wealth Solutions, Inc. | 3 950 | −37,06 | 220 | −37,96 | ||||
| 2025-07-17 | 13F | HB Wealth Management, LLC | 4 491 | 0,00 | 250 | −0,79 | ||||
| 2025-08-06 | 13F | Climber Capital SA | 12 660 | 0,00 | 702 | 14,33 | ||||
| 2025-07-17 | 13F | Halbert Hargrove Global Advisors, Llc | 0 | −100,00 | 0 | |||||
| 2025-08-14 | 13F | Sand Hill Global Advisors, LLC | 89 315 | 4 978 | ||||||
| 2025-07-17 | 13F | HCR Wealth Advisors | 23 987 | 1,01 | 1 337 | 0,07 | ||||
| 2025-07-29 | 13F | Stordahl Capital Management, Inc. | 3 956 | 7,70 | 221 | 6,80 | ||||
| 2025-08-14 | 13F | Fmr Llc | 2 396 725 | −50,34 | 133 593 | −50,82 | ||||
| 2025-08-12 | 13F | LPL Financial LLC | 843 495 | 5,34 | 47 016 | 4,33 | ||||
| 2025-07-11 | 13F | Farther Finance Advisors, LLC | 12 852 | −19,11 | 716 | −19,91 | ||||
| 2025-08-12 | 13F | Atlas Capital Advisors Llc | 8 872 | 14,01 | 495 | 13,04 | ||||
| 2025-08-06 | 13F | Columbia River Financial Group, LLC | 0 | −100,00 | 0 | |||||
| 2025-08-11 | 13F | HighTower Advisors, LLC | 62 835 | 15,31 | 3 502 | 14,22 | ||||
| 2025-08-12 | 13F | O'shaughnessy Asset Management, Llc | 40 133 | 6,13 | 2 237 | 5,12 | ||||
| 2025-08-11 | 13F | Amara Financial, Llc. | 0 | −100,00 | 0 | |||||
| 2025-08-08 | 13F | Omega Financial Group, LLC | 74 949 | 0,00 | 4 178 | −0,97 | ||||
| 2025-07-16 | 13F | Highline Wealth Partners Llc | 6 240 | −9,45 | 348 | −10,34 | ||||
| 2025-07-22 | 13F | Verus Wealth Management, Llc | 6 950 | 387 | ||||||
| 2025-07-25 | 13F | Lodestar Private Asset Management Llc | 60 579 | −6,02 | 3 377 | −6,92 | ||||
| 2025-07-28 | 13F | Heritage Wealth Management, Inc. /CA/ | 47 013 | −3,50 | 2 620 | −4,41 | ||||
| 2025-08-12 | 13F | Ameritas Investment Partners, Inc. | 1 174 | 9,72 | 65 | 8,33 | ||||
| 2025-06-11 | 13F | Fortitude Financial, LLC | 7 552 | 32,63 | 425 | 30,37 | ||||
| 2025-07-25 | 13F | Stonehage Fleming Financial Services Holdings Ltd | 64 521 | 0,00 | 3 596 | −0,96 | ||||
| 2025-08-06 | 13F | Adviser Investments LLC | 344 078 | −1,88 | 19 179 | −2,83 | ||||
| 2025-05-13 | 13F | Financial Advisors Network, Inc. | 0 | −100,00 | 0 | −100,00 | ||||
| 2025-08-15 | 13F | CI Private Wealth, LLC | 13 340 | 246,40 | 744 | 243,98 | ||||
| 2025-07-21 | 13F | Mattern Capital Management, Llc | 11 475 | 2,91 | 640 | 1,91 | ||||
| 2025-07-31 | 13F | Brighton Jones Llc | 8 757 | 0,00 | 488 | −0,81 | ||||
| 2025-07-25 | 13F | Asset Planning,Inc | 700 | 0,00 | 39 | 0,00 | ||||
| 2025-08-14 | 13F | Ameriprise Financial Inc | 235 015 | 25,56 | 13 094 | 24,16 | ||||
| 2025-07-21 | 13F | Creative Capital Management Investments LLC | 32 530 | −35,66 | 1 813 | −36,27 | ||||
| 2025-08-13 | 13F | Beacon Pointe Advisors, LLC | 111 153 | 5,56 | 6 196 | 4,54 | ||||
| 2025-07-30 | 13F | Clune & Associates, Ltd. | 5 044 | 0,00 | 281 | −0,71 | ||||
| 2025-07-14 | 13F | AdvisorNet Financial, Inc | 1 250 | 0,00 | 70 | −1,43 | ||||
| 2025-08-14 | 13F | Alliancebernstein L.p. | 219 598 | 11,76 | 12 240 | 10,69 | ||||
| 2025-07-14 | 13F | GAMMA Investing LLC | 3 691 | −55,85 | 206 | −56,38 | ||||
| 2025-08-14 | 13F | Ieq Capital, Llc | 21 908 | 0,29 | 1 221 | −0,65 | ||||
| 2025-07-18 | 13F | Pure Financial Advisors, Inc. | 192 104 | −2,58 | 10 708 | −3,52 | ||||
| 2025-07-10 | 13F | Sovran Advisors, LLC | 6 838 | −39,12 | 380 | −38,87 | ||||
| 2025-07-16 | 13F | Paragon Capital Management Ltd | 13 065 | 728 | ||||||
| 2025-08-07 | 13F | Bradley & Co. Private Wealth Management, LLC | 3 205 | 0,00 | 179 | −1,11 | ||||
| 2025-07-31 | 13F | Carnegie Capital Asset Management, LLC | 6 812 | 2,05 | 380 | 1,07 | ||||
| 2025-08-13 | 13F | Rosenblum Silverman Sutton S F Inc /ca | 3 980 | 222 | ||||||
| 2025-08-14 | 13F | Sei Investments Co | 274 376 | 12,06 | 15 294 | 10,99 | ||||
| 2025-08-12 | 13F | Umpqua Bank | 61 051 | 67,49 | 3 393 | 65,38 | ||||
| 2025-07-31 | 13F | Wealthfront Advisers Llc | 8 648 197 | −3,39 | 482 051 | −4,32 | ||||
| 2025-09-09 | 13F | NWF Advisory Services Inc. | 12 346 | 688 | ||||||
| 2025-08-14 | 13F | First Foundation Advisors | 521 518 | −1,13 | 29 069 | −2,08 | ||||
| 2025-07-24 | 13F | IFP Advisors, Inc | 1 121 | 0,00 | 62 | −1,59 | ||||
| 2025-04-21 | 13F | Catalina Capital Group, LLC | 0 | −100,00 | 0 | |||||
| 2025-05-15 | 13F/A | Orion Portfolio Solutions, LLC | 18 217 | −14,93 | 1 025 | −16,39 | ||||
| 2025-07-23 | 13F | Values Added Financial LLC | 12 770 | 712 | ||||||
| 2025-08-14 | 13F | Quantinno Capital Management LP | 24 961 | 1 391 | ||||||
| 2025-08-11 | 13F | One Capital Management, LLC | 53 172 | 41,72 | 2 964 | 40,36 | ||||
| 2025-07-18 | 13F | Trilogy Capital Inc. | 6 078 | 339 | ||||||
| 2025-07-17 | 13F | Eclectic Associates Inc /adv | 6 760 | −48,88 | 377 | −49,46 | ||||
| 2025-08-08 | 13F | Altfest L J & Co Inc | 5 218 | 0,00 | 291 | −1,02 | ||||
| 2025-08-07 | 13F | Palisade Asset Management, LLC | 4 281 | 0,00 | 239 | −0,83 | ||||
| 2025-05-09 | 13F | Leisure Capital Management | 0 | −100,00 | 0 | |||||
| 2025-07-16 | 13F | Traveka Wealth, LLC | 75 366 | −3,52 | 4 201 | −4,46 | ||||
| 2025-07-18 | 13F | Northeast Financial Group, Inc. | 9 378 | 29,37 | 523 | 28,26 | ||||
| 2025-07-17 | 13F | Farmers & Merchants Trust Co of Long Beach | 9 060 | −28,72 | 505 | −29,37 | ||||
| 2025-08-05 | 13F | Integrity Financial Corp /WA | 2 667 | 0,00 | 149 | −1,33 | ||||
| 2025-08-14 | 13F | Comerica Bank | 54 601 | 156,73 | 3 043 | 154,43 | ||||
| 2025-07-30 | 13F | Clifford Swan Investment Counsel Llc | 9 260 | 0,00 | 516 | −0,96 | ||||
| 2025-05-15 | 13F | Engineers Gate Manager LP | 0 | −100,00 | 0 | |||||
| 2025-08-13 | 13F | Twin Peaks Wealth Advisors, LLC | 5 684 | 0,00 | 317 | 0,96 | ||||
| 2025-07-28 | 13F | IFC Advisors LLC | 24 169 | 4,05 | 1 347 | 3,06 | ||||
| 2025-08-05 | 13F | Cherry Tree Wealth Management, LLC | 6 311 | −5,37 | 352 | −6,40 | ||||
| 2025-08-08 | 13F | Bailard, Inc. | 1 344 831 | 16,73 | 74 961 | 15,60 | ||||
| 2025-08-07 | 13F | PFG Advisors | 0 | −100,00 | 0 | |||||
| 2025-07-10 | 13F | NorthCrest Asset Manangement, LLC | 0 | −100,00 | 0 | |||||
| 2025-08-07 | 13F | Winthrop Capital Management, LLC | 242 | 0,00 | 0 | |||||
| 2025-07-30 | 13F | Retirement Planning Group | 3 999 | 223 | ||||||
| 2025-07-09 | 13F | Massmutual Trust Co Fsb/adv | 0 | −100,00 | 0 | |||||
| 2025-07-16 | 13F | Tru Independence Asset Management 2, Llc | 12 857 | 8,89 | 717 | 7,83 | ||||
| 2025-08-11 | 13F | Citigroup Inc | 4 300 | 0,00 | 240 | −1,24 | ||||
| 2025-07-21 | 13F | Life Planning Partners, Inc | 8 337 | 0,00 | 465 | −1,07 | ||||
| 2025-08-07 | 13F | Hennion & Walsh Asset Management, Inc. | 8 058 | 33,79 | 449 | 32,84 | ||||
| 2025-07-16 | 13F | Falcon Wealth Planning | 5 947 | −33,15 | 331 | −33,80 | ||||
| 2025-08-26 | 13F | Nautilus Advisors LLC | 7 850 | 0,00 | 438 | −0,91 | ||||
| 2025-08-12 | 13F | CIBC Private Wealth Group, LLC | 9 150 | −46,20 | 510 | −44,98 | ||||
| 2025-07-08 | 13F | Apella Capital, LLC | 54 945 | 29,05 | 3 055 | 30,39 | ||||
| 2025-08-14 | 13F | Cardiff Park Advisors, Llc | 3 011 | 0,77 | 168 | −0,60 | ||||
| 2025-08-13 | 13F | Jones Financial Companies Lllp | 64 082 | 103,45 | 3 566 | 101,64 | ||||
| 2025-07-29 | 13F | Werba Rubin Papier Wealth Management | 16 517 | 39,81 | 921 | 38,55 | ||||
| 2025-07-29 | 13F | Private Trust Co Na | 6 584 | −1,67 | 367 | −2,66 | ||||
| 2025-07-22 | 13F | SOL Capital Management CO | 8 425 | 0 | ||||||
| 2025-07-18 | 13F | SimpliFi, Inc. | 25 836 | 4,73 | 1 440 | 3,75 | ||||
| 2025-08-05 | 13F | Simplex Trading, Llc | 39 | 0 | ||||||
| 2025-08-08 | 13F | Pnc Financial Services Group, Inc. | 351 | 0,00 | 20 | 0,00 | ||||
| 2025-08-08 | 13F | Avantax Advisory Services, Inc. | 80 438 | 33,94 | 4 484 | 32,67 | ||||
| 2025-08-05 | 13F | Navalign, LLC | 174 885 | −11,50 | 9 748 | −12,35 | ||||
| 2025-08-08 | 13F | Meridian Wealth Management, LLC | 6 920 | 13,54 | 386 | 12,24 | ||||
| 2025-07-28 | 13F | Elmwood Wealth Management, Inc. | 66 175 | 1,55 | 3 689 | 0,57 | ||||
| 2025-08-14 | 13F | Trace Wealth Advisors, LLC | 10 452 | 0,00 | 583 | −1,02 | ||||
| 2025-07-23 | 13F | Slow Capital, Inc. | 265 937 | −19,14 | 14 823 | −19,92 | ||||
| 2025-08-05 | 13F | Freestone Capital Holdings, LLC | 71 482 | 3,78 | 3 984 | 2,79 | ||||
| 2025-08-06 | 13F | Quadrant Private Wealth Management, LLC | 3 872 | −11,74 | 216 | −12,60 | ||||
| 2025-08-13 | 13F | Kayne Anderson Rudnick Investment Management Llc | 121 015 | −0,54 | 6 750 | −1,36 | ||||
| 2025-07-31 | 13F | Ballast Advisors Llc | 410 | 1,23 | 23 | 0,00 | ||||
| 2025-08-14 | 13F | Strive Asset Management, LLC | 100 564 | 0,00 | 5 605 | −0,95 | ||||
| 2025-05-06 | 13F | Van Strum & Towne Inc. | 0 | −100,00 | 0 | |||||
| 2025-05-01 | 13F | Manuka Financial, LLC | 0 | −100,00 | 0 | |||||
| 2025-08-11 | 13F | Elequin Capital Lp | 6 090 | 339 | ||||||
| 2025-07-09 | 13F | Towerpoint Wealth, LLC | 26 967 | −0,41 | 1 503 | −1,31 | ||||
| 2025-08-08 | 13F | ERTS Wealth Advisors, LLC | 0 | −100,00 | 0 | |||||
| 2025-09-04 | 13F/A | Advisor Group Holdings, Inc. | 161 632 | −20,61 | 9 017 | −21,32 | ||||
| 2025-07-16 | 13F | Spinnaker Investment Group, LLC | 18 733 | −13,33 | 1 044 | −14,14 | ||||
| 2025-08-05 | 13F | Crestwood Advisors Group LLC | 10 483 | 584 | ||||||
| 2025-08-06 | 13F | Savant Capital, LLC | 8 889 | −51,71 | 495 | −52,17 | ||||
| 2025-08-14 | 13F | EP Wealth Advisors, Inc. | 1 195 011 | −6,24 | 66 610 | −7,14 | ||||
| 2025-07-16 | 13F | St Germain D J Co Inc | 1 200 | 0,00 | 67 | −1,49 | ||||
| 2025-08-06 | 13F | Wedbush Securities Inc | 30 603 | 1,65 | 2 | 0,00 | ||||
| 2025-08-12 | 13F | Financial Advocates Investment Management | 7 080 | −22,99 | 395 | −23,79 | ||||
| 2025-08-08 | 13F | Itau Unibanco Holding S.A. | 18 342 | 126,92 | 1 022 | |||||
| 2025-08-14 | 13F | Foronjy Financial Llc | 28 077 | 1 565 | ||||||
| 2025-08-14 | 13F | Old Mission Capital Llc | 37 803 | 313,15 | 2 107 | 309,92 | ||||
| 2025-05-09 | 13F | Topel & Distasi Wealth Management, LLC | 0 | −100,00 | 0 | |||||
| 2025-05-14 | 13F | Huntington National Bank | 147 | −2,00 | ||||||
| 2025-08-13 | 13F | Brown Advisory Inc | 11 991 | 202,65 | 668 | 200,90 | ||||
| 2025-08-11 | 13F | Aspen Investment Management Inc | 10 631 | −2,30 | 1 | |||||
| 2025-08-14 | 13F | Aqr Capital Management Llc | 0 | −100,00 | 0 | |||||
| 2025-07-31 | 13F | Ndwm Llc | 96 464 | 121,39 | 5 377 | 119,25 | ||||
| 2025-07-29 | 13F | Angeles Wealth Management, Llc | 1 644 | 0,00 | 92 | −1,09 | ||||
| 2025-08-14 | 13F | Smartleaf Asset Management LLC | 21 626 | 178,90 | 1 203 | 176,55 | ||||
| 2025-08-14 | 13F | Destination Wealth Management | 17 901 | −3,24 | 998 | −4,23 | ||||
| 2025-08-07 | 13F | SFE Investment Counsel | 6 098 | −17,43 | 340 | −18,31 | ||||
| 2025-08-14 | 13F | Gerber Kawasaki Wealth & Investment Management | 22 691 | 12,54 | 1 265 | 11,46 | ||||
| 2025-07-16 | 13F | Blue Oak Capital, LLC | 51 098 | −4,72 | 2 848 | −5,63 | ||||
| 2025-08-15 | 13F | Kestra Advisory Services, LLC | 26 357 | 40,36 | 1 469 | 39,11 | ||||
| 2025-07-18 | 13F | Warren Street Wealth Advisors, LLC | 56 593 | 0,81 | 3 154 | −0,16 | ||||
| 2025-07-24 | 13F | Financial Connections Group, Inc. | 166 442 | −13,18 | 9 | −10,00 | ||||
| 2025-08-04 | 13F | Ledyard National Bank | 6 000 | 0,00 | 334 | −0,89 | ||||
| 2025-07-25 | 13F | RHS Financial, LLC | 11 187 | −61,23 | 624 | −61,64 | ||||
| 2025-07-29 | 13F | DeDora Capital, Inc. | 48 159 | 5,43 | 2 684 | 4,44 | ||||
| 2025-08-13 | 13F | Lido Advisors, LLC | 14 585 | −34,32 | 813 | −34,91 | ||||
| 2025-08-13 | 13F | SageView Advisory Group, LLC | 4 315 | 20,53 | 239 | −9,16 | ||||
| 2025-08-12 | 13F | Putnam Fl Investment Management Co | 4 458 | 0,00 | 248 | −0,80 | ||||
| 2025-08-04 | 13F | Creative Financial Designs Inc /adv | 1 100 | 0,00 | 61 | 0,00 | ||||
| 2025-08-15 | 13F | Manhattan West Asset Management, LLC | 337 861 | 0,43 | 18 832 | −0,54 | ||||
| 2025-08-13 | 13F | Hsbc Holdings Plc | 21 899 | −12,15 | 1 221 | −13,04 | ||||
| 2025-07-31 | 13F | Opes Wealth Management LLC | 387 164 | 6,55 | 21 581 | 5,53 | ||||
| 2025-08-15 | 13F | Equitable Holdings, Inc. | 3 921 | −13,71 | 219 | −14,51 | ||||
| 2025-08-06 | 13F | Atlas Legacy Advisors, LLC | 203 783 | 449,70 | 11 359 | 443,97 | ||||
| 2025-08-08 | 13F | Crossmark Global Holdings, Inc. | 4 270 | 0,00 | 238 | −0,83 | ||||
| 2025-08-12 | 13F | Jpmorgan Chase & Co | 519 217 | 5,42 | 28 941 | 4,41 | ||||
| 2025-07-28 | 13F | Davidson Investment Advisors | 21 585 | 43,63 | 1 203 | 42,37 | ||||
| 2025-08-08 | 13F | KM Capital Management Ltd. | 8 919 | 0,76 | 497 | −0,20 | ||||
| 2025-05-13 | 13F | Watts Gwilliam & Co., LLC | 0 | −100,00 | 0 | |||||
| 2025-08-07 | 13F | Tillman Hartley LLC | 18 768 | 0,00 | 1 046 | −0,95 | ||||
| 2025-08-01 | 13F | Facet Wealth, Inc. | 1 278 713 | 24,04 | 70 892 | 23,88 | ||||
| 2025-07-24 | 13F | Williams & Novak, LLC | 17 345 | −59,06 | 967 | −59,46 | ||||
| 2025-08-15 | 13F | Morgan Stanley | 1 776 876 | −2,59 | 99 043 | −3,53 | ||||
| 2025-08-14 | 13F | Bank Of America Corp /de/ | 1 172 106 | −9,37 | 65 333 | −10,23 | ||||
| 2025-08-11 | 13F | Avantax Planning Partners, Inc. | 10 266 | −10,89 | 572 | −11,73 | ||||
| 2025-08-13 | 13F | Fisher Asset Management, LLC | 5 616 | −19,82 | 313 | −20,56 | ||||
| 2025-07-17 | 13F | Johnson Bixby & Associates, LLC | 20 582 | −30,57 | 1 147 | −31,24 | ||||
| 2025-07-23 | 13F | Raub Brock Capital Management LP | 0 | −100,00 | 0 | |||||
| 2025-08-12 | 13F | AlphaCore Capital LLC | 851 | −27,70 | 47 | −28,79 | ||||
| 2025-08-08 | 13F | Taylor, Cottrill, Erickson & Associates, Inc. | 6 350 | 0,00 | 354 | −1,12 | ||||
| 2025-08-06 | 13F | Prospera Financial Services Inc | 0 | −100,00 | 0 | −100,00 | ||||
| 2025-07-11 | 13F | Myecfo, Llc | 227 283 | −0,68 | 12 881 | 0,02 | ||||
| 2025-08-13 | 13F | EverSource Wealth Advisors, LLC | 354 | 0,85 | 20 | 0,00 | ||||
| 2025-07-08 | 13F | Ehrlich Financial Group | 86 680 | −1,46 | 4 832 | −2,40 | ||||
| 2025-07-30 | 13F | Whittier Trust Co | 55 197 | 4,68 | 3 077 | 3,67 | ||||
| 2025-08-14 | 13F | Horizon Investments, LLC | 43 | 0,00 | 2 | 0,00 | ||||
| 2025-08-15 | 13F | Tower Research Capital LLC (TRC) | 6 | 0 | ||||||
| 2025-08-14 | 13F | Fairview Capital Investment Management, Llc | 30 695 | 4,78 | 1 711 | 3,76 | ||||
| 2025-08-06 | 13F | Cornerstone Investment Partners, LLC | 0 | −100,00 | 0 | |||||
| 2025-08-13 | 13F | Guggenheim Capital Llc | 121 282 | 65,59 | 6 760 | 64,00 | ||||
| 2025-07-03 | 13F | Fiduciary Financial Group, Llc | 24 954 | 56,63 | 1 388 | 58,15 | ||||
| 2025-07-17 | 13F | Catalytic Wealth RIA, LLC | 13 406 | 747 | ||||||
| 2025-08-13 | 13F | West Wealth Group, LLC | 240 111 | 16,48 | 13 350 | 15,10 | ||||
| 2025-08-14 | 13F | Summit Trail Advisors, Llc | 65 718 | 3 663 | ||||||
| 2025-08-08 | 13F | Empower Advisory Group, LLC | 27 495 | 7,56 | 1 533 | 6,54 | ||||
| 2025-08-14 | 13F | Qube Research & Technologies Ltd | 7 283 | 189,58 | 406 | 187,23 | ||||
| 2025-07-30 | 13F | Silver Oak Wealth Advisors Services, Llc | 79 545 | 229,58 | 4 434 | 226,44 | ||||
| 2025-08-01 | 13F | Clark Asset Management, LLC | 23 423 | −10,25 | 1 306 | −11,10 | ||||
| 2025-08-14 | 13F | Jane Street Group, Llc | 1 792 639 | 73,74 | 99 922 | 72,08 | ||||
| 2025-08-11 | 13F | Lowe Brockenbrough & Co Inc | 117 | 7 | ||||||
| 2025-05-13 | 13F | Cresset Asset Management, LLC | 0 | −100,00 | 0 | |||||
| 2025-08-14 | 13F | LM Advisors LLC | 16 003 | 0,00 | 1 | |||||
| 2025-08-05 | 13F | Mission Wealth Management, Lp | 80 393 | −18,88 | 4 481 | −19,65 | ||||
| 2025-07-25 | 13F | Cwm, Llc | 123 259 | 16,08 | 7 | 20,00 | ||||
| 2025-08-04 | 13F | Assetmark, Inc | 387 350 | 7,90 | 21 591 | 6,87 | ||||
| 2025-07-10 | 13F | Waypoint Wealth Partners Inc. | 8 000 | 0,00 | 446 | −1,11 | ||||
| 2025-08-14 | 13F | Abound Financial, Llc | 0 | −100,00 | 0 | |||||
| 2025-04-17 | 13F | Vista Wealth Management Group, LLC | 7 845 | −36,11 | 442 | −37,27 | ||||
| 2025-05-14 | 13F | Change Path, LLC | 0 | −100,00 | 0 | |||||
| 2025-08-14 | 13F | Brasada Capital Management, Lp | 14 300 | 795 | ||||||
| 2025-07-17 | 13F | Capital Insight Partners, Llc | 7 937 | −44,38 | 442 | −44,96 | ||||
| 2025-07-21 | 13F | Cliftonlarsonallen Wealth Advisors, Llc | 85 544 | 25,66 | 4 768 | 24,46 | ||||
| 2025-08-07 | 13F | Sanchez Wealth Management Group | 4 810 | −25,94 | 268 | −26,58 | ||||
| 2025-08-12 | 13F | Journey Strategic Wealth Llc | 37 790 | 115,87 | 2 106 | 113,81 | ||||
| 2025-08-14 | 13F | Betterment LLC | 200 986 | 3,03 | 11 | 10,00 | ||||
| 2025-07-25 | 13F | Sequoia Financial Advisors, LLC | 9 080 | 0,00 | 506 | −0,98 | ||||
| 2025-08-13 | 13F | Portfolio Design Labs, LLC | 15 406 | 859 | ||||||
| 2025-08-12 | 13F | Main Management LLC | 1 976 | −1,98 | 0 | |||||
| 2025-08-13 | 13F | Townsquare Capital Llc | 0 | −100,00 | 0 | |||||
| 2025-07-10 | 13F | Shira Ridge Wealth Management | 12 777 | −46,96 | 712 | −47,45 | ||||
| 2025-07-16 | 13F | Signature Resources Capital Management, LLC | 1 853 | 0,00 | 103 | −0,96 | ||||
| 2025-08-07 | 13F | Allworth Financial LP | 15 729 | 0,44 | 877 | 1,27 | ||||
| 2025-08-13 | 13F | Rsm Us Wealth Management Llc | 75 165 | −24,56 | 4 190 | −25,29 | ||||
| 2025-07-30 | 13F | Crewe Advisors LLC | 875 | 0,00 | 49 | −2,04 | ||||
| 2025-08-05 | 13F | Key FInancial Inc | 69 | 4 | ||||||
| 2025-08-11 | 13F | Principal Securities, Inc. | 0 | −100,00 | 0 | |||||
| 2025-08-12 | 13F | Steward Partners Investment Advisory, Llc | 28 420 | 424,74 | 1 584 | 421,05 | ||||
| 2025-05-15 | 13F | Pathstone Holdings, LLC | 0 | −100,00 | 0 | |||||
| 2025-08-05 | 13F | Tiaa Trust, National Association | 732 028 | 31,54 | 40 803 | 30,28 | ||||
| 2025-05-14 | 13F | Prosperitas Financial LLC | 0 | −100,00 | 0 | −100,00 | ||||
| 2025-08-07 | 13F/A | Tortoise Investment Management, LLC | 0 | −100,00 | 0 | |||||
| 2025-08-07 | 13F | Resources Investment Advisors, LLC. | 111 548 | −32,83 | 6 218 | −33,47 | ||||
| 2025-07-22 | 13F | Miracle Mile Advisors, LLC | 116 441 | −2,83 | 6 490 | −3,77 | ||||
| 2025-08-14 | 13F | Safeguard Investment Advisory Group, LLC | 16 275 | −9,88 | 907 | −10,73 | ||||
| 2025-07-23 | 13F | Wise Wealth Partners | 5 796 | 7,97 | 323 | 6,95 | ||||
| 2025-08-11 | 13F | United Capital Financial Advisers, Llc | 43 600 | −56,95 | 2 430 | −57,36 | ||||
| 2025-07-29 | 13F | Stratos Wealth Partners, LTD. | 4 912 | 3,45 | 274 | 2,25 | ||||
| 2025-07-14 | 13F | UMA Financial Services, Inc. | 156 | 0,00 | 9 | 0,00 | ||||
| 2025-07-22 | 13F | Three Bridge Wealth Advisors, LLC | 11 972 | −18,22 | 667 | −18,96 | ||||
| 2025-08-06 | 13F | Commonwealth Equity Services, Llc | 151 129 | −5,40 | 8 | 0,00 | ||||
| 2025-04-29 | 13F | Financial Network Wealth Management LLC | 1 040 | 0 | ||||||
| 2025-07-14 | 13F | Sowell Financial Services LLC | 3 846 | 214 | ||||||
| 2025-08-14 | 13F | Fort Point Capital Partners LLC | 7 129 | 18,40 | 397 | 17,46 | ||||
| 2025-07-29 | 13F | Ariston Services Group | 12 868 | 0,00 | 717 | −0,97 | ||||
| 2025-08-08 | 13F | Client First Capital LLC | 92 578 | 0,00 | 5 160 | −0,96 | ||||
| 2025-07-24 | 13F | True Link Financial Advisors, LLC | 11 810 | −2,88 | 658 | −3,80 | ||||
| 2025-08-14 | 13F | Susquehanna International Group, Llp | 17 655 | −92,82 | 984 | −92,89 | ||||
| 2025-07-24 | 13F | Certus Wealth Management, LLC | 142 019 | −0,00 | 7 916 | 0,19 | ||||
| 2025-07-14 | 13F | Southland Equity Partners LLC | 4 318 | 0,00 | 241 | −1,23 | ||||
| 2025-08-13 | 13F | Renaissance Technologies Llc | 151 300 | 692,15 | 8 433 | 685,20 | ||||
| 2025-08-12 | 13F | Coldstream Capital Management Inc | 4 213 | −51,25 | 235 | −51,85 | ||||
| 2025-07-29 | 13F | Orin Green Financial, LLC | 342 121 | −6,53 | 19 070 | −5,10 | ||||
| 2025-08-12 | 13F | BlackRock, Inc. | 228 353 | −10,21 | 12 728 | −11,07 | ||||
| 2025-08-14 | 13F | UBS Group AG | 577 630 | −19,93 | 32 197 | −20,70 | ||||
| 2025-07-08 | 13F | Boltwood Capital Management | 10 650 | −8,97 | 594 | −9,88 | ||||
| 2025-07-16 | 13F | Instrumental Wealth, Llc | 12 936 | 2,62 | 717 | 2,58 | ||||
| 2025-08-11 | 13F | Greykasell Wealth Strategies, Inc. | 14 621 | 1,48 | 815 | 0,49 | ||||
| 2025-07-25 | 13F | One Degree Advisors Inc | 15 632 | 1 | ||||||
| 2025-07-17 | 13F | Moss Adams Wealth Advisors LLC | 22 250 | 0,00 | 1 240 | −0,96 |