Grunnleggende statistikk
| Institusjonelle eiere | 154 total, 154 long only, 0 short only, 0 long/short - change of −2,53% MRQ |
| Gjennomsnittlig porteføljeallokering | 0.6751 % - change of 0,93% MRQ |
| Institusjonelle aksjer (Long) | 13 602 279 (ex 13D/G) - change of 1,47MM shares 12,09% MRQ |
| Institusjonell verdi (Long) | $ 690 413 USD ($1000) |
Institusjonelt eierskap og aksjonærer
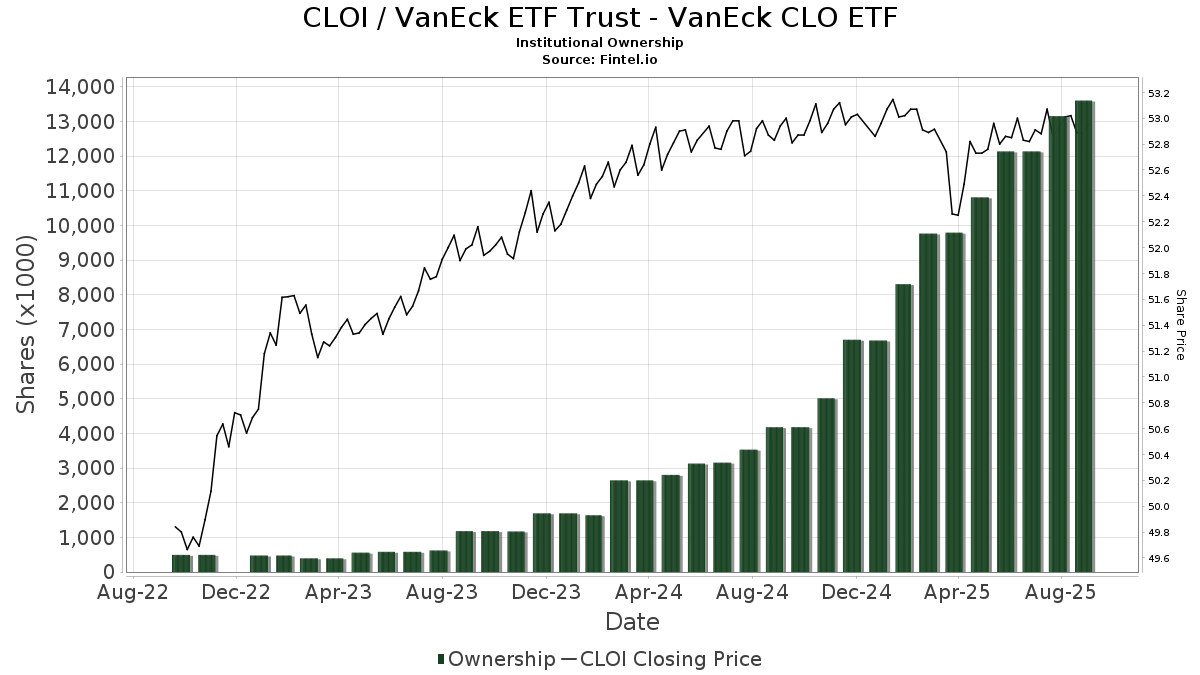
VanEck ETF Trust - VanEck CLO ETF (US:CLOI) har 154 institusjonelle eiere og aksjonærer som har sendt inn 13D/G- eller 13F-skjemaer til Securities Exchange Commission (SEC). Disse institusjonene eier til sammen 13,602,279 aksjer. De største aksjonærene inkluderer LPL Financial LLC, Capital Investment Advisors, LLC, Independence Asset Advisors, LLC, Syon Capital Llc, Orion Portfolio Solutions, LLC, Brinker Capital Investments, LLC, TRUE Private Wealth Advisors, Ferguson Shapiro LLC, WealthPlan Investment Management, LLC, and HighTower Advisors, LLC .
VanEck ETF Trust - VanEck CLO ETF (ARCA:CLOI) institusjonell eierstruktur viser nåværende posisjoner i selskapet fordelt på institusjoner og fond, samt de siste endringene i posisjonsstørrelse. De største aksjonærene kan være individuelle investorer, verdipapirfond, hedgefond eller institusjoner. Schedule 13D indikerer at investoren eier (eller har eid) mer enn 5 % av selskapet og har til hensikt (eller hadde til hensikt) å aktivt forfølge en endring i forretningsstrategien. Schedule 13G indikerer en passiv investering på over 5 %.
The share price as of September 11, 2025 is 52,89 / share. Previously, on September 12, 2024, the share price was 52,83 / share. This represents an increase of 0,11% over that period.
Fondssentiment-score
Fondssentiment Score (også kjent som akkumulering av eierskap poengsum) viser hvilke aksjer som er mest kjøpt av fond. Den er resultatet av en sofistikert, kvantitativ flerfaktormodell som identifiserer selskaper med de høyeste nivåene av institusjonell akkumulering. Beregningsmodellen for poeng bruker en kombinasjon av den totale økningen i antall offentliggjorte eiere, endringer i porteføljeallokeringen til disse eierne og andre beregninger. Tallet går fra 0 til 100, der høyere tall indikerer en høyere grad av akkumulering i forhold til sammenlignbare selskaper, der 50 er gjennomsnittet.
Oppdateringsfrekvens: Daglig
Sjekk ut Ownership Explorer, som inneholder en liste over de høyest rangerte selskapene.
Institusjonell Put/Call-forhold
I tillegg til å rapportere standard aksje- og gjeldsemisjoner må institusjoner med mer enn 100 millioner kroner i forvaltningskapital også oppgi beholdningen av put- og callopsjoner. Siden put-opsjoner generelt indikerer et negativt sentiment, og call-opsjoner indikerer et positivt sentiment, kan vi få et inntrykk av det generelle institusjonelle sentimentet ved å plotte forholdet mellom put- og call-opsjoner. Diagrammet til høyre viser det historiske forholdet mellom put- og call-opsjoner for dette instrumentet.
Ved å bruke Put/Call-forholdet som en indikator på investorsentimentet kan man overvinne en av de viktigste svakhetene ved å bruke totalt institusjonelt eierskap, nemlig at en betydelig andel av forvaltningskapitalen investeres passivt for å følge indekser. Passivt forvaltede fond kjøper vanligvis ikke opsjoner, slik at indikatoren for put/call-forhold i større grad gjenspeiler stemningen i aktivt forvaltede fond.
13F- og NPORT-arkiveringer
Detaljer om 13F-arkiveringer er gratis. Detaljer om NP-arkiveringer krever et premium-medlemskap. Grønne rader indikerer nye posisjoner. Røde rader indikerer lukkede posisjoner. Klikk på lenke ikonet for å se hele transaksjonshistorikken.
Oppgrader
for å låse opp premiedata og eksportere til Excel. ![]() .
.
| Fildato | Kilde | Investor | Type | Gjennomsnittlig pris (estimert) |
Aksjer | Δ Aksjer (%) |
Rapportert verdi ($1000) | Verdi (%) | Portallokering (%) | |
|---|---|---|---|---|---|---|---|---|---|---|
| 2025-05-16 | 13F/A | Kestra Investment Management, LLC | 0 | −100,00 | 0 | |||||
| 2025-08-06 | 13F | Financial Advisory Corp /ut/ /adv | 16 913 | 14,38 | 1 | |||||
| 2025-08-08 | 13F | Gts Securities Llc | 9 194 | −71,44 | 487 | −71,43 | ||||
| 2025-08-12 | 13F | Proequities, Inc. | 0 | 0 | ||||||
| 2025-08-15 | 13F | Tower Research Capital LLC (TRC) | 0 | −100,00 | 0 | |||||
| 2025-07-08 | 13F | Goldstone Financial Group, LLC | 4 061 | 215 | ||||||
| 2025-08-13 | 13F | Jones Financial Companies Lllp | 26 230 | 1 475,38 | 1 391 | 1 497,70 | ||||
| 2025-08-07 | 13F | Allworth Financial LP | 2 627 | 0,96 | 139 | 2,21 | ||||
| 2025-03-12 | 13F | Centaurus Financial, Inc. | 0 | −100,00 | 0 | |||||
| 2025-05-02 | 13F | Kingsview Wealth Management, LLC | 0 | −100,00 | 0 | |||||
| 2025-08-05 | 13F | Carolinas Wealth Consulting Llc | 0 | −100,00 | 0 | −100,00 | ||||
| 2025-08-13 | 13F | Cresset Asset Management, LLC | 11 695 | 619 | ||||||
| 2025-08-14 | 13F | Harwood Advisory Group, LLC | 246 417 | 48,06 | 13 048 | 48,57 | ||||
| 2025-08-14 | 13F | Jane Street Group, Llc | 33 360 | −65,39 | 1 766 | −65,32 | ||||
| 2025-08-06 | 13F | Stonebridge Financial Planning Group, LLC | 18 626 | 73,14 | 986 | 73,59 | ||||
| 2025-08-14 | 13F | Goldman Sachs Group Inc | 52 487 | 2 779 | ||||||
| 2025-07-28 | 13F | Harbour Investments, Inc. | 5 185 | 0,00 | 275 | 0,37 | ||||
| 2025-08-05 | 13F | K.J. Harrison & Partners Inc | 0 | −100,00 | 0 | |||||
| 2025-05-12 | 13F | Independent Advisor Alliance | 0 | −100,00 | 0 | |||||
| 2025-08-07 | 13F | PCG Wealth Advisors, LLC | 0 | −100,00 | 0 | |||||
| 2025-08-13 | 13F | MONECO Advisors, LLC | 0 | −100,00 | 0 | −100,00 | ||||
| 2025-07-24 | 13F | Lokken Investment Group LLC | 142 469 | 2,81 | 7 544 | 3,02 | ||||
| 2025-08-12 | 13F | Coldstream Capital Management Inc | 0 | −100,00 | 0 | |||||
| 2025-08-14 | 13F | Wiley Bros.-aintree Capital, Llc | 10 572 | 560 | ||||||
| 2025-08-04 | 13F | Arkadios Wealth Advisors | 5 001 | −44,50 | 265 | −44,54 | ||||
| 2025-07-25 | 13F | Atria Wealth Solutions, Inc. | 0 | −100,00 | 0 | |||||
| 2025-07-25 | 13F | Cwm, Llc | 254 | 1,20 | 0 | |||||
| 2025-08-11 | 13F | Western Wealth Management, LLC | 23 956 | 1 268 | ||||||
| 2025-08-06 | 13F | Commonwealth Equity Services, Llc | 11 155 | 1 | ||||||
| 2025-08-12 | 13F | Integras Partners LLC | 81 858 | −42,33 | 4 334 | −42,21 | ||||
| 2025-07-30 | 13F | TFB Advisors LLC | 0 | −100,00 | 0 | |||||
| 2025-08-14 | 13F | Mariner, LLC | 55 077 | 2 916 | ||||||
| 2025-08-14 | 13F | IHT Wealth Management, LLC | 21 634 | −15,54 | 1 146 | −15,37 | ||||
| 2025-05-16 | 13F | Coppell Advisory Solutions LLC | 0 | −100,00 | 0 | |||||
| 2025-07-08 | 13F/A | Salem Investment Counselors Inc | 300 | 0,00 | 16 | 0,00 | ||||
| 2025-08-11 | 13F | TRUE Private Wealth Advisors | 360 791 | 4,06 | 19 104 | 4,27 | ||||
| 2025-08-15 | 13F | Global View Capital Management LLC | 0 | −100,00 | 0 | |||||
| 2025-08-07 | 13F | Proficio Capital Partners LLC | 0 | −100,00 | 0 | |||||
| 2025-08-13 | 13F | Transce3nd, LLC | 822 | −23,11 | 44 | −23,21 | ||||
| 2025-08-14 | 13F | GWM Advisors LLC | 55 364 | 181,42 | 2 932 | 182,10 | ||||
| 2025-07-16 | 13F | Castleview Partners, Llc | 38 841 | −11,26 | 2 057 | −11,07 | ||||
| 2025-07-10 | 13F | CWC Advisors, LLC. | 126 171 | 1,21 | 6 681 | 1,43 | ||||
| 2025-08-04 | 13F | Integrity Alliance, Llc. | 79 564 | −1,69 | 4 213 | −1,50 | ||||
| 2025-08-13 | 13F | Coco Enterprises, LLC | 46 792 | 4,91 | 2 478 | 7,46 | ||||
| 2025-08-14 | 13F | CoreCap Advisors, LLC | 10 551 | −71,00 | 559 | −70,97 | ||||
| 2025-08-12 | 13F | Steward Partners Investment Advisory, Llc | 9 949 | 1 134,37 | 527 | 1 152,38 | ||||
| 2025-08-12 | 13F | Wayfinding Financial, LLC | 54 504 | −37,80 | 3 | −50,00 | ||||
| 2025-07-23 | 13F | Sax Wealth Advisors, Llc | 115 680 | 1 592,71 | 6 125 | 1 596,68 | ||||
| 2025-08-11 | 13F | HighTower Advisors, LLC | 301 713 | 15,58 | 15 976 | 15,82 | ||||
| 2025-05-01 | 13F | Quest 10 Wealth Builders, Inc. | 5 606 | 21,79 | 296 | 22,31 | ||||
| 2025-08-04 | 13F | Atria Investments Llc | 57 835 | −17,88 | 3 062 | −17,71 | ||||
| 2025-07-30 | 13F | LifeWealth Investments, LLC | 5 588 | −6,56 | 296 | −6,35 | ||||
| 2025-08-14 | 13F | Sunbelt Securities, Inc. | 4 618 | 24,24 | 244 | 23,98 | ||||
| 2025-08-01 | 13F | Wealth Watch Advisors, INC | 6 012 | 5,60 | 318 | 6,00 | ||||
| 2025-08-08 | 13F | Avantax Advisory Services, Inc. | 0 | −100,00 | 0 | |||||
| 2025-08-11 | 13F | Summit Wealth Partners, LLC | 8 398 | −8,05 | 445 | −7,88 | ||||
| 2025-08-04 | 13F | Assetmark, Inc | 2 923 | −98,54 | 155 | −98,54 | ||||
| 2025-08-14 | 13F | Quantinno Capital Management LP | 7 561 | 400 | ||||||
| 2025-08-12 | 13F | Allen Capital Group, LLC | 37 321 | 14,99 | 1 976 | 15,29 | ||||
| 2025-08-13 | 13F | PineBridge Investments, L.P. | 271 852 | 14 395 | ||||||
| 2025-07-28 | 13F | Kiker Wealth Management, LLC | 1 407 | 2,18 | 75 | 2,78 | ||||
| 2025-08-01 | 13F | Ferguson Shapiro LLC | 323 062 | 98,19 | 17 106 | 98,61 | ||||
| 2025-08-06 | 13F | AE Wealth Management LLC | 176 198 | −20,96 | 9 330 | −20,80 | ||||
| 2025-07-10 | 13F | Wealth Enhancement Advisory Services, Llc | 154 672 | 8 185 | ||||||
| 2025-07-23 | 13F | WESPAC Advisors, LLC | 6 472 | −89,18 | 343 | −89,17 | ||||
| 2025-07-31 | 13F | Trademark Financial Management, LLC | 82 488 | −7,24 | 4 368 | −7,05 | ||||
| 2025-08-26 | 13F/A | Thrivent Financial For Lutherans | 100 010 | 5 | ||||||
| 2025-08-13 | 13F | Continuum Advisory, LLC | 0 | −100,00 | 0 | |||||
| 2025-07-09 | 13F | Breakwater Capital Group | 34 335 | 1 818 | ||||||
| 2025-04-23 | 13F | SFG Wealth Management, LLC. | 0 | −100,00 | 0 | |||||
| 2025-07-10 | 13F | Financial Management Network Inc | 79 320 | −1,64 | 4 198 | 0,02 | ||||
| 2025-08-01 | 13F | Envestnet Asset Management Inc | 71 200 | −85,33 | 3 760 | −85,34 | ||||
| 2025-08-14 | 13F | Mercer Global Advisors Inc /adv | 25 633 | 0,19 | 1 357 | 0,44 | ||||
| 2025-08-14 | 13F | RMB Capital Management, LLC | 165 842 | 1,96 | 8 781 | 2,18 | ||||
| 2025-07-09 | 13F | VisionPoint Advisory Group, LLC | 24 470 | −1,81 | 1 296 | −1,60 | ||||
| 2025-08-14 | 13F | Mml Investors Services, Llc | 201 040 | −2,53 | 11 | 0,00 | ||||
| 2025-08-06 | 13F | Black Swift Group, LLC | 22 435 | −26,65 | 1 188 | −26,55 | ||||
| 2025-08-14 | 13F | Mpwm Advisory Solutions, Llc | 52 419 | 5,23 | 2 776 | 5,43 | ||||
| 2025-08-27 | 13F/A | Brinker Capital Investments, LLC | 635 803 | −2,03 | 33 666 | −1,83 | ||||
| 2025-07-15 | 13F | Heritage Oak Wealth Advisors Llc | 11 976 | −78,38 | 634 | −78,34 | ||||
| 2025-07-24 | 13F | IFP Advisors, Inc | 10 487 | 9,71 | 555 | 9,90 | ||||
| 2025-07-29 | 13F | Creekside Partners | 3 943 | 209 | ||||||
| 2025-08-14 | 13F | Hilltop Holdings Inc. | 0 | −100,00 | 0 | |||||
| 2025-07-15 | 13F | FLP Wealth Management, LLC | 0 | −100,00 | 0 | |||||
| 2025-07-09 | 13F | Massmutual Trust Co Fsb/adv | 0 | −100,00 | 0 | |||||
| 2025-07-16 | 13F | Beaumont Financial Advisors, LLC | 210 615 | −11,74 | 11 152 | −11,56 | ||||
| 2025-08-14 | 13F | Susquehanna International Group, Llp | 5 517 | 292 | ||||||
| 2025-05-08 | 13F | NorthRock Partners, LLC | 0 | −100,00 | 0 | −100,00 | ||||
| 2025-07-18 | 13F | B.O.S.S. Retirement Advisors, LLC | 18 973 | −26,90 | 1 005 | −26,77 | ||||
| 2025-08-07 | 13F | Ascension Capital Advisors, Inc. | 4 039 | 214 | ||||||
| 2025-08-28 | NP | SSIZX - Sierra Tactical Core Income Fund Class A Shares | 265 100 | 951,98 | 14 037 | 952,25 | ||||
| 2025-07-14 | 13F | IronOak Wealth LLC. | 39 515 | −34,50 | 2 092 | −34,28 | ||||
| 2025-08-14 | 13F | Financial Advisory Service, Inc. | 1 541 | −8,00 | 82 | −7,95 | ||||
| 2025-08-04 | 13F | Deseret Mutual Benefit Administrators | 211 990 | 23,46 | 11 225 | 23,72 | ||||
| 2025-07-29 | 13F | Private Trust Co Na | 1 250 | 66 | ||||||
| 2025-07-25 | 13F | Richardson Financial Services Inc. | 0 | −100,00 | 0 | |||||
| 2025-08-13 | 13F | Trustmark National Bank Trust Department | 14 779 | 3,30 | 783 | 3,58 | ||||
| 2025-08-14 | 13F | Syon Capital Llc | 791 212 | −7,13 | 41 895 | −6,93 | ||||
| 2025-08-15 | 13F | Sugar Maple Asset Management, LLC | 72 685 | 3,46 | 3 849 | 3,66 | ||||
| 2025-08-01 | 13F | Winebrenner Capital Management Llc | 12 138 | 41,80 | 643 | 42,04 | ||||
| 2025-07-22 | 13F | Valley National Advisers Inc | 205 | 0,00 | 0 | |||||
| 2025-07-14 | 13F | Sentinel Pension Advisors Inc | 154 157 | 828,88 | 8 163 | 831,74 | ||||
| 2025-04-30 | 13F | Sofos Investments, Inc. | 14 | 1 300,00 | 1 | |||||
| 2025-07-10 | 13F | Redhawk Wealth Advisors, Inc. | 7 633 | −98,80 | 404 | −98,80 | ||||
| 2025-08-14 | 13F | Clark Capital Management Group, Inc. | 0 | −100,00 | 0 | |||||
| 2025-08-11 | 13F | Portside Wealth Group, LLC | 5 682 | 26,66 | 301 | 26,58 | ||||
| 2025-07-29 | 13F | Independence Asset Advisors, LLC | 1 099 620 | 547,57 | 58 218 | 549,39 | ||||
| 2025-08-12 | 13F | J.w. Cole Advisors, Inc. | 149 481 | 7,31 | 7 915 | 7,54 | ||||
| 2025-08-08 | 13F/A | Sterling Capital Management LLC | 9 | −25,00 | 0 | |||||
| 2025-08-12 | 13F | MAI Capital Management | 10 721 | 48,20 | 568 | 48,43 | ||||
| 2025-07-30 | 13F | Strategic Blueprint, LLC | 0 | −100,00 | 0 | |||||
| 2025-05-20 | 13F/A | Colony Group, LLC | 0 | −100,00 | 0 | |||||
| 2025-08-14 | 13F | Royal Bank Of Canada | 32 227 | 256,26 | 1 706 | 256,90 | ||||
| 2025-07-22 | 13F | Simplicity Wealth,LLC | 0 | −100,00 | 0 | |||||
| 2025-08-05 | 13F | Milestone Asset Management, Llc | 16 872 | −7,18 | 893 | −6,98 | ||||
| 2025-08-11 | 13F | Pineridge Advisors LLC | 134 | −26,37 | 7 | −22,22 | ||||
| 2025-08-13 | 13F | Townsquare Capital Llc | 0 | −100,00 | 0 | |||||
| 2025-08-04 | 13F | Bay Colony Advisory Group, Inc d/b/a Bay Colony Advisors | 0 | −100,00 | 0 | −100,00 | ||||
| 2025-08-04 | 13F | Impact Partnership Wealth, LLC | 12 592 | 667 | ||||||
| 2025-07-29 | 13F | Stratos Wealth Partners, LTD. | 0 | −100,00 | 0 | −100,00 | ||||
| 2025-08-14 | 13F | Hrt Financial Lp | 32 574 | 2 | ||||||
| 2025-08-14 | 13F | Fwl Investment Management, Llc | 216 | 0,00 | 11 | 0,00 | ||||
| 2025-07-17 | 13F | Raleigh Capital Management Inc. | 0 | −100,00 | 0 | |||||
| 2025-07-17 | 13F | Paradigm Financial Partners, Llc | 16 371 | 27,45 | 867 | 27,73 | ||||
| 2025-08-12 | 13F | Park Square Financial Group, LLC | 2 082 | −22,14 | 110 | −21,99 | ||||
| 2025-08-14 | 13F | Van Eck Associates Corp | 452 | 0,00 | 0 | |||||
| 2025-07-16 | 13F | RWM Asset Management, LLC | 0 | −100,00 | 0 | |||||
| 2025-07-29 | 13F | Balboa Wealth Partners | 6 273 | −5,61 | 332 | −5,41 | ||||
| 2025-08-11 | 13F | Perennial Investment Advisors, LLC | 6 455 | −9,05 | 342 | −8,82 | ||||
| 2025-07-21 | 13F | Ameritas Advisory Services, LLC | 3 345 | 177 | ||||||
| 2025-08-12 | 13F | AlphaCore Capital LLC | 11 374 | 20,49 | 602 | 20,88 | ||||
| 2025-08-11 | 13F | Principal Securities, Inc. | 95 | −73,76 | 5 | −73,68 | ||||
| 2025-07-28 | 13F | WealthPLAN Partners, LLC | 166 043 | −13,95 | 8 792 | −13,77 | ||||
| 2025-07-23 | 13F | REAP Financial Group, LLC | 0 | −100,00 | 0 | |||||
| 2025-08-18 | 13F | Geneos Wealth Management Inc. | 153 503 | 28,49 | 8 128 | 28,75 | ||||
| 2025-07-15 | 13F | Sheets Smith Wealth Management | 4 500 | −6,25 | 238 | −5,93 | ||||
| 2025-07-30 | 13F | Eqis Capital Management, Inc. | 4 770 | −71,14 | 253 | −71,13 | ||||
| 2025-08-12 | 13F | Ameritas Investment Partners, Inc. | 90 | 5 | ||||||
| 2025-08-14 | 13F | Warren Averett Asset Management, LLC | 11 893 | 0,21 | 630 | 0,32 | ||||
| 2025-08-14 | 13F | Ancora Advisors, LLC | 65 643 | 6,12 | 3 476 | 6,33 | ||||
| 2025-08-05 | 13F | Optivise Advisory Services LLC | 11 702 | 10,58 | 620 | 10,73 | ||||
| 2025-07-18 | 13F | Bartlett & Co. Wealth Management Llc | 3 775 | 200 | ||||||
| 2025-07-30 | 13F | Brookstone Capital Management | 286 458 | −4,48 | 15 168 | −4,28 | ||||
| 2025-08-12 | 13F | Jpmorgan Chase & Co | 5 | −99,99 | 0 | −100,00 | ||||
| 2025-07-28 | 13F | WealthPlan Investment Management, LLC | 312 471 | 20,98 | 16 545 | 21,23 | ||||
| 2025-07-14 | 13F | Iams Wealth Management, Llc | 11 981 | −7,74 | 634 | −7,58 | ||||
| 2025-08-14 | 13F | Advisor OS, LLC | 38 737 | 33,59 | 2 051 | 33,88 | ||||
| 2025-07-31 | 13F | Cambridge Investment Research Advisors, Inc. | 94 327 | −5,59 | 5 | −20,00 | ||||
| 2025-07-29 | 13F | Mattson Financial Services, LLC | 0 | −100,00 | 0 | |||||
| 2025-05-15 | 13F/A | Orion Portfolio Solutions, LLC | 648 991 | −2,11 | 34 293 | −1,98 | ||||
| 2025-07-16 | 13F | Maridea Wealth Management LLC | 134 247 | 0,33 | 7 108 | 0,54 | ||||
| 2025-08-14 | 13F | Arete Wealth Advisors, LLC | 27 337 | −4,47 | 1 | 0,00 | ||||
| 2025-08-15 | 13F | Kestra Advisory Services, LLC | 4 231 | 36,09 | 224 | 36,59 | ||||
| 2025-05-09 | 13F | GeoWealth Management, LLC | 0 | −100,00 | 0 | |||||
| 2025-08-05 | 13F | BEAM Asset Management, LLC | 0 | −100,00 | 0 | |||||
| 2025-08-14 | 13F | Two Sigma Securities, Llc | 0 | −100,00 | 0 | |||||
| 2025-08-14 | 13F | Visionary Wealth Advisors | 86 777 | 27,40 | 4 595 | 27,65 | ||||
| 2025-07-18 | 13F | Truist Financial Corp | 14 615 | −5,53 | 774 | −5,39 | ||||
| 2025-08-13 | 13F | Northwestern Mutual Wealth Management Co | 0 | −100,00 | 0 | |||||
| 2025-08-11 | 13F | Elequin Capital Lp | 4 084 | 216 | ||||||
| 2025-05-13 | 13F | CacheTech Inc. | 26 280 | 3,52 | 1 389 | 3,66 | ||||
| 2025-08-14 | 13F | Harvest Investment Services, LLC | 178 345 | −4,85 | 9 443 | −4,65 | ||||
| 2025-05-13 | 13F | Adams Wealth Management | 26 280 | 3,52 | 1 389 | 3,66 | ||||
| 2025-07-25 | 13F | Envestnet Portfolio Solutions, Inc. | 0 | −100,00 | 0 | |||||
| 2025-07-24 | 13F | Us Bancorp \de\ | 0 | −100,00 | 0 | |||||
| 2025-07-28 | 13F | Mutual Advisors, LLC | 26 867 | −0,71 | 1 427 | 0,42 | ||||
| 2025-08-12 | 13F | LPL Financial LLC | 1 313 075 | 2,32 | 69 527 | 2,54 | ||||
| 2025-07-14 | 13F | Chris Bulman Inc | 8 852 | −3,93 | 469 | −3,70 | ||||
| 2025-07-08 | 13F | Gradient Investments LLC | 277 737 | 0,77 | 14 706 | 0,99 | ||||
| 2025-08-11 | 13F | Private Advisor Group, LLC | 17 086 | 25,07 | 905 | 25,38 | ||||
| 2025-08-08 | 13F | Financial Gravity Companies, Inc. | 14 | 0,00 | 1 | |||||
| 2025-08-08 | 13F | Crossmark Global Holdings, Inc. | 29 012 | −0,68 | 1 537 | −0,58 | ||||
| 2025-07-14 | 13F | Cathy Pareto & Associates, Inc | 20 916 | 40,14 | 1 108 | 40,48 | ||||
| 2025-08-12 | 13F | CIBC Private Wealth Group, LLC | 0 | −100,00 | 0 | |||||
| 2025-08-11 | 13F | NewEdge Wealth, LLC | 78 881 | 4 170 | ||||||
| 2025-08-05 | 13F | Scarborough Advisors, LLC | 278 | 15 | ||||||
| 2025-08-07 | 13F | Mosaic Financial Group, Llc | 7 062 | 33,27 | 0 | |||||
| 2025-07-17 | 13F/A | Capital Investment Advisors, LLC | 1 286 977 | 14,65 | 68 145 | 14,89 | ||||
| 2025-08-13 | 13F | Flow Traders U.s. Llc | 14 446 | 1 | ||||||
| 2025-04-17 | 13F | Authentikos Wealth Advisory, LLC | 0 | −100,00 | 0 | |||||
| 2025-08-14 | 13F | Comerica Bank | 612 | −17,85 | 32 | −17,95 | ||||
| 2025-08-14 | 13F | UBS Group AG | 0 | −100,00 | 0 | |||||
| 2025-08-11 | 13F | FSA Wealth Management LLC | 1 200 | 0,00 | 64 | 0,00 | ||||
| 2025-09-04 | 13F/A | Advisor Group Holdings, Inc. | 99 291 | 139,58 | 5 252 | 139,93 | ||||
| 2025-04-21 | 13F | PSI Advisors, LLC | 0 | −100,00 | 0 | |||||
| 2025-08-04 | 13F | Spire Wealth Management | 55 | 1,85 | 3 | 0,00 | ||||
| 2025-08-07 | 13F | Kestra Private Wealth Services, Llc | 45 346 | 2 401 | ||||||
| 2025-08-12 | 13F | Global Retirement Partners, LLC | 276 | 1,47 | 15 | 0,00 | ||||
| 2025-07-15 | 13F | Fifth Third Bancorp | 375 | 0,00 | 20 | 0,00 | ||||
| 2025-08-14 | 13F | Kovitz Investment Group Partners, LLC | 97 391 | −0,60 | 5 157 | −0,41 | ||||
| 2025-08-25 | 13F | Fulcrum Equity Management | 0 | −100,00 | 0 | |||||
| 2025-07-25 | 13F | We Are One Seven, LLC | 8 217 | −7,15 | 435 | −6,85 | ||||
| 2025-08-14 | 13F | Citadel Advisors Llc | 28 055 | −61,42 | 1 486 | −61,35 | ||||
| 2025-08-12 | 13F | Richmond Investment Services, LLC | 44 554 | 113,10 | 2 359 | 113,68 | ||||
| 2025-08-05 | 13F | Sigma Planning Corp | 4 398 | −6,86 | 233 | −6,83 | ||||
| 2025-07-08 | 13F | Lowe Wealth Advisors, LLC | 10 411 | 4,43 | 551 | 4,75 | ||||
| 2025-08-15 | 13F/A | Symphony Financial, Ltd. Co. | 12 145 | 642 | ||||||
| 2025-08-15 | 13F | Morgan Stanley | 459 | 129,50 | 24 | 140,00 | ||||
| 2025-08-12 | 13F | TCP Asset Management, LLC | 34 666 | 2,06 | 1 836 | 2,29 | ||||
| 2025-07-15 | 13F | Armis Advisers, LLC | 27 863 | 20,99 | 1 474 | 21,22 |