Grunnleggende statistikk
| Institusjonelle eiere | 128 total, 128 long only, 0 short only, 0 long/short - change of −2,29% MRQ |
| Gjennomsnittlig porteføljeallokering | 0.2974 % - change of 23,61% MRQ |
| Institusjonelle aksjer (Long) | 41 336 195 (ex 13D/G) - change of 12,81MM shares 44,92% MRQ |
| Institusjonell verdi (Long) | $ 275 548 USD ($1000) |
Institusjonelt eierskap og aksjonærer
Cornerstone Strategic Investment Fund, Inc. (US:CLM) har 128 institusjonelle eiere og aksjonærer som har sendt inn 13D/G- eller 13F-skjemaer til Securities Exchange Commission (SEC). Disse institusjonene eier til sammen 41,336,195 aksjer. De største aksjonærene inkluderer Alpine Global Management, LLC, Boothbay Fund Management, Llc, Sit Investment Associates Inc, Advisor Group Holdings, Inc., Sculptor Capital LP, Rivernorth Capital Management, Llc, LPL Financial LLC, Absolute Investment Advisers Llc, Yakira Capital Management, Inc., and Thomas J. Herzfeld Advisors, Inc. .
Cornerstone Strategic Investment Fund, Inc. (NYSEAM:CLM) institusjonell eierstruktur viser nåværende posisjoner i selskapet fordelt på institusjoner og fond, samt de siste endringene i posisjonsstørrelse. De største aksjonærene kan være individuelle investorer, verdipapirfond, hedgefond eller institusjoner. Schedule 13D indikerer at investoren eier (eller har eid) mer enn 5 % av selskapet og har til hensikt (eller hadde til hensikt) å aktivt forfølge en endring i forretningsstrategien. Schedule 13G indikerer en passiv investering på over 5 %.
The share price as of September 9, 2025 is 8,20 / share. Previously, on September 10, 2024, the share price was 7,52 / share. This represents an increase of 9,04% over that period.

Fondssentiment-score
Fondssentiment Score (også kjent som akkumulering av eierskap poengsum) viser hvilke aksjer som er mest kjøpt av fond. Den er resultatet av en sofistikert, kvantitativ flerfaktormodell som identifiserer selskaper med de høyeste nivåene av institusjonell akkumulering. Beregningsmodellen for poeng bruker en kombinasjon av den totale økningen i antall offentliggjorte eiere, endringer i porteføljeallokeringen til disse eierne og andre beregninger. Tallet går fra 0 til 100, der høyere tall indikerer en høyere grad av akkumulering i forhold til sammenlignbare selskaper, der 50 er gjennomsnittet.
Oppdateringsfrekvens: Daglig
Sjekk ut Ownership Explorer, som inneholder en liste over de høyest rangerte selskapene.
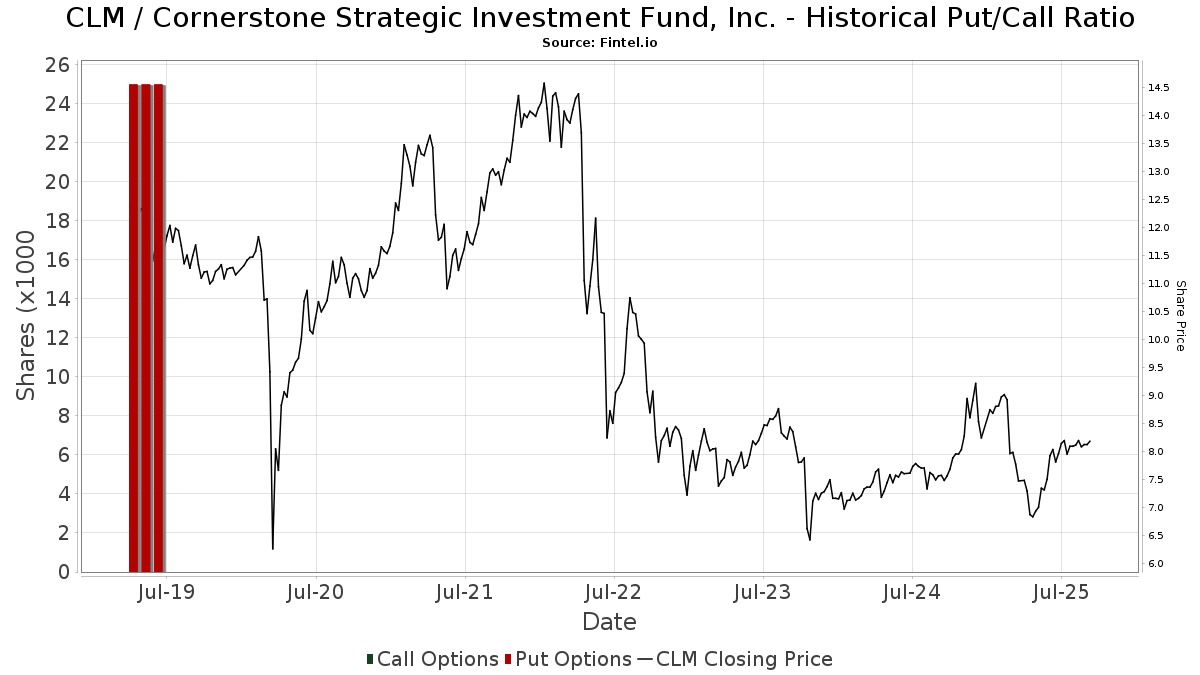
Institusjonell Put/Call-forhold
I tillegg til å rapportere standard aksje- og gjeldsemisjoner må institusjoner med mer enn 100 millioner kroner i forvaltningskapital også oppgi beholdningen av put- og callopsjoner. Siden put-opsjoner generelt indikerer et negativt sentiment, og call-opsjoner indikerer et positivt sentiment, kan vi få et inntrykk av det generelle institusjonelle sentimentet ved å plotte forholdet mellom put- og call-opsjoner. Diagrammet til høyre viser det historiske forholdet mellom put- og call-opsjoner for dette instrumentet.
Ved å bruke Put/Call-forholdet som en indikator på investorsentimentet kan man overvinne en av de viktigste svakhetene ved å bruke totalt institusjonelt eierskap, nemlig at en betydelig andel av forvaltningskapitalen investeres passivt for å følge indekser. Passivt forvaltede fond kjøper vanligvis ikke opsjoner, slik at indikatoren for put/call-forhold i større grad gjenspeiler stemningen i aktivt forvaltede fond.
13F- og NPORT-arkiveringer
Detaljer om 13F-arkiveringer er gratis. Detaljer om NP-arkiveringer krever et premium-medlemskap. Grønne rader indikerer nye posisjoner. Røde rader indikerer lukkede posisjoner. Klikk på lenke ikonet for å se hele transaksjonshistorikken.
Oppgrader
for å låse opp premiedata og eksportere til Excel. ![]() .
.
| Fildato | Kilde | Investor | Type | Gjennomsnittlig pris (estimert) |
Aksjer | Δ Aksjer (%) |
Rapportert verdi ($1000) | Verdi (%) | Portallokering (%) | |
|---|---|---|---|---|---|---|---|---|---|---|
| 2025-08-14 | 13F | Garden State Investment Advisory Services LLC | 61 706 | 21,56 | 501 | 32,89 | ||||
| 2025-08-14 | 13F | Sunbelt Securities, Inc. | 1 181 | −4,83 | 10 | 11,11 | ||||
| 2025-08-14 | 13F/A | Rockefeller Capital Management L.P. | 25 702 | −5,17 | 209 | 3,48 | ||||
| 2025-08-14 | 13F | Boothbay Fund Management, Llc | 6 135 929 | 3,99 | 49 824 | 13,64 | ||||
| 2025-07-21 | 13F | Clarity Capital Partners LLC | 14 089 | −78,71 | 114 | −76,78 | ||||
| 2025-07-08 | 13F | Nbc Securities, Inc. | 18 455 | 0,00 | 0 | |||||
| 2025-08-14 | 13F | Ursa Fund Management, LLC | 275 000 | 1 000,00 | 2 233 | 1 107,03 | ||||
| 2025-08-12 | 13F | RPG Investment Advisory, LLC | 0 | −100,00 | 0 | |||||
| 2025-05-15 | 13F | Tower Research Capital LLC (TRC) | 0 | −100,00 | 0 | |||||
| 2025-08-14 | 13F | Banque Transatlantique SA | 0 | −100,00 | 0 | |||||
| 2025-07-10 | 13F | Marshall Financial Group LLC | 10 000 | 0,00 | 82 | 9,46 | ||||
| 2025-08-14 | 13F | UBS Group AG | 23 194 | −56,53 | 188 | −52,53 | ||||
| 2025-08-26 | 13F/A | Thrivent Financial For Lutherans | 145 939 | 45,28 | 1 | |||||
| 2025-07-01 | 13F | Harbor Investment Advisory, Llc | 11 204 | 0,00 | 91 | 8,43 | ||||
| 2025-08-19 | 13F | Newbridge Financial Services Group, Inc. | 10 000 | 81 | ||||||
| 2025-07-25 | 13F | Sequoia Financial Advisors, LLC | 21 400 | −2,73 | 174 | 6,13 | ||||
| 2025-08-12 | 13F | Global Retirement Partners, LLC | 0 | −100,00 | 0 | |||||
| 2025-08-29 | 13F | Evolution Wealth Management Inc. | 19 425 | 158 | ||||||
| 2025-07-14 | 13F | Buska Wealth Management, LLC | 18 017 | 9,07 | 146 | 19,67 | ||||
| 2025-07-29 | 13F | Stratos Wealth Partners, LTD. | 548 477 | 49,72 | 4 454 | 63,65 | ||||
| 2025-08-04 | 13F | Assetmark, Inc | 1 971 | −68,38 | 16 | −65,22 | ||||
| 2025-08-11 | 13F | Anfield Capital Management, LLC | 6 528 | 0,00 | 53 | 10,42 | ||||
| 2025-07-08 | 13F/A | Salem Investment Counselors Inc | 700 | 0,00 | 6 | 0,00 | ||||
| 2025-05-12 | 13F | Independent Advisor Alliance | 0 | −100,00 | 0 | |||||
| 2025-08-14 | 13F | Benjamin Edwards Inc | 109 511 | −10,65 | 889 | −2,31 | ||||
| 2025-08-13 | 13F | Yakira Capital Management, Inc. | 1 197 769 | 80,72 | 9 726 | 97,50 | ||||
| 2025-08-14 | 13F | Ameriprise Financial Inc | 15 916 | 0,00 | 129 | 9,32 | ||||
| 2025-08-01 | 13F | Envestnet Asset Management Inc | 45 212 | −12,29 | 367 | −4,18 | ||||
| 2025-08-05 | 13F | GPS Wealth Strategies Group, LLC | 8 010 | 17,62 | 65 | 30,00 | ||||
| 2025-08-14 | 13F | Alpine Global Management, LLC | 6 612 795 | 5,36 | 53 696 | 15,15 | ||||
| 2025-08-14 | 13F | Cohen & Steers, Inc. | 734 931 | 21,04 | 6 | 25,00 | ||||
| 2025-07-10 | 13F | HF Advisory Group, LLC | 21 939 | 3,96 | 178 | 14,10 | ||||
| 2025-08-11 | 13F | Perennial Investment Advisors, LLC | 451 228 | 3,27 | 3 664 | 12,85 | ||||
| 2025-08-06 | 13F | Vantage Financial Partners, LLC | 21 437 | −14,28 | 174 | −5,95 | ||||
| 2025-08-15 | 13F | Morgan Stanley | 508 044 | 12,11 | 4 125 | 22,51 | ||||
| 2025-07-11 | 13F | Seacrest Wealth Management, Llc | 23 938 | 26,61 | 194 | 38,57 | ||||
| 2025-07-10 | 13F | Redhawk Wealth Advisors, Inc. | 23 678 | 4,94 | 192 | 14,97 | ||||
| 2025-08-13 | 13F | Northwestern Mutual Wealth Management Co | 9 755 | −30,90 | 79 | −24,04 | ||||
| 2025-08-05 | 13F | Dunhill Financial, LLC | 856 | 7 | ||||||
| 2025-07-21 | 13F | Ameritas Advisory Services, LLC | 1 191 | 10 | ||||||
| 2025-07-22 | 13F | Firethorn Wealth Partners, Llc | 17 146 | 4,94 | 139 | 14,88 | ||||
| 2025-08-11 | 13F | United Capital Financial Advisers, Llc | 0 | −100,00 | 0 | |||||
| 2025-08-12 | 13F | Park Square Financial Group, LLC | 5 695 | 0,00 | 46 | 9,52 | ||||
| 2025-07-14 | 13F | Capital CS Group, LLC | 22 568 | 28,56 | 183 | 40,77 | ||||
| 2025-08-14 | 13F | Millennium Management Llc | 26 574 | 216 | ||||||
| 2025-08-27 | NP | ACEFX - Absolute Strategies Fund Institutional Shares | 41 440 | 336 | ||||||
| 2025-08-11 | 13F | HighTower Advisors, LLC | 59 496 | −43,94 | 483 | −38,71 | ||||
| 2025-08-14 | 13F | Fmr Llc | 39 673 | 90 065,91 | 322 | |||||
| 2025-08-07 | 13F | Allworth Financial LP | 14 463 | 2 228,99 | 117 | 2 825,00 | ||||
| 2025-07-15 | 13F | Absolute Investment Advisers Llc | 1 229 119 | 9 980 | ||||||
| 2025-08-11 | 13F | Mosaic Family Wealth Partners, Llc | 11 448 | 7,85 | 93 | 17,95 | ||||
| 2025-03-12 | 13F | Centaurus Financial, Inc. | 0 | −100,00 | 0 | −100,00 | ||||
| 2025-09-04 | 13F/A | Advisor Group Holdings, Inc. | 3 493 550 | 29,30 | 28 367 | 41,31 | ||||
| 2025-08-28 | NP | Rivernorth Opportunities Fund, Inc. | 287 123 | 70,61 | 2 331 | 94,41 | ||||
| 2025-08-01 | 13F | First Command Advisory Services, Inc. | 0 | 0 | ||||||
| 2025-08-15 | 13F/A | Cable Car Capital LLC | 661 825 | −0,11 | 5 374 | 9,18 | ||||
| 2025-07-21 | 13F | Ameriflex Group, Inc. | 0 | −100,00 | 0 | |||||
| 2025-07-31 | 13F | BIP Wealth, LLC | 0 | −100,00 | 0 | |||||
| 2025-07-17 | 13F | Sound Income Strategies, LLC | 4 864 | 0,00 | 39 | 8,33 | ||||
| 2025-08-14 | 13F | Raymond James Financial Inc | 351 430 | 13,12 | 2 854 | 23,61 | ||||
| 2025-07-31 | 13F | Cambridge Investment Research Advisors, Inc. | 498 849 | −4,43 | 4 | 33,33 | ||||
| 2025-08-14 | 13F | Rivernorth Capital Management, Llc | 1 803 392 | 14 644 | ||||||
| 2025-08-27 | NP | AAHYX - Thrivent Diversified Income Plus Fund Class A | 21 815 | 41,12 | 177 | 55,26 | ||||
| 2025-04-10 | 13F | Charles Schwab Trust Co | 0 | −100,00 | 0 | |||||
| 2025-08-27 | NP | THRIVENT SERIES FUND INC - Thrivent Balanced Income Plus Portfolio Class A | 5 094 | 33,35 | 41 | 46,43 | ||||
| 2025-08-07 | 13F | Resources Investment Advisors, LLC. | 10 260 | 83 | ||||||
| 2025-05-02 | 13F | Dakota Wealth Management | 0 | −100,00 | 0 | |||||
| 2025-08-12 | 13F | Proequities, Inc. | 0 | 0 | ||||||
| 2025-07-30 | 13F | BlueChip Wealth Advisors LLC | 13 497 | 3,12 | 110 | 12,37 | ||||
| 2025-08-06 | 13F | Tabor Asset Management, LP | 0 | −100,00 | 0 | −100,00 | ||||
| 2025-07-09 | 13F | Dynamic Advisor Solutions LLC | 41 545 | 5,33 | 337 | 15,02 | ||||
| 2025-08-08 | 13F | Cetera Investment Advisers | 610 585 | 20,88 | 4 958 | 32,08 | ||||
| 2025-05-13 | 13F | Soltis Investment Advisors LLC | 0 | −100,00 | 0 | |||||
| 2025-08-06 | 13F | Commonwealth Equity Services, Llc | 251 740 | 0,51 | 2 | 100,00 | ||||
| 2025-07-29 | 13F | Chicago Partners Investment Group LLC | 26 351 | −15,44 | 213 | −2,29 | ||||
| 2025-08-13 | 13F | Baird Financial Group, Inc. | 91 397 | −1,35 | 742 | 7,85 | ||||
| 2025-08-14 | 13F | Toronto Dominion Bank | 50 000 | 406 | ||||||
| 2025-08-08 | 13F | Avantax Advisory Services, Inc. | 83 899 | 681 | ||||||
| 2025-05-16 | 13F | Jones Financial Companies Lllp | 0 | −100,00 | 0 | |||||
| 2025-08-12 | 13F | BlackRock, Inc. | 83 144 | 79,03 | 675 | 95,65 | ||||
| 2025-07-18 | 13F | PFG Investments, LLC | 37 318 | −26,30 | 303 | −19,41 | ||||
| 2025-08-14 | 13F | Ieq Capital, Llc | 0 | −100,00 | 0 | |||||
| 2025-08-14 | 13F | Stifel Financial Corp | 47 215 | 12,64 | 383 | 23,15 | ||||
| 2025-05-16 | 13F | Coppell Advisory Solutions LLC | 0 | −100,00 | 0 | |||||
| 2025-07-23 | 13F | Valmark Advisers, Inc. | 10 000 | 0,00 | 81 | 9,46 | ||||
| 2025-07-22 | 13F | DAVENPORT & Co LLC | 12 773 | 0,00 | 104 | 9,57 | ||||
| 2025-08-06 | 13F | Wedbush Securities Inc | 13 850 | −30,49 | 0 | |||||
| 2025-08-14 | 13F | GWM Advisors LLC | 29 865 | 29,85 | 243 | 42,35 | ||||
| 2025-07-11 | 13F | Farther Finance Advisors, LLC | 4 804 | 55,52 | 39 | 77,27 | ||||
| 2025-07-17 | 13F | Janney Montgomery Scott LLC | 0 | −100,00 | 0 | |||||
| 2025-08-08 | 13F | Larson Financial Group LLC | 10 122 | 52,42 | 82 | 67,35 | ||||
| 2025-08-14 | 13F | Citadel Advisors Llc | 37 929 | −23,98 | 308 | −17,03 | ||||
| 2025-08-14 | 13F | Sit Investment Associates Inc | 5 730 776 | 16 273,65 | 47 | |||||
| 2025-07-25 | 13F | We Are One Seven, LLC | 35 300 | 42,82 | 287 | 56,28 | ||||
| 2025-08-28 | NP | Cohen & Steers Closed-end Opportunity Fund, Inc. | 734 931 | 21,04 | 5 968 | 32,28 | ||||
| 2025-08-12 | 13F | Pathstone Holdings, LLC | 21 012 | 0,00 | 171 | 8,97 | ||||
| 2025-08-06 | 13F | AE Wealth Management LLC | 50 164 | 407 | ||||||
| 2025-08-13 | 13F | StoneX Group Inc. | 133 949 | 45,52 | 1 088 | 59,15 | ||||
| 2025-07-25 | 13F | Atria Wealth Solutions, Inc. | 32 531 | −84,04 | 268 | −82,33 | ||||
| 2025-08-11 | 13F | Principal Securities, Inc. | 700 | 0,00 | 6 | −16,67 | ||||
| 2025-08-14 | 13F | CoreCap Advisors, LLC | 51 956 | 23,66 | 422 | 34,94 | ||||
| 2025-05-02 | 13F | Signaturefd, Llc | 0 | −100,00 | 0 | |||||
| 2025-04-22 | 13F | TrueMark Investments, LLC | 0 | −100,00 | 0 | |||||
| 2025-08-14 | 13F | Royal Bank Of Canada | 2 594 | 130,37 | 21 | 162,50 | ||||
| 2025-05-13 | 13F | Bokf, Na | 0 | −100,00 | 0 | |||||
| 2025-05-14 | 13F | Karpus Management, Inc. | 0 | −100,00 | 0 | |||||
| 2025-08-14 | 13F | Jane Street Group, Llc | 65 005 | 82,02 | 528 | 98,87 | ||||
| 2025-08-07 | 13F | Kestra Private Wealth Services, Llc | 24 297 | 19,81 | 197 | 31,33 | ||||
| 2025-06-26 | NP | AABFX - Thrivent Balanced Income Plus Fund Class A | 4 131 | 0,00 | 29 | −22,22 | ||||
| 2025-08-12 | 13F | AlphaCore Capital LLC | 0 | −100,00 | 0 | |||||
| 2025-06-26 | NP | AAINX - Thrivent Opportunity Income Plus Fund Class A | 33 107 | 0,00 | 229 | −22,37 | ||||
| 2025-07-17 | 13F | Sonora Investment Management Group, LLC | 10 135 | 0,00 | 82 | 9,33 | ||||
| 2025-08-08 | 13F | Kingsview Wealth Management, LLC | 10 000 | 0,00 | 81 | 9,46 | ||||
| 2025-08-13 | 13F | Townsquare Capital Llc | 0 | −100,00 | 0 | |||||
| 2025-08-11 | 13F | Aptus Capital Advisors, LLC | 217 910 | 1,33 | 1 769 | 10,77 | ||||
| 2025-05-07 | 13F | Sheaff Brock Investment Advisors, LLC | 13 830 | 0,00 | 103 | −13,56 | ||||
| 2025-05-15 | 13F | Mercer Global Advisors Inc /adv | 0 | −100,00 | 0 | |||||
| 2025-08-12 | 13F | Jpmorgan Chase & Co | 0 | −100,00 | 0 | |||||
| 2025-07-23 | 13F | Godsey & Gibb Associates | 1 000 | 0,00 | 8 | 14,29 | ||||
| 2025-05-13 | 13F | SHEPHERD WEALTH MANAGEMENT Ltd LIABILITY Co | 0 | −100,00 | 0 | |||||
| 2025-08-11 | 13F | Private Advisor Group, LLC | 51 681 | 1,27 | 420 | 10,55 | ||||
| 2025-08-04 | 13F | Creative Financial Designs Inc /adv | 81 742 | 15,17 | 664 | 25,81 | ||||
| 2025-07-11 | 13F | Adirondack Trust Co | 0 | −100,00 | 0 | |||||
| 2025-08-14 | 13F | Wells Fargo & Company/mn | 3 | −25,00 | 0 | |||||
| 2025-08-05 | 13F | Strategic Financial Concepts, LLC | 64 700 | −10,26 | 525 | −1,87 | ||||
| 2025-08-15 | 13F | Kestra Advisory Services, LLC | 34 447 | 119,88 | 280 | 140,52 | ||||
| 2025-05-12 | 13F | Evernest Financial Advisors, LLC | 0 | −100,00 | 0 | −100,00 | ||||
| 2025-07-24 | 13F | Us Bancorp \de\ | 256 505 | 0,00 | 2 083 | 9,29 | ||||
| 2025-08-12 | 13F | MAI Capital Management | 19 865 | 6,75 | 161 | 16,67 | ||||
| 2025-08-08 | 13F | Avalon Trust Co | 1 000 | −50,00 | 8 | −42,86 | ||||
| 2025-08-14 | 13F | Goldman Sachs Group Inc | 20 000 | 162 | ||||||
| 2025-08-01 | 13F | Pasadena Private Wealth, LLC | 13 945 | 20,18 | 113 | 31,40 | ||||
| 2025-08-11 | 13F | TD Waterhouse Canada Inc. | 0 | −100,00 | 0 | |||||
| 2025-08-14 | 13F | Sculptor Capital LP | 2 666 574 | 21 653 | ||||||
| 2025-07-28 | 13F | Harbour Investments, Inc. | 38 | 0,00 | 0 | |||||
| 2025-07-31 | 13F | Oppenheimer & Co Inc | 15 966 | −0,03 | 130 | 9,32 | ||||
| 2025-08-14 | 13F | Susquehanna International Group, Llp | 28 161 | −72,03 | 229 | −69,52 | ||||
| 2025-05-08 | 13F | Armis Advisers, LLC | 0 | −100,00 | 0 | |||||
| 2025-07-10 | 13F | Wealth Enhancement Advisory Services, Llc | 31 100 | 73,68 | 256 | 92,48 | ||||
| 2025-05-15 | 13F | Hrt Financial Lp | 0 | −100,00 | 0 | |||||
| 2025-08-12 | 13F | Steward Partners Investment Advisory, Llc | 1 | −99,99 | 0 | −100,00 | ||||
| 2025-08-08 | 13F | Capital Investment Advisory Services, LLC | 12 137 | 99 | ||||||
| 2025-08-12 | 13F | Virtu Financial LLC | 0 | −100,00 | 0 | |||||
| 2025-08-08 | 13F | Pnc Financial Services Group, Inc. | 1 200 | 0,00 | 10 | 12,50 | ||||
| 2025-08-12 | 13F | J.w. Cole Advisors, Inc. | 205 931 | 24,12 | 1 672 | 35,71 | ||||
| 2025-08-05 | 13F | Tsfg, Llc | 2 351 | 13 729,41 | 0 | |||||
| 2025-08-08 | 13F | Creative Planning | 120 974 | 26,88 | 982 | 38,70 | ||||
| 2025-08-08 | 13F | Meridian Wealth Management, LLC | 19 126 | 91,26 | 155 | 109,46 | ||||
| 2025-08-12 | 13F | Change Path, LLC | 39 112 | 318 | ||||||
| 2025-08-13 | 13F | Rsm Us Wealth Management Llc | 14 969 | 122 | ||||||
| 2025-08-14 | 13F | Bank Of America Corp /de/ | 3 904 | −99,79 | 32 | −99,78 | ||||
| 2025-08-13 | 13F | Summit Financial, LLC | 21 627 | 176 | ||||||
| 2025-07-24 | 13F | IFP Advisors, Inc | 0 | −100,00 | 0 | |||||
| 2025-08-14 | 13F | Quarry LP | 506 996 | 4 118,64 | 4 117 | 4 524,72 | ||||
| 2025-08-12 | 13F | LPL Financial LLC | 1 362 299 | 22,37 | 11 062 | 33,73 | ||||
| 2025-07-25 | 13F | Cwm, Llc | 31 | 0,00 | 0 | |||||
| 2025-08-07 | 13F | Encompass More Asset Management | 80 317 | 4,89 | 652 | 14,79 | ||||
| 2025-08-01 | 13F | Winebrenner Capital Management Llc | 108 426 | 0,00 | 880 | 9,32 | ||||
| 2025-08-13 | 13F | Thomas J. Herzfeld Advisors, Inc. | 1 074 966 | 1 109,29 | 8 729 | 1 222,42 | ||||
| 2025-08-04 | 13F | Integrity Alliance, Llc. | 0 | −100,00 | 0 | |||||
| 2025-08-06 | 13F | Prospera Financial Services Inc | 70 726 | 11,27 | 574 | 21,61 | ||||
| 2025-08-14 | 13F | Almitas Capital LLC | 0 | −100,00 | 0 | |||||
| 2025-08-27 | NP | THRIVENT SERIES FUND INC - Thrivent Diversified Income Plus Portfolio Class A | 12 946 | 33,34 | 105 | 45,83 | ||||
| 2025-05-12 | 13F | Kane Investment Management, Inc. | 0 | −100,00 | 0 | |||||
| 2025-08-14 | 13F | Integrated Wealth Concepts LLC | 12 210 | −1,47 | 99 | 7,61 | ||||
| 2025-07-22 | 13F | Grimes & Company, Inc. | 0 | −100,00 | 0 | |||||
| 2025-08-27 | NP | THRIVENT SERIES FUND INC - Thrivent Opportunity Income Plus Portfolio Class A | 9 906 | 33,34 | 80 | 45,45 |