Grunnleggende statistikk
| Institusjonelle eiere | 285 total, 285 long only, 0 short only, 0 long/short - change of 3,26% MRQ |
| Gjennomsnittlig porteføljeallokering | 0.6077 % - change of 5,23% MRQ |
| Institusjonelle aksjer (Long) | 110 797 413 (ex 13D/G) - change of 4,28MM shares 4,02% MRQ |
| Institusjonell verdi (Long) | $ 2 785 711 USD ($1000) |
Institusjonelt eierskap og aksjonærer
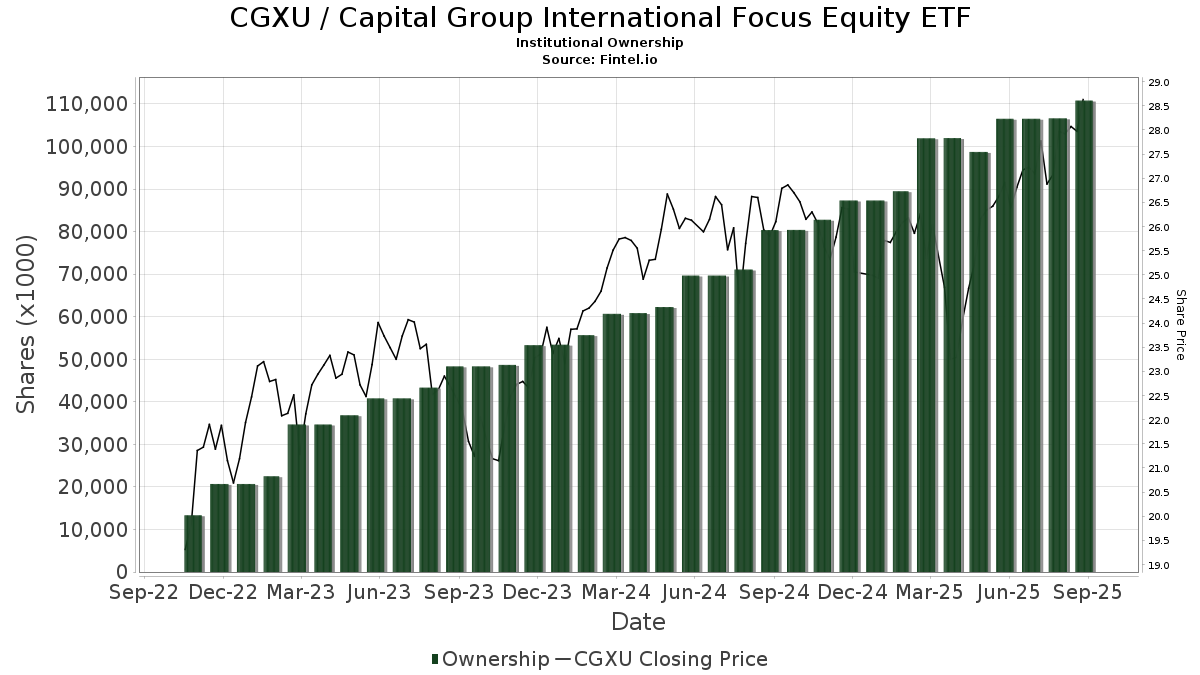
Capital Group International Focus Equity ETF (US:CGXU) har 285 institusjonelle eiere og aksjonærer som har sendt inn 13D/G- eller 13F-skjemaer til Securities Exchange Commission (SEC). Disse institusjonene eier til sammen 110,797,413 aksjer. De største aksjonærene inkluderer LPL Financial LLC, Northwestern Mutual Wealth Management Co, Wells Fargo & Company/mn, UBS Group AG, Raymond James Financial Inc, Captrust Financial Advisors, Citadel Advisors Llc, Royal Bank Of Canada, Morgan Stanley, and Cerity Partners LLC .
Capital Group International Focus Equity ETF (ARCA:CGXU) institusjonell eierstruktur viser nåværende posisjoner i selskapet fordelt på institusjoner og fond, samt de siste endringene i posisjonsstørrelse. De største aksjonærene kan være individuelle investorer, verdipapirfond, hedgefond eller institusjoner. Schedule 13D indikerer at investoren eier (eller har eid) mer enn 5 % av selskapet og har til hensikt (eller hadde til hensikt) å aktivt forfølge en endring i forretningsstrategien. Schedule 13G indikerer en passiv investering på over 5 %.
The share price as of September 10, 2025 is 28,63 / share. Previously, on September 11, 2024, the share price was 25,80 / share. This represents an increase of 10,97% over that period.
Fondssentiment-score
Fondssentiment Score (også kjent som akkumulering av eierskap poengsum) viser hvilke aksjer som er mest kjøpt av fond. Den er resultatet av en sofistikert, kvantitativ flerfaktormodell som identifiserer selskaper med de høyeste nivåene av institusjonell akkumulering. Beregningsmodellen for poeng bruker en kombinasjon av den totale økningen i antall offentliggjorte eiere, endringer i porteføljeallokeringen til disse eierne og andre beregninger. Tallet går fra 0 til 100, der høyere tall indikerer en høyere grad av akkumulering i forhold til sammenlignbare selskaper, der 50 er gjennomsnittet.
Oppdateringsfrekvens: Daglig
Sjekk ut Ownership Explorer, som inneholder en liste over de høyest rangerte selskapene.
Institusjonell Put/Call-forhold
I tillegg til å rapportere standard aksje- og gjeldsemisjoner må institusjoner med mer enn 100 millioner kroner i forvaltningskapital også oppgi beholdningen av put- og callopsjoner. Siden put-opsjoner generelt indikerer et negativt sentiment, og call-opsjoner indikerer et positivt sentiment, kan vi få et inntrykk av det generelle institusjonelle sentimentet ved å plotte forholdet mellom put- og call-opsjoner. Diagrammet til høyre viser det historiske forholdet mellom put- og call-opsjoner for dette instrumentet.
Ved å bruke Put/Call-forholdet som en indikator på investorsentimentet kan man overvinne en av de viktigste svakhetene ved å bruke totalt institusjonelt eierskap, nemlig at en betydelig andel av forvaltningskapitalen investeres passivt for å følge indekser. Passivt forvaltede fond kjøper vanligvis ikke opsjoner, slik at indikatoren for put/call-forhold i større grad gjenspeiler stemningen i aktivt forvaltede fond.
13F- og NPORT-arkiveringer
Detaljer om 13F-arkiveringer er gratis. Detaljer om NP-arkiveringer krever et premium-medlemskap. Grønne rader indikerer nye posisjoner. Røde rader indikerer lukkede posisjoner. Klikk på lenke ikonet for å se hele transaksjonshistorikken.
Oppgrader
for å låse opp premiedata og eksportere til Excel. ![]() .
.
| Fildato | Kilde | Investor | Type | Gjennomsnittlig pris (estimert) |
Aksjer | Δ Aksjer (%) |
Rapportert verdi ($1000) | Verdi (%) | Portallokering (%) | |
|---|---|---|---|---|---|---|---|---|---|---|
| 2025-07-15 | 13F | Avaii Wealth Management, Llc | 26 506 | −15,29 | 719 | −6,01 | ||||
| 2025-08-12 | 13F | Rather & Kittrell, Inc. | 16 850 | 2,62 | 457 | 13,97 | ||||
| 2025-07-29 | 13F | Stratos Wealth Advisors, LLC | 58 541 | −1,69 | 1 588 | 8,99 | ||||
| 2025-08-12 | 13F | Tocqueville Asset Management L.p. | 68 633 | 21,15 | 1 862 | 34,34 | ||||
| 2025-08-12 | 13F | Steward Partners Investment Advisory, Llc | 167 446 | 33,76 | 4 543 | 48,24 | ||||
| 2025-07-22 | 13F | Merit Financial Group, LLC | 23 061 | 19,33 | 626 | 32,14 | ||||
| 2025-07-22 | 13F | Gutierrez Wealth Advisory, LLC | 285 232 | −10,69 | 7 738 | −1,02 | ||||
| 2025-07-29 | 13F | Burford Brothers, Inc. | 60 738 | 2,40 | 1 648 | 13,43 | ||||
| 2025-08-05 | 13F | Fullcircle Wealth Llc | 48 845 | 9,97 | 1 311 | 19,18 | ||||
| 2025-08-14 | 13F | TCG Advisory Services, LLC | 229 675 | 13,50 | 6 231 | 25,80 | ||||
| 2025-08-08 | 13F | Gts Securities Llc | 53 754 | 55,44 | 1 458 | 72,34 | ||||
| 2025-08-05 | 13F | Mason Investment Advisory Services, Inc. | 303 769 | 43,00 | 8 241 | 58,48 | ||||
| 2025-08-06 | 13F | Mascagni Wealth Management, Inc. | 15 459 | −4,41 | 419 | 6,08 | ||||
| 2025-07-22 | 13F | Belpointe Asset Management LLC | 13 860 | 0,00 | 376 | 10,91 | ||||
| 2025-08-11 | 13F | Greykasell Wealth Strategies, Inc. | 35 914 | 15,90 | 974 | 28,50 | ||||
| 2025-08-14 | 13F | UBS Group AG | 5 157 841 | 4,16 | 139 932 | 15,44 | ||||
| 2025-07-21 | 13F | Sterling Investment Counsel, LLC | 372 109 | −42,51 | 10 095 | −36,29 | ||||
| 2025-07-29 | 13F | Signature Estate & Investment Advisors Llc | 109 939 | 14,10 | 2 983 | 26,46 | ||||
| 2025-08-11 | 13F | Private Advisor Group, LLC | 1 120 807 | 3,08 | 30 407 | 14,23 | ||||
| 2025-07-30 | 13F | Whittier Trust Co Of Nevada Inc | 0 | −100,00 | 0 | |||||
| 2025-07-16 | 13F | Banque Pictet & Cie Sa | 16 318 | 0,00 | 443 | 10,78 | ||||
| 2025-07-22 | 13F | Wealthcare Capital Management Llc | 7 466 | −18,59 | 203 | −9,82 | ||||
| 2025-07-11 | 13F | Bond & Devick Financial Network, Inc. | 18 421 | 0,00 | 500 | 10,89 | ||||
| 2025-08-08 | 13F | Advyzon Investment Management, LLC | 8 201 | 222 | ||||||
| 2025-07-22 | 13F | Wealthcare Advisory Partners LLC | 387 422 | 58,65 | 10 511 | 75,84 | ||||
| 2025-08-07 | 13F | Cvfg Llc | 17 242 | 66,91 | 468 | 85,32 | ||||
| 2025-08-14 | 13F | Hrt Financial Lp | 0 | −100,00 | 0 | |||||
| 2025-07-25 | 13F | Alpha Financial Partners, LLC | 11 401 | 0,00 | 309 | 10,75 | ||||
| 2025-07-10 | 13F | Triangle Securities Wealth Management | 194 851 | −4,02 | 5 286 | 6,38 | ||||
| 2025-07-22 | 13F | Woodmont Investment Counsel Llc | 38 384 | 12,98 | 1 041 | 25,27 | ||||
| 2025-08-13 | 13F | Capital Group Private Client Services, Inc. | 3 151 572 | −0,68 | 85 502 | 10,07 | ||||
| 2025-04-22 | 13F | XY Planning Network, Inc. | 0 | −100,00 | 0 | |||||
| 2025-07-24 | 13F | Robertson Stephens Wealth Management, LLC | 37 081 | −25,00 | 1 017 | −16,03 | ||||
| 2025-07-28 | 13F | Sagespring Wealth Partners, Llc | 22 548 | −36,66 | 612 | −29,85 | ||||
| 2025-08-04 | 13F | WNY Asset Management, LLC | 0 | −100,00 | 0 | |||||
| 2025-08-12 | 13F | Jpmorgan Chase & Co | 270 518 | −8,56 | 7 339 | 1,34 | ||||
| 2025-08-11 | 13F | Principal Securities, Inc. | 18 371 | 31,25 | 498 | 44,35 | ||||
| 2025-07-10 | 13F | Financial Management Network Inc | 437 089 | −3,87 | 11 893 | 20,94 | ||||
| 2025-08-14 | 13F | Wells Fargo & Company/mn | 5 416 590 | −8,44 | 146 952 | 1,47 | ||||
| 2025-08-18 | 13F | Geneos Wealth Management Inc. | 7 449 | 50,64 | 202 | 66,94 | ||||
| 2025-05-12 | 13F | Fmr Llc | 0 | −100,00 | 0 | |||||
| 2025-08-12 | 13F | Vawter Financial, Ltd. | 10 354 | −96,95 | 281 | −96,63 | ||||
| 2025-08-12 | 13F | Lodestone Wealth Management LLC | 111 116 | 3,76 | 3 015 | 14,99 | ||||
| 2025-05-09 | 13F | Roof Eidam & Maycock/adv | 0 | −100,00 | 0 | |||||
| 2025-07-29 | 13F | Koshinski Asset Management, Inc. | 633 763 | 5,18 | 17 194 | 16,57 | ||||
| 2025-08-05 | 13F | Key FInancial Inc | 4 047 | 0,00 | 110 | 10,10 | ||||
| 2025-08-13 | 13F | Capital Analysts, Inc. | 274 125 | 32,40 | 7 | 40,00 | ||||
| 2025-07-22 | 13F | Legacy CG, LLC | 0 | −100,00 | 0 | |||||
| 2025-08-07 | 13F | Cahill Financial Advisors Inc | 577 585 | 6,88 | 15 670 | 18,45 | ||||
| 2025-07-24 | 13F | IFP Advisors, Inc | 1 176 | 114,21 | 32 | 138,46 | ||||
| 2025-07-29 | 13F | International Assets Investment Management, Llc | 10 958 | −15,85 | 297 | −6,60 | ||||
| 2025-07-22 | 13F | DAVENPORT & Co LLC | 18 645 | −2,57 | 506 | 7,91 | ||||
| 2025-08-14 | 13F | Wiley Bros.-aintree Capital, Llc | 1 180 478 | 9,86 | 32 066 | 19,79 | ||||
| 2025-08-14 | 13F | Clg Llc | 108 856 | −5,41 | 2 953 | 4,83 | ||||
| 2025-07-18 | 13F | Pure Financial Advisors, Inc. | 7 843 | −14,21 | 213 | −4,93 | ||||
| 2025-07-25 | 13F | Atria Wealth Solutions, Inc. | 290 268 | 31,36 | 7 912 | 46,26 | ||||
| 2025-07-24 | 13F | Cyndeo Wealth Partners, LLC | 128 438 | 2,34 | 3 485 | 13,41 | ||||
| 2025-08-14 | 13F | Great Valley Advisor Group, Inc. | 59 646 | 114,45 | 1 618 | 137,79 | ||||
| 2025-07-14 | 13F | Main Line Retirement Advisors, LLC | 631 499 | 10,00 | 17 133 | 21,91 | ||||
| 2025-08-14 | 13F | Tennessee Valley Asset Management Partners | 0 | −100,00 | 0 | |||||
| 2025-08-11 | 13F | TD Waterhouse Canada Inc. | 44 187 | 21,00 | 1 192 | 32,44 | ||||
| 2025-07-25 | 13F | Lodestar Private Asset Management Llc | 14 852 | −55,89 | 403 | −51,21 | ||||
| 2025-08-12 | 13F | NFP Retirement, Inc. | 51 023 | −1,55 | 1 384 | 9,15 | ||||
| 2025-08-14 | 13F | Benjamin Edwards Inc | 54 239 | −8,98 | 1 472 | 0,89 | ||||
| 2025-07-22 | 13F | Wealthcare Capital Partners, LLC | 24 093 | 24,22 | 654 | 37,76 | ||||
| 2025-08-08 | 13F | CWS Financial Advisors, LLC | 51 413 | 0,39 | 1 395 | 11,25 | ||||
| 2025-08-04 | 13F | Bridgewealth Advisory Group, LLC | 307 193 | 496,99 | 8 334 | 561,95 | ||||
| 2025-08-14 | 13F | Mpwm Advisory Solutions, Llc | 742 | 0,00 | 20 | 11,11 | ||||
| 2025-07-15 | 13F | Signet Financial Management, Llc | 120 084 | −0,04 | 3 258 | 10,78 | ||||
| 2025-07-21 | 13F | Cornell Pochily Investment Advisors, Inc. | 67 843 | 2,82 | 1 841 | 13,93 | ||||
| 2025-07-31 | 13F | 180 Wealth Advisors, Llc | 31 422 | 10,61 | 852 | 21,54 | ||||
| 2025-08-11 | 13F | United Advisor Group, LLC | 112 820 | 62,59 | 3 061 | 80,21 | ||||
| 2025-07-16 | 13F | Strategic Investment Solutions, Inc. /IL | 750 | 7,14 | 20 | 17,65 | ||||
| 2025-07-10 | 13F | Wealth Enhancement Advisory Services, Llc | 483 025 | −1,91 | 13 143 | 9,03 | ||||
| 2025-08-13 | 13F | Baird Financial Group, Inc. | 944 010 | 7,03 | 25 611 | 18,62 | ||||
| 2025-08-11 | 13F | Aptus Capital Advisors, LLC | 71 782 | 0,14 | 1 947 | 11,00 | ||||
| 2025-07-22 | 13F | SOL Capital Management CO | 901 562 | −0,48 | 24 | 9,09 | ||||
| 2025-07-15 | 13F | Charter Capital Management, LLC\DE | 63 353 | 1 719 | ||||||
| 2025-07-16 | 13F | Kerntke Otto McGlone Wealth Management Group | 37 651 | 10,17 | 1 021 | 22,13 | ||||
| 2025-07-30 | 13F | Rehmann Capital Advisory Group | 54 472 | 7,19 | 1 478 | 18,73 | ||||
| 2025-07-21 | 13F | Capital Planning LLC | 0 | −100,00 | 0 | |||||
| 2025-07-08 | 13F | Advance Capital Management, Inc. | 7 656 | −29,59 | 208 | −22,18 | ||||
| 2025-07-15 | 13F | MCF Advisors LLC | 407 | 0,00 | 11 | 22,22 | ||||
| 2025-07-23 | 13F | Clear Creek Financial Management, LLC | 30 401 | −4,41 | 825 | 5,91 | ||||
| 2025-04-29 | 13F | Strategic Blueprint, LLC | 0 | −100,00 | 0 | |||||
| 2025-08-11 | 13F | Western Wealth Management, LLC | 70 261 | 2,18 | 1 906 | 13,25 | ||||
| 2025-08-04 | 13F | Flagship Harbor Advisors, Llc | 42 927 | 1 165 | ||||||
| 2025-08-12 | 13F | Coldstream Capital Management Inc | 0 | −100,00 | 0 | |||||
| 2025-07-24 | 13F | CarsonAllaria Wealth Management, Ltd. | 2 903 | 0,00 | 79 | 9,86 | ||||
| 2025-08-12 | 13F | Marshall & Sterling Wealth Advisors Inc. | 2 177 | 25,33 | 59 | 40,48 | ||||
| 2025-08-14 | 13F | Two Sigma Securities, Llc | 9 218 | 250 | ||||||
| 2025-07-10 | 13F | Exchange Traded Concepts, Llc | 3 535 | 96 | ||||||
| 2025-08-14 | 13F | Raymond James Financial Inc | 4 802 932 | −2,11 | 130 304 | 8,48 | ||||
| 2025-08-14 | 13F | Jane Street Group, Llc | 478 812 | 84,76 | 12 990 | 104,79 | ||||
| 2025-08-13 | 13F | Congress Wealth Management LLC / DE / | 674 634 | 14,65 | 18 303 | 23,69 | ||||
| 2025-07-14 | 13F | AdvisorNet Financial, Inc | 947 042 | 3,59 | 25 693 | 14,81 | ||||
| 2025-07-16 | 13F | St Germain D J Co Inc | 11 476 | 8,88 | 311 | 20,54 | ||||
| 2025-08-12 | 13F | J.w. Cole Advisors, Inc. | 10 512 | 3,82 | 285 | 15,38 | ||||
| 2025-08-08 | 13F | Cetera Investment Advisers | 1 425 732 | 4,37 | 38 680 | 15,67 | ||||
| 2025-08-13 | 13F | Colonial Trust Co / SC | 7 153 | −0,96 | 194 | 10,23 | ||||
| 2025-08-11 | 13F | Citigroup Inc | 13 | 0 | ||||||
| 2025-08-13 | 13F | Continuum Advisory, LLC | 77 430 | 10,05 | 2 101 | 21,95 | ||||
| 2025-08-14 | 13F | Quantinno Capital Management LP | 9 812 | −38,75 | 266 | −32,14 | ||||
| 2025-08-14 | 13F | Mariner, LLC | 68 757 | 34,23 | 1 865 | 48,84 | ||||
| 2025-08-14 | 13F | Atomi Financial Group, Inc. | 22 368 | 20,88 | 607 | 34,07 | ||||
| 2025-07-18 | 13F | Trilogy Capital Inc. | 11 174 | −9,22 | 303 | 0,66 | ||||
| 2025-08-05 | 13F | Summit Investment Advisory Services, LLC | 0 | −100,00 | 0 | |||||
| 2025-08-14 | 13F | Susquehanna International Group, Llp | 1 444 232 | 39 182 | ||||||
| 2025-07-17 | 13F | Janney Montgomery Scott LLC | 1 222 004 | 10,02 | 33 | 22,22 | ||||
| 2025-08-07 | 13F | 1620 Investment Advisors, Inc. | 1 899 | −30,47 | 52 | −22,73 | ||||
| 2025-08-26 | 13F | Nautilus Advisors LLC | 13 135 | −4,37 | 356 | 5,95 | ||||
| 2025-07-11 | 13F | Farther Finance Advisors, LLC | 3 158 | 86 | ||||||
| 2025-04-14 | 13F | Strategic Wealth Designers | 0 | −100,00 | 0 | −100,00 | ||||
| 2025-07-29 | 13F | Clearview Wealth Advisors LLC | 163 261 | 0,94 | 4 429 | 11,87 | ||||
| 2025-08-07 | 13F | Allworth Financial LP | 5 158 | 0,00 | 140 | 10,32 | ||||
| 2025-08-08 | 13F | Cornerstone Advisors Asset Management, Inc | 31 781 | 22,47 | 862 | 35,75 | ||||
| 2025-07-21 | 13F | Ameritas Advisory Services, LLC | 130 218 | −22,91 | 3 533 | −14,79 | ||||
| 2025-08-12 | 13F | Ameritas Investment Partners, Inc. | 95 199 | 11,66 | 2 583 | 23,72 | ||||
| 2025-07-25 | 13F | Bill Few Associates, Inc. | 81 067 | −23,89 | 2 199 | −15,65 | ||||
| 2025-08-14 | 13F | Sei Investments Co | 1 346 418 | 32,53 | 36 528 | 46,88 | ||||
| 2025-08-14 | 13F/A | Rockefeller Capital Management L.P. | 48 622 | 29,39 | 1 319 | 43,53 | ||||
| 2025-08-06 | 13F | Prospera Financial Services Inc | 19 021 | 36,46 | 516 | 51,32 | ||||
| 2025-08-04 | 13F | Creative Financial Designs Inc /adv | 465 | 0,00 | 13 | 9,09 | ||||
| 2025-05-09 | 13F | Delta Financial Group, Inc. | 293 543 | 9,10 | 8 | 16,67 | ||||
| 2025-08-12 | 13F | CIBC Private Wealth Group, LLC | 2 320 | 0,00 | 63 | 26,53 | ||||
| 2025-08-11 | 13F | Hopwood Financial Services, Inc. | 528 650 | 3,53 | 14 345 | 14,76 | ||||
| 2025-07-16 | 13F | Essex Financial Services, Inc. | 30 677 | 0,36 | 832 | 11,23 | ||||
| 2025-07-16 | 13F | Swisher Financial Concepts, Inc. | 180 433 | 15,99 | 4 895 | 28,55 | ||||
| 2025-07-21 | 13F | Investment Planning Advisors, Inc. | 0 | −100,00 | 0 | |||||
| 2025-07-31 | 13F | Cambridge Investment Research Advisors, Inc. | 914 478 | −13,60 | 25 | −4,00 | ||||
| 2025-07-22 | 13F | Brown Miller Wealth Management, LLC | 166 200 | 3,51 | 4 509 | 14,73 | ||||
| 2025-07-11 | 13F | Lincoln Capital LLC | 29 912 | 0,00 | 812 | 15,01 | ||||
| 2025-07-09 | 13F | Pines Wealth Management, LLC | 37 621 | 0,18 | 1 024 | 27,08 | ||||
| 2025-08-14 | 13F | Freedom Financial Partners LLC | 604 367 | 7,22 | 16 396 | 18,81 | ||||
| 2025-08-13 | 13F | Aspire Growth Partners LLC | 92 273 | 0,21 | 2 503 | 7,70 | ||||
| 2025-08-07 | 13F | CENTRAL TRUST Co | 144 274 | 20,12 | 3 914 | 33,13 | ||||
| 2025-07-28 | 13F | Axxcess Wealth Management, Llc | 69 761 | −78,41 | 1 893 | −76,08 | ||||
| 2025-05-02 | 13F | Capital A Wealth Management, LLC | 25 | 4,17 | 1 | |||||
| 2025-05-13 | 13F | Hartland & Co., LLC | 0 | −100,00 | 0 | |||||
| 2025-08-07 | 13F | Zions Bancorporation, National Association /ut/ | 16 000 | 0,00 | 434 | 11,00 | ||||
| 2025-08-15 | 13F | Equitable Holdings, Inc. | 197 847 | 96,87 | 5 368 | 118,17 | ||||
| 2025-07-09 | 13F | Inspirion Wealth Advisors, Llc | 1 515 751 | 0,69 | 41 122 | 11,60 | ||||
| 2025-08-11 | 13F | Stonebrook Private Inc. | 20 243 | 0,40 | 549 | 11,36 | ||||
| 2025-08-04 | 13F | IFG Advisory, LLC | 23 221 | 66,32 | 630 | 84,46 | ||||
| 2025-08-12 | 13F | LPL Financial LLC | 9 010 365 | 26,08 | 244 451 | 39,73 | ||||
| 2025-07-16 | 13F | Signature Resources Capital Management, LLC | 25 894 | 31,10 | 703 | 45,34 | ||||
| 2025-07-30 | 13F | Financial Perspectives, Inc | 4 655 | 0,00 | 126 | 11,50 | ||||
| 2025-08-13 | 13F | Cary Street Partners Financial Llc | 8 387 | 0,00 | 228 | 10,73 | ||||
| 2025-08-13 | 13F | IAG Wealth Partners, LLC | 462 | 0,00 | 13 | 9,09 | ||||
| 2025-08-08 | 13F | New England Capital Financial Advisors LLC | 35 | −78,92 | 1 | −100,00 | ||||
| 2025-08-05 | 13F | 5T Wealth, LLC | 41 465 | −37,76 | 1 125 | −31,04 | ||||
| 2025-07-25 | 13F | SPC Financial, Inc. | 159 045 | 6,13 | 4 315 | 17,61 | ||||
| 2025-08-12 | 13F | Proequities, Inc. | 0 | 0 | ||||||
| 2025-04-28 | 13F | Redmont Wealth Advisors Llc | 148 | 4 | ||||||
| 2025-07-09 | 13F | Procyon Private Wealth Partners, LLC | 99 719 | 5,83 | 2 705 | 17,30 | ||||
| 2025-08-13 | 13F | Jones Financial Companies Lllp | 1 144 890 | 18,09 | 31 312 | 30,17 | ||||
| 2025-07-17 | 13F | Eclectic Associates Inc /adv | 1 464 718 | 4,74 | 39 739 | 16,07 | ||||
| 2025-07-29 | 13F | Stephens Inc /ar/ | 33 857 | 0,00 | 919 | 10,87 | ||||
| 2025-08-15 | 13F | Morgan Stanley | 3 642 622 | 2,90 | 98 824 | 14,03 | ||||
| 2025-07-17 | 13F | Venture Visionary Partners LLC | 8 392 | 228 | ||||||
| 2025-05-15 | 13F | CAPROCK Group, Inc. | 0 | −100,00 | 0 | |||||
| 2025-07-30 | 13F | Crewe Advisors LLC | 5 089 | 0,00 | 138 | 11,29 | ||||
| 2025-07-31 | 13F | Moloney Securities Asset Management, LLC | 32 810 | 41,97 | 890 | 57,52 | ||||
| 2025-08-13 | 13F | EverSource Wealth Advisors, LLC | 476 785 | 18,33 | 12 935 | 31,15 | ||||
| 2025-08-13 | 13F | Rsm Us Wealth Management Llc | 27 786 | 1,84 | 762 | 14,24 | ||||
| 2025-09-04 | 13F/A | Advisor Group Holdings, Inc. | 1 355 918 | −16,46 | 36 789 | −7,42 | ||||
| 2025-07-15 | 13F | tru Independence LLC | 17 503 | −10,76 | 475 | −1,25 | ||||
| 2025-08-07 | 13F | Winch Advisory Services, LLC | 898 | 0,00 | 24 | 14,29 | ||||
| 2025-07-24 | 13F | Stonebridge Financial Group, LLC | 0 | −100,00 | 0 | |||||
| 2025-08-13 | 13F | Bare Financial Services, Inc | 150 437 | −26,86 | 4 081 | −18,95 | ||||
| 2025-08-12 | 13F | Richmond Investment Services, LLC | 14 649 | 397 | ||||||
| 2025-07-24 | 13F | Us Bancorp \de\ | 33 180 | 1,16 | 900 | 12,22 | ||||
| 2025-07-23 | 13F | Trueblood Wealth Management, LLC | 51 946 | 6,03 | 1 409 | 17,51 | ||||
| 2025-07-23 | 13F | Eagle Rock Investment Company, Llc | 21 519 | −1,92 | 584 | 8,57 | ||||
| 2025-08-06 | 13F | Walkner Condon Financial Advisors LLC | 14 425 | −8,85 | 391 | 1,03 | ||||
| 2025-07-09 | 13F | Bulwark Capital Corp | 27 486 | 746 | ||||||
| 2025-07-30 | 13F | Eqis Capital Management, Inc. | 8 268 | 224 | ||||||
| 2025-08-12 | 13F | MAI Capital Management | 12 980 | 0,00 | 352 | 11,04 | ||||
| 2025-08-12 | 13F | SRS Capital Advisors, Inc. | 913 | 25 | ||||||
| 2025-07-23 | 13F | Prime Capital Investment Advisors, LLC | 39 775 | 296,64 | 1 079 | 340,41 | ||||
| 2025-08-13 | 13F | Kuhn & Co Investment Counsel | 30 021 | 76,78 | 814 | 96,14 | ||||
| 2025-08-06 | 13F | Atlas Legacy Advisors, LLC | 66 604 | −8,83 | 1 807 | −4,34 | ||||
| 2025-05-09 | 13F | GeoWealth Management, LLC | 0 | −100,00 | 0 | |||||
| 2025-07-28 | 13F | Cushing Capital Partners, LLC | 70 067 | −0,20 | 1 922 | 11,82 | ||||
| 2025-07-07 | 13F | Roxbury Financial LLC | 1 158 | 31 | ||||||
| 2025-07-17 | 13F | G&S Capital LLC | 126 965 | −30,95 | 3 445 | −23,48 | ||||
| 2025-08-14 | 13F | Main Street Financial Solutions, LLC | 197 786 | −4,85 | 5 366 | 5,44 | ||||
| 2025-08-14 | 13F | Citadel Advisors Llc | 4 218 710 | 6 315,22 | 114 454 | 7 013,30 | ||||
| 2025-08-14 | 13F | Stifel Financial Corp | 1 741 722 | 22,96 | 47 253 | 36,27 | ||||
| 2025-07-14 | 13F | Armstrong Advisory Group, Inc | 0 | −100,00 | 0 | |||||
| 2025-08-18 | 13F/A | National Bank Of Canada /fi/ | 3 516 | 0,46 | 95 | 11,76 | ||||
| 2025-08-15 | 13F | Kestra Advisory Services, LLC | 958 666 | 2,19 | 26 009 | 13,25 | ||||
| 2025-08-13 | 13F | Riverview Capital Advisers, LLC | 209 576 | −0,39 | 5 686 | 10,39 | ||||
| 2025-08-04 | 13F | Clear Investment Research, Llc | 1 054 | −22,21 | 29 | −15,15 | ||||
| 2025-08-14 | 13F | Old Mission Capital Llc | 74 675 | 94,20 | 2 026 | 115,20 | ||||
| 2025-07-17 | 13F | ERn Financial, LLC | 44 520 | 5,94 | 1 208 | 17,41 | ||||
| 2025-08-04 | 13F | Spire Wealth Management | 49 345 | 0,56 | 1 339 | 11,41 | ||||
| 2025-08-08 | 13F | Good Life Advisors, LLC | 9 166 | −59,49 | 249 | −55,15 | ||||
| 2025-08-14 | 13F | Evergreen Wealth Solutions, LLC | 10 650 | −47,92 | 289 | −42,40 | ||||
| 2025-07-25 | 13F | Cwm, Llc | 90 195 | 9,75 | 2 | 0,00 | ||||
| 2025-08-12 | 13F | Zacks Investment Management | 18 552 | 1,31 | 503 | 12,28 | ||||
| 2025-07-31 | 13F | Strata Wealth Advisors, LLC | 518 011 | 12,69 | 14 054 | 24,88 | ||||
| 2025-08-12 | 13F | Barnes Pettey Financial Advisors, Llc | 31 985 | −53,70 | 868 | −48,73 | ||||
| 2025-07-09 | 13F | Dynamic Advisor Solutions LLC | 84 764 | −9,58 | 2 300 | 0,22 | ||||
| 2025-08-14 | 13F | Aprio Wealth Management, LLC | 533 957 | 23,99 | 14 486 | 37,41 | ||||
| 2025-08-15 | 13F | Captrust Financial Advisors | 4 611 782 | −54,68 | 125 118 | −49,77 | ||||
| 2025-07-01 | 13F | Harbor Investment Advisory, Llc | 1 539 | 42 | ||||||
| 2025-07-17 | 13F | Tempus Wealth Planning, LLC | 8 828 | −1,33 | 240 | 9,13 | ||||
| 2025-08-13 | 13F | Renaissance Technologies Llc | 15 500 | 43,52 | 421 | 59,09 | ||||
| 2025-08-14 | 13F | Warren Averett Asset Management, LLC | 9 751 | −12,30 | 265 | −2,94 | ||||
| 2025-07-30 | 13F | Bleakley Financial Group, LLC | 424 101 | −20,24 | 11 506 | −11,62 | ||||
| 2025-07-11 | 13F | LongView Wealth Management | 10 072 | −81,63 | 273 | −79,66 | ||||
| 2025-08-13 | 13F | Cerity Partners LLC | 3 578 528 | 1,28 | 97 085 | 12,24 | ||||
| 2025-07-23 | 13F | Valmark Advisers, Inc. | 133 495 | 2,57 | 3 622 | 13,65 | ||||
| 2025-07-17 | 13F | Willow Creek Wealth Management Inc. | 7 819 | 212 | ||||||
| 2025-08-11 | 13F | HighTower Advisors, LLC | 131 374 | 0,02 | 3 564 | 10,86 | ||||
| 2025-07-18 | 13F | Vicus Capital | 9 598 | 260 | ||||||
| 2025-08-13 | 13F | Russell Investments Group, Ltd. | 1 537 | −29,88 | 42 | −22,64 | ||||
| 2025-08-07 | 13F | PFG Advisors | 25 146 | −5,23 | 682 | 5,08 | ||||
| 2025-07-11 | 13F | Lantz Financial LLC | 532 289 | 5,53 | 14 441 | 16,95 | ||||
| 2025-05-13 | 13F | O'shaughnessy Asset Management, Llc | 0 | −100,00 | 0 | |||||
| 2025-07-08 | 13F | First National Corp /ma/ /adv | 12 443 | −33,37 | 338 | −26,26 | ||||
| 2025-07-11 | 13F | Trinity Wealth Management, LLC | 22 108 | 600 | ||||||
| 2025-08-12 | 13F | Tradition Wealth Management, LLC | 18 420 | 0,00 | 500 | 10,89 | ||||
| 2025-07-28 | 13F | RFG Advisory, LLC | 22 338 | 3,23 | 606 | 14,56 | ||||
| 2025-08-06 | 13F | Souders Financial Advisors | 740 699 | 7,59 | 20 095 | 19,24 | ||||
| 2025-07-28 | 13F | Harbour Investments, Inc. | 136 955 | 39,71 | 3 716 | 54,86 | ||||
| 2025-08-07 | 13F | Kestra Private Wealth Services, Llc | 18 522 | −3,02 | 503 | 7,49 | ||||
| 2025-08-05 | 13F | Westside Investment Management, Inc. | 550 | 0,00 | 15 | 7,69 | ||||
| 2025-08-08 | 13F | Sittner & Nelson, Llc | 83 061 | 8,31 | 2 253 | 20,03 | ||||
| 2025-07-16 | 13F | Perigon Wealth Management, LLC | 8 516 | 231 | ||||||
| 2025-07-14 | 13F | McGlone Suttner Wealth Management, Inc. | 696 455 | 2,69 | 18 895 | 13,81 | ||||
| 2025-07-29 | 13F | DeDora Capital, Inc. | 598 048 | −1,74 | 16 225 | 8,90 | ||||
| 2025-07-14 | 13F | Opal Wealth Advisors, LLC | 13 093 | −1,42 | 355 | 9,23 | ||||
| 2025-08-11 | 13F | Rothschild Investment Llc | 15 950 | −1,24 | 433 | 9,37 | ||||
| 2025-07-25 | 13F | Transcendent Capital Group LLC | 62 475 | 2,85 | 1 695 | 14,00 | ||||
| 2025-08-14 | 13F | Smartleaf Asset Management LLC | 4 506 | 123 | ||||||
| 2025-08-29 | 13F | Centaurus Financial, Inc. | 5 410 | 0 | ||||||
| 2025-08-12 | 13F | Global Retirement Partners, LLC | 16 974 | 419,08 | 461 | 475,00 | ||||
| 2025-08-06 | 13F | Golden State Wealth Management, LLC | 0 | −100,00 | 0 | −100,00 | ||||
| 2025-08-19 | 13F | Advisory Services Network, LLC | 110 969 | 3,35 | 2 962 | 12,67 | ||||
| 2025-07-14 | 13F | Farmers & Merchants Investments Inc | 9 950 | 0,00 | 270 | 10,70 | ||||
| 2025-08-14 | 13F | Ambassador Advisors, LLC | 8 363 | −0,49 | 227 | 10,24 | ||||
| 2025-08-14 | 13F | Comerica Bank | 21 999 | 17,64 | 597 | 30,42 | ||||
| 2025-08-11 | 13F | Nations Financial Group Inc, /ia/ /adv | 34 961 | 17,48 | 948 | 30,22 | ||||
| 2025-07-11 | 13F/A | Umb Bank N A/mo | 1 671 | 45 | ||||||
| 2025-07-22 | 13F | Olistico Wealth, LLC | 127 201 | 43,82 | 3 451 | 59,35 | ||||
| 2025-08-01 | 13F | Ashton Thomas Private Wealth, LLC | 39 713 | 15,03 | 1 077 | 27,46 | ||||
| 2025-07-22 | 13F | Orca Wealth Management, LLC | 12 436 | 3,70 | 337 | 15,02 | ||||
| 2025-07-31 | 13F | Oppenheimer & Co Inc | 118 631 | 18,16 | 3 218 | 30,97 | ||||
| 2025-08-06 | 13F | Round Rock Advisors, LLC | 17 543 | −18,62 | 476 | −9,87 | ||||
| 2025-08-27 | 13F/A | Brinker Capital Investments, LLC | 10 161 | −82,85 | 276 | −81,03 | ||||
| 2025-07-07 | 13F | Thurston, Springer, Miller, Herd & Titak, Inc. | 120 769 | 306,88 | 3 276 | 351,24 | ||||
| 2025-08-13 | 13F | Quadrature Capital Ltd | 0 | −100,00 | 0 | |||||
| 2025-08-14 | 13F | Bank Of America Corp /de/ | 1 574 420 | 14,70 | 42 714 | 27,11 | ||||
| 2025-07-16 | 13F/A | CX Institutional | 720 | 0,00 | 0 | |||||
| 2025-08-14 | 13F | Mml Investors Services, Llc | 1 005 152 | 2,03 | 27 | 12,50 | ||||
| 2025-08-06 | 13F | Commonwealth Equity Services, Llc | 2 939 691 | −2,76 | 80 | 6,76 | ||||
| 2025-07-09 | 13F | Fiduciary Alliance LLC | 67 131 | 1 821 | ||||||
| 2025-07-14 | 13F | CRA Financial Services, LLC | 12 540 | −3,83 | 340 | 6,58 | ||||
| 2025-08-01 | 13F | Signature Wealth Management Group | 46 001 | 1,14 | 1 248 | 12,13 | ||||
| 2025-07-31 | 13F | Whipplewood Advisors, LLC | 857 | 56,96 | 23 | −11,54 | ||||
| 2025-07-10 | 13F | Sovran Advisors, LLC | 128 465 | −44,43 | 3 485 | −35,58 | ||||
| 2025-08-14 | 13F | Royal Bank Of Canada | 4 054 563 | 6,69 | 110 000 | 18,24 | ||||
| 2025-07-16 | 13F | Meridian Investment Counsel Inc. | 133 290 | 6,18 | 3 616 | 17,67 | ||||
| 2025-08-05 | 13F | Flynn Zito Capital Management, Llc | 28 945 | 31,44 | 785 | 45,64 | ||||
| 2025-08-08 | 13F | Larson Financial Group LLC | 2 350 | 0,00 | 64 | 10,53 | ||||
| 2025-05-15 | 13F/A | Orion Portfolio Solutions, LLC | 59 257 | −95,61 | 1 451 | −95,64 | ||||
| 2025-07-29 | 13F | Uhlmann Price Securities, Llc | 30 431 | 9,06 | 826 | 20,79 | ||||
| 2025-07-14 | 13F | Sowell Financial Services LLC | 9 997 | 271 | ||||||
| 2025-07-08 | 13F | Nbc Securities, Inc. | 112 944 | 14,92 | 3 | 50,00 | ||||
| 2025-08-04 | 13F | Assetmark, Inc | 2 349 | 64 | ||||||
| 2025-08-14 | 13F | GWM Advisors LLC | 1 273 119 | 7,62 | 34 540 | 19,26 | ||||
| 2025-08-14 | 13F | Ausdal Financial Partners, Inc. | 19 454 | 0,00 | 528 | 10,71 | ||||
| 2025-08-15 | 13F | CI Private Wealth, LLC | 164 371 | 4 459 | ||||||
| 2025-05-07 | 13F | JSF Financial, LLC | 0 | −100,00 | 0 | |||||
| 2025-07-17 | 13F | Worth Financial Advisory Group, LLC | 160 864 | 6,70 | 4 364 | 18,27 | ||||
| 2025-05-15 | 13F | Putnam Fl Investment Management Co | 0 | −100,00 | 0 | |||||
| 2025-08-11 | 13F | Landaas & Co /wi /adv | 61 556 | 283,43 | 1 670 | 324,94 | ||||
| 2025-07-22 | 13F | Confluence Wealth Services, Inc. | 1 615 462 | 6,77 | 43 827 | 20,34 | ||||
| 2025-07-29 | 13F | CapWealth Advisors, LLC | 12 506 | 0,00 | 339 | 10,78 | ||||
| 2025-08-12 | 13F | Entruity Wealth, LLC | 124 388 | 9,27 | 3 375 | 21,11 | ||||
| 2025-08-13 | 13F | Natixis Advisors, L.p. | 49 491 | 15,00 | 1 | 0,00 | ||||
| 2025-07-22 | 13F/A | Duncan Williams Asset Management, LLC | 55 116 | −8,93 | 1 495 | 0,95 | ||||
| 2025-07-21 | 13F | Ameriflex Group, Inc. | 0 | −100,00 | 0 | |||||
| 2025-07-30 | 13F | D.a. Davidson & Co. | 607 290 | −5,81 | 16 476 | 4,38 | ||||
| 2025-08-05 | 13F | Carolinas Wealth Consulting Llc | 0 | −100,00 | 0 | −100,00 | ||||
| 2025-08-13 | 13F | Marshall Wace, Llp | 8 523 | −83,78 | 231 | −82,04 | ||||
| 2025-08-04 | 13F | Daymark Wealth Partners, Llc | 350 108 | 0,56 | 9 498 | 11,45 | ||||
| 2025-07-29 | 13F | Stratos Wealth Partners, LTD. | 8 586 | 2,85 | 233 | 13,73 | ||||
| 2025-07-29 | 13F | Private Trust Co Na | 34 949 | 30,06 | 948 | 44,29 | ||||
| 2025-07-15 | 13F | Mather Group, Llc. | 0 | −100,00 | 0 | |||||
| 2025-08-12 | 13F | BlackRock, Inc. | 0 | −100,00 | 0 | |||||
| 2025-07-11 | 13F | Pinnacle Bancorp, Inc. | 2 425 | 0,00 | 66 | 10,17 | ||||
| 2025-08-06 | 13F | TKG Advisors, LLC | 186 234 | −30,20 | 5 053 | −22,65 | ||||
| 2025-08-08 | 13F | Avantax Advisory Services, Inc. | 106 712 | −23,42 | 2 895 | −15,13 | ||||
| 2025-08-05 | 13F | Sigma Planning Corp | 40 747 | −7,49 | 1 106 | 2,50 | ||||
| 2025-08-07 | 13F | Resources Investment Advisors, LLC. | 12 403 | 0,00 | 336 | 10,89 | ||||
| 2025-07-25 | 13F | Total Clarity Wealth Management, Inc. | 40 416 | 3,69 | 1 096 | 14,05 | ||||
| 2025-07-18 | 13F | Consolidated Planning Corp | 1 184 130 | 4,18 | 32 125 | 15,46 | ||||
| 2025-07-17 | 13F | Beacon Capital Management, LLC | 2 749 | 75 | ||||||
| 2025-08-01 | 13F | Envestnet Asset Management Inc | 1 426 720 | 3,74 | 38 707 | 14,97 | ||||
| 2025-08-13 | 13F | Northwestern Mutual Wealth Management Co | 7 511 528 | −1,80 | 203 788 | 8,83 | ||||
| 2025-07-24 | 13F | Endeavor Private Wealth, Inc. | 74 582 | 32,22 | 2 045 | 48,19 | ||||
| 2025-08-14 | 13F | CoreCap Advisors, LLC | 703 | 88,47 | 19 | 111,11 | ||||
| 2025-07-25 | 13F | Envestnet Portfolio Solutions, Inc. | 0 | −100,00 | 0 | |||||
| 2025-07-16 | 13F | Octavia Wealth Advisors, LLC | 10 532 | 1,63 | 289 | 13,83 | ||||
| 2025-08-12 | 13F | Cornerstone Wealth Management, LLC | 186 511 | 295,74 | 5 060 | 338,86 | ||||
| 2025-07-14 | 13F | BetterWealth, LLC | 525 246 | 9,57 | 14 250 | 21,42 | ||||
| 2025-07-23 | 13F | Armstrong, Fleming & Moore, Inc | 722 601 | 19 604 | ||||||
| 2025-08-13 | 13F | Capital International Investors | 40 278 | 0,01 | 1 093 | 10,86 | ||||
| 2025-08-14 | 13F | Investmark Advisory Group LLC | 83 025 | −23,22 | 2 252 | −14,92 | ||||
| 2025-08-06 | 13F | Simmons Bank | 10 362 | 0,00 | 281 | 11,07 | ||||
| 2025-08-08 | 13F | Creative Planning | 7 649 | −12,30 | 208 | −2,82 | ||||
| 2025-08-27 | 13F | Tribridge Partners Financial LLC | 320 257 | 9 |