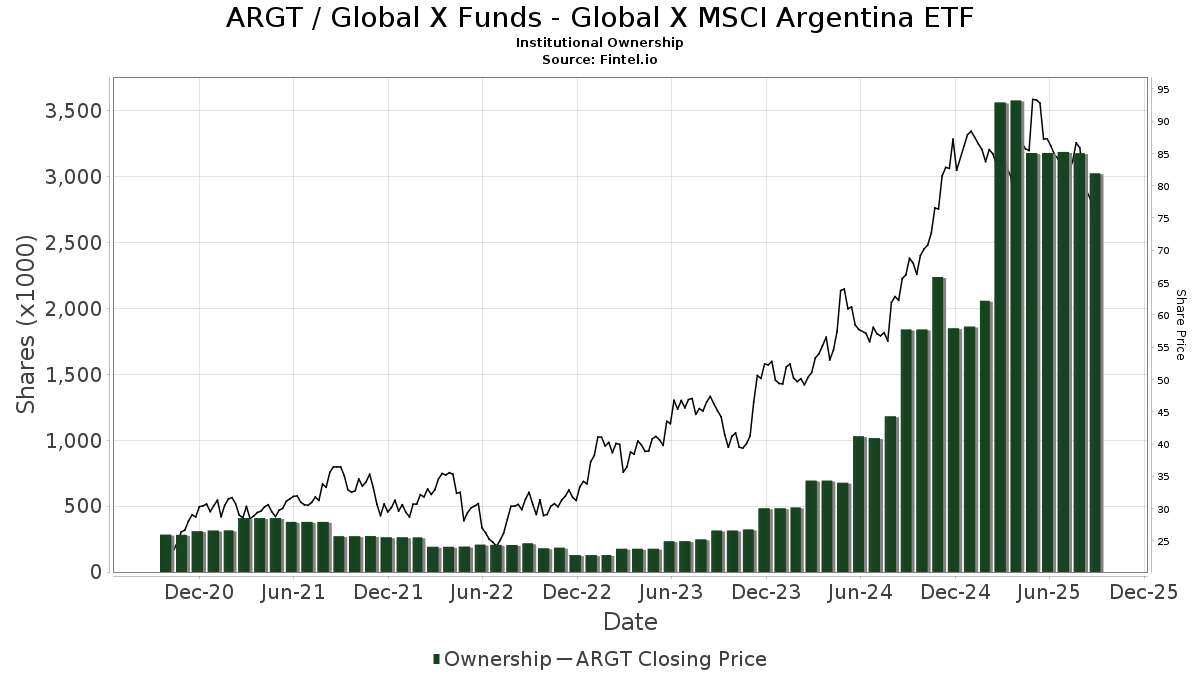
Grunnleggende statistikk
| Institusjonelle eiere | 125 total, 122 long only, 0 short only, 3 long/short - change of −2,34% MRQ |
| Gjennomsnittlig porteføljeallokering | 0.2899 % - change of 73,91% MRQ |
| Institusjonelle aksjer (Long) | 3 025 016 (ex 13D/G) - change of −0,16MM shares −4,99% MRQ |
| Institusjonell verdi (Long) | $ 223 809 USD ($1000) |
Institusjonelt eierskap og aksjonærer
Global X Funds - Global X MSCI Argentina ETF (US:ARGT) har 125 institusjonelle eiere og aksjonærer som har sendt inn 13D/G- eller 13F-skjemaer til Securities Exchange Commission (SEC). Disse institusjonene eier til sammen 3,025,016 aksjer. De største aksjonærene inkluderer Bank Julius Baer & Co. Ltd, Zurich, Duquesne Family Office LLC, Marshall Wace, Llp, Breakout Capital Partners, LP, LPL Financial LLC, Morgan Stanley, Bank Of America Corp /de/, Susquehanna International Group, Llp, Activest Wealth Management, and Moran Wealth Management, LLC .
Global X Funds - Global X MSCI Argentina ETF (ARCA:ARGT) institusjonell eierstruktur viser nåværende posisjoner i selskapet fordelt på institusjoner og fond, samt de siste endringene i posisjonsstørrelse. De største aksjonærene kan være individuelle investorer, verdipapirfond, hedgefond eller institusjoner. Schedule 13D indikerer at investoren eier (eller har eid) mer enn 5 % av selskapet og har til hensikt (eller hadde til hensikt) å aktivt forfølge en endring i forretningsstrategien. Schedule 13G indikerer en passiv investering på over 5 %.
The share price as of September 11, 2025 is 73,41 / share. Previously, on September 11, 2024, the share price was 66,20 / share. This represents an increase of 10,89% over that period.
Fondssentiment-score
Fondssentiment Score (også kjent som akkumulering av eierskap poengsum) viser hvilke aksjer som er mest kjøpt av fond. Den er resultatet av en sofistikert, kvantitativ flerfaktormodell som identifiserer selskaper med de høyeste nivåene av institusjonell akkumulering. Beregningsmodellen for poeng bruker en kombinasjon av den totale økningen i antall offentliggjorte eiere, endringer i porteføljeallokeringen til disse eierne og andre beregninger. Tallet går fra 0 til 100, der høyere tall indikerer en høyere grad av akkumulering i forhold til sammenlignbare selskaper, der 50 er gjennomsnittet.
Oppdateringsfrekvens: Daglig
Sjekk ut Ownership Explorer, som inneholder en liste over de høyest rangerte selskapene.
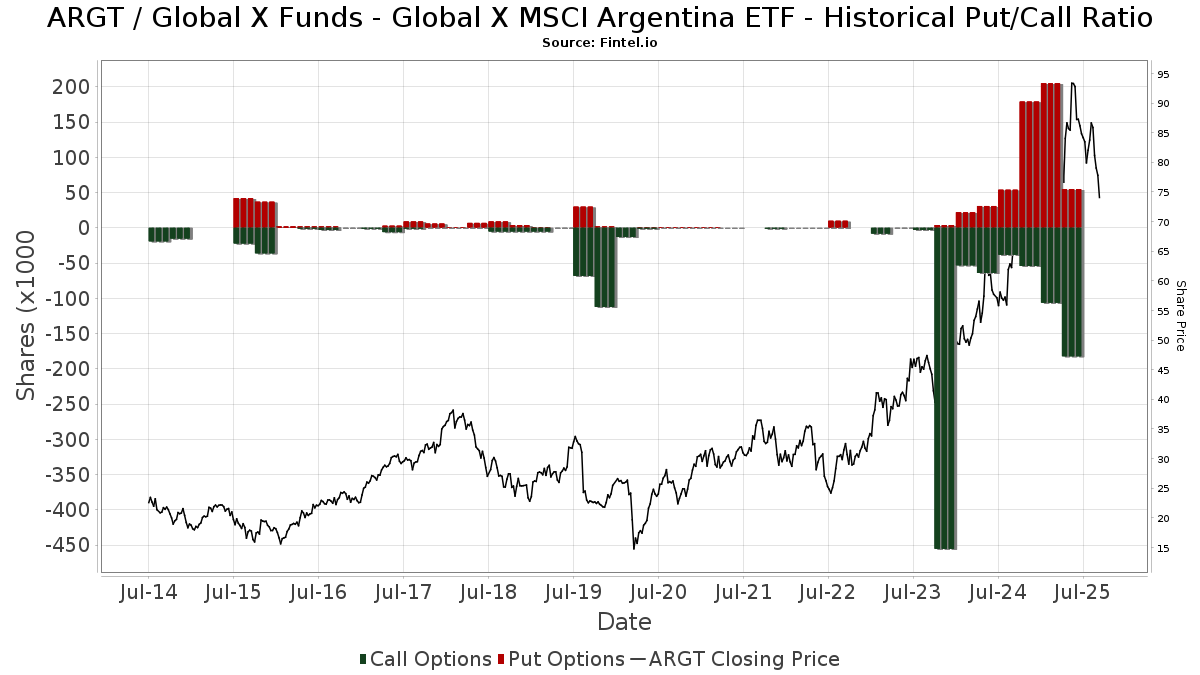
Institusjonell Put/Call-forhold
I tillegg til å rapportere standard aksje- og gjeldsemisjoner må institusjoner med mer enn 100 millioner kroner i forvaltningskapital også oppgi beholdningen av put- og callopsjoner. Siden put-opsjoner generelt indikerer et negativt sentiment, og call-opsjoner indikerer et positivt sentiment, kan vi få et inntrykk av det generelle institusjonelle sentimentet ved å plotte forholdet mellom put- og call-opsjoner. Diagrammet til høyre viser det historiske forholdet mellom put- og call-opsjoner for dette instrumentet.
Ved å bruke Put/Call-forholdet som en indikator på investorsentimentet kan man overvinne en av de viktigste svakhetene ved å bruke totalt institusjonelt eierskap, nemlig at en betydelig andel av forvaltningskapitalen investeres passivt for å følge indekser. Passivt forvaltede fond kjøper vanligvis ikke opsjoner, slik at indikatoren for put/call-forhold i større grad gjenspeiler stemningen i aktivt forvaltede fond.
13F- og NPORT-arkiveringer
Detaljer om 13F-arkiveringer er gratis. Detaljer om NP-arkiveringer krever et premium-medlemskap. Grønne rader indikerer nye posisjoner. Røde rader indikerer lukkede posisjoner. Klikk på lenke ikonet for å se hele transaksjonshistorikken.
Oppgrader
for å låse opp premiedata og eksportere til Excel. ![]() .
.
| Fildato | Kilde | Investor | Type | Gjennomsnittlig pris (estimert) |
Aksjer | Δ Aksjer (%) |
Rapportert verdi ($1000) | Verdi (%) | Portallokering (%) | |
|---|---|---|---|---|---|---|---|---|---|---|
| 2025-07-31 | 13F | Leavell Investment Management, Inc. | 4 361 | 370 | ||||||
| 2025-08-08 | 13F | Pnc Financial Services Group, Inc. | 200 | −74,03 | 17 | −5,88 | ||||
| 2025-08-14 | 13F | Qube Research & Technologies Ltd | 63 461 | 95,14 | 5 377 | 104,76 | ||||
| 2025-08-14 | 13F | Millennium Management Llc | 3 732 | −78,50 | 316 | −77,46 | ||||
| 2025-08-19 | 13F | Advisory Services Network, LLC | 3 450 | 33,46 | 285 | 37,02 | ||||
| 2025-07-29 | 13F | Activest Wealth Management | 96 240 | 1,13 | 8 154 | 6,09 | ||||
| 2025-08-15 | 13F | Duquesne Family Office LLC | 267 700 | −39,68 | 23 | −37,14 | ||||
| 2025-07-29 | 13F | Stratos Wealth Partners, LTD. | 2 491 | 0,00 | 211 | 4,98 | ||||
| 2025-05-12 | 13F | Citigroup Inc | 0 | −100,00 | 0 | |||||
| 2025-08-14 | 13F | LMR Partners LLP | 0 | −100,00 | 0 | |||||
| 2025-07-28 | 13F | Moran Wealth Management, LLC | 82 007 | 2,06 | 6 948 | 7,07 | ||||
| 2025-08-11 | 13F | Private Advisor Group, LLC | 29 330 | 18,92 | 2 485 | 24,75 | ||||
| 2025-08-12 | 13F | Jpmorgan Chase & Co | 55 419 | 39,99 | 4 696 | 46,86 | ||||
| 2025-05-12 | 13F | Founders Financial Securities Llc | 0 | −100,00 | 0 | |||||
| 2025-08-18 | 13F | Wolverine Trading, Llc | Call | 0 | −100,00 | 0 | ||||
| 2025-07-30 | 13F | Loring Wolcott & Coolidge Fiduciary Advisors Llp/ma | 4 645 | 394 | ||||||
| 2025-08-14 | 13F | Kite Lake Capital Management (uk) Llp | 40 000 | 0,00 | 3 389 | 4,92 | ||||
| 2025-08-14 | 13F | Barometer Capital Management Inc. | 5 300 | 253,33 | 449 | 271,07 | ||||
| 2025-08-04 | 13F | Bay Colony Advisory Group, Inc d/b/a Bay Colony Advisors | 0 | −100,00 | 0 | −100,00 | ||||
| 2025-04-30 | 13F | BCJ Capital Management, LLC | 0 | −100,00 | 0 | |||||
| 2025-07-30 | 13F | Cavalier Investments, LLC | 22 781 | −1,98 | 1 930 | 2,82 | ||||
| 2025-07-31 | 13F | Cambridge Investment Research Advisors, Inc. | 18 799 | 34,17 | 2 | 0,00 | ||||
| 2025-07-10 | 13F | Contravisory Investment Management, Inc. | 5 697 | 483 | ||||||
| 2025-08-14 | 13F | Intrepid Family Office Llc | 15 000 | 50,00 | 1 271 | 57,37 | ||||
| 2025-08-14 | 13F | Ameriprise Financial Inc | 40 723 | 1,72 | 3 450 | 6,71 | ||||
| 2025-05-14 | 13F | Absolute Gestao de Investimentos Ltda. | 0 | −100,00 | 0 | |||||
| 2025-08-15 | 13F | Harvest Fund Management Co., Ltd | 0 | −100,00 | 0 | |||||
| 2025-07-15 | 13F | SJS Investment Consulting Inc. | 21 | −12,50 | 2 | 0,00 | ||||
| 2025-08-15 | 13F | Tower Research Capital LLC (TRC) | 621 | 918,03 | 53 | 2 500,00 | ||||
| 2025-08-14 | 13F | Royal Bank Of Canada | 19 753 | 29,78 | 1 673 | 36,13 | ||||
| 2025-05-13 | 13F | Waratah Capital Advisors Ltd. | 0 | −100,00 | 0 | |||||
| 2025-05-14 | 13F | CI Private Wealth, LLC | 0 | −100,00 | 0 | |||||
| 2025-08-19 | 13F | National Asset Management, Inc. | 3 085 | 261 | ||||||
| 2025-08-05 | 13F | Carolinas Wealth Consulting Llc | 0 | −100,00 | 0 | −100,00 | ||||
| 2025-07-11 | 13F | Grove Bank & Trust | 25 | 2 | ||||||
| 2025-07-29 | 13F | Primoris Wealth Advisors, Llc | 0 | −100,00 | 0 | |||||
| 2025-08-05 | 13F | Simplex Trading, Llc | 0 | −100,00 | 0 | |||||
| 2025-08-06 | 13F | Commonwealth Equity Services, Llc | 13 078 | 18,28 | 1 | |||||
| 2025-08-13 | 13F | Berbice Capital Management LLC | 300 | 0,00 | 25 | 4,17 | ||||
| 2025-08-05 | 13F | Bank Of Montreal /can/ | 383 | −64,00 | 33 | −62,35 | ||||
| 2025-07-10 | 13F | Wealth Enhancement Advisory Services, Llc | 3 652 | −20,87 | 310 | −16,67 | ||||
| 2025-08-06 | 13F | Csenge Advisory Group | 20 802 | 0,35 | 1 877 | 5,57 | ||||
| 2025-08-11 | 13F | HighTower Advisors, LLC | 7 560 | −29,12 | 641 | −25,67 | ||||
| 2025-07-22 | 13F | DAVENPORT & Co LLC | 3 667 | 6,63 | 311 | 11,91 | ||||
| 2025-07-22 | 13F | Kercheville Advisors, LLC | 4 000 | −42,86 | 339 | −40,18 | ||||
| 2025-08-01 | 13F | Belvedere Trading LLC | 21 033 | 2,46 | 1 782 | 7,48 | ||||
| 2025-08-01 | 13F | Belvedere Trading LLC | Call | 15 800 | 295,00 | 1 339 | 314,24 | |||
| 2025-05-07 | 13F | Chandler Asset Management, Inc. | 0 | −100,00 | 0 | |||||
| 2025-08-01 | 13F | Belvedere Trading LLC | Put | 13 000 | 2 066,67 | 1 101 | 2 193,75 | |||
| 2025-08-14 | 13F | Two Sigma Securities, Llc | 7 131 | 604 | ||||||
| 2025-07-31 | 13F | Glass Jacobson Investment Advisors llc | 0 | −100,00 | 0 | |||||
| 2025-08-11 | 13F | TD Waterhouse Canada Inc. | 303 | −96,12 | 25 | −96,07 | ||||
| 2025-08-05 | 13F | Verity Asset Management, Inc. | 0 | −100,00 | 0 | |||||
| 2025-08-14 | 13F | Bank Of America Corp /de/ | 151 933 | 0,60 | 12 873 | 5,53 | ||||
| 2025-08-14 | 13F/A | Bank Julius Baer & Co. Ltd, Zurich | 284 421 | 13,57 | 24 099 | 5,41 | ||||
| 2025-07-29 | 13F | Fundamentun, Llc | 39 434 | 38,59 | 3 341 | 45,39 | ||||
| 2025-08-14 | 13F | DZ BANK AG Deutsche Zentral Genossenschafts Bank, Frankfurt am Main | 5 900 | 0,00 | 500 | 4,83 | ||||
| 2025-05-15 | 13F | Integrated Wealth Concepts LLC | 0 | −100,00 | 0 | |||||
| 2025-08-13 | 13F | Basso Capital Management, L.p. | 25 | −99,43 | 2 | −99,43 | ||||
| 2025-07-28 | 13F | Harbour Investments, Inc. | 50 | 0,00 | 4 | 0,00 | ||||
| 2025-08-14 | 13F | Schonfeld Strategic Advisors LLC | 0 | −100,00 | 0 | |||||
| 2025-08-13 | 13F | Coco Enterprises, LLC | 20 102 | 11,57 | 1 703 | 34,52 | ||||
| 2025-08-14 | 13F | Hrt Financial Lp | 7 501 | 35,06 | 1 | |||||
| 2025-07-28 | NP | AGOX - Adaptive Growth Opportunities ETF | 22 741 | −3,07 | 2 052 | 5,61 | ||||
| 2025-08-08 | 13F | Smithfield Trust Co | 237 | 0,00 | 0 | |||||
| 2025-03-25 | NP | FEDERATED CORE TRUST - Emerging Markets Core Fund This fund is a listed as child fund of Federated Hermes, Inc. and if that institution has disclosed ownership in this security, then these positions will not be double counted when calculating total shares and total value | 12 524 | 1 083 | ||||||
| 2025-08-12 | 13F | Proequities, Inc. | 0 | 0 | ||||||
| 2025-08-08 | 13F | Cetera Investment Advisers | 7 366 | −29,44 | 624 | −25,98 | ||||
| 2025-07-24 | 13F | Capital Advisors, Ltd. LLC | 581 | 0,00 | 0 | |||||
| 2025-08-14 | 13F | Banco BTG Pactual S.A. | 0 | −100,00 | 0 | |||||
| 2025-07-07 | 13F | Roxbury Financial LLC | 35 | 0,00 | 3 | 0,00 | ||||
| 2025-07-28 | 13F | Copia Wealth Management | 0 | −100,00 | 0 | |||||
| 2025-08-14 | 13F | FIL Ltd | 612 | 4,79 | 53 | 10,64 | ||||
| 2025-08-06 | 13F | AE Wealth Management LLC | 171 | 14 | ||||||
| 2025-08-14 | 13F | Stifel Financial Corp | 15 059 | −0,49 | 1 276 | 4,34 | ||||
| 2025-08-14 | 13F | Militia Capital Partners, LP | 0 | −100,00 | 0 | |||||
| 2025-08-01 | 13F | Envestnet Asset Management Inc | 0 | −100,00 | 0 | |||||
| 2025-08-14 | 13F | Gordian Capital Singapore Pte Ltd | 1 900 | −57,78 | 161 | −57,22 | ||||
| 2025-08-12 | 13F | Trexquant Investment LP | 2 838 | −7,32 | 240 | −2,83 | ||||
| 2025-07-24 | 13F | Blair William & Co/il | 25 | 0,00 | 2 | 0,00 | ||||
| 2025-08-12 | 13F | Global Retirement Partners, LLC | 71 | 0,00 | 6 | 20,00 | ||||
| 2025-08-13 | 13F | Global Endowment Management, LP | 12 000 | 0,00 | 1 017 | 4,85 | ||||
| 2025-08-18 | 13F | Geneos Wealth Management Inc. | 485 | −95,65 | 41 | −95,45 | ||||
| 2025-05-15 | 13F | Hilltop Holdings Inc. | 0 | −100,00 | 0 | |||||
| 2025-05-15 | 13F | Southpoint Capital Advisors LP | 0 | −100,00 | 0 | |||||
| 2025-07-07 | 13F | Park Edge Advisors, LLC | 6 844 | 21,09 | 580 | 26,97 | ||||
| 2025-07-16 | 13F | ORG Partners LLC | 20 | 0,00 | 2 | 0,00 | ||||
| 2025-08-14 | 13F | D. E. Shaw & Co., Inc. | 55 854 | 42,49 | 4 733 | 49,46 | ||||
| 2025-08-13 | 13F | Renaissance Technologies Llc | 17 239 | 1 461 | ||||||
| 2025-08-18 | 13F/A | National Bank Of Canada /fi/ | 210 | 2 000,00 | 18 | |||||
| 2025-04-17 | 13F | Good Life Advisors, LLC | 0 | −100,00 | 0 | |||||
| 2025-08-08 | 13F | Itau Unibanco Holding S.A. | 16 282 | 1 380 | ||||||
| 2025-08-14 | 13F | Private Wealth Advisors, LLC | 26 581 | 2 252 | ||||||
| 2025-08-14 | 13F | UBS Group AG | 7 094 | −64,71 | 601 | −62,97 | ||||
| 2025-07-24 | 13F | Us Bancorp \de\ | 5 590 | 0,00 | 474 | 4,88 | ||||
| 2025-08-06 | 13F | Prospera Financial Services Inc | 0 | −100,00 | 0 | −100,00 | ||||
| 2025-08-08 | 13F | Gts Securities Llc | 2 955 | 250 | ||||||
| 2025-08-12 | 13F | LPL Financial LLC | 171 520 | 1,11 | 14 533 | 6,07 | ||||
| 2025-07-14 | 13F | Sowell Financial Services LLC | 12 373 | −0,98 | 1 048 | 3,87 | ||||
| 2025-07-29 | 13F | Stratos Wealth Advisors, LLC | 2 745 | −82,05 | 233 | −81,20 | ||||
| 2025-08-14 | 13F | Atomi Financial Group, Inc. | 0 | −100,00 | 0 | |||||
| 2025-08-11 | 13F | Strategic Wealth Partners, Ltd. | 531 | 45 | ||||||
| 2025-08-14 | 13F | Nwi Management Lp | 8 900 | 0,00 | 1 | |||||
| 2025-08-13 | 13F | Marshall Wace, Llp | 230 361 | 1 074,11 | 19 518 | 1 132,20 | ||||
| 2025-08-14 | 13F | Old Mission Capital Llc | 59 212 | −23,18 | 5 017 | −19,41 | ||||
| 2025-08-07 | 13F | Allworth Financial LP | 300 | 25 | ||||||
| 2025-07-14 | 13F | Legacy Capital Group California, Inc. | 5 642 | 478 | ||||||
| 2025-08-13 | 13F | VestGen Advisors, LLC | 0 | −100,00 | 0 | |||||
| 2025-08-14 | 13F | Breakout Capital Partners, LP | 192 800 | 16 336 | ||||||
| 2025-08-13 | 13F | Twin Peaks Wealth Advisors, LLC | 30 | 3 | ||||||
| 2025-05-13 | 13F | M Holdings Securities, Inc. | 0 | −100,00 | 0 | |||||
| 2025-05-15 | 13F | Fundsmith Investment Services Ltd. | 0 | −100,00 | 0 | −100,00 | ||||
| 2025-08-13 | 13F | Walleye Capital LLC | 0 | −100,00 | 0 | |||||
| 2025-05-06 | 13F | Financial & Tax Architects, LLC | 0 | −100,00 | 0 | |||||
| 2025-08-04 | 13F | Creative Financial Designs Inc /adv | 3 149 | −1,04 | 267 | 3,91 | ||||
| 2025-08-12 | 13F | SRS Capital Advisors, Inc. | 2 | −60,00 | 0 | |||||
| 2025-08-14 | 13F | CoreCap Advisors, LLC | 35 908 | 10,10 | 3 042 | 15,49 | ||||
| 2025-08-14 | 13F | Toroso Investments, LLC | 25 808 | 5,26 | 2 187 | 10,40 | ||||
| 2025-08-19 | 13F | Slocum, Gordon & Co LLP | 0 | −100,00 | 0 | |||||
| 2025-08-08 | 13F | City Of London Investment Management Co Ltd | 34 400 | 14,67 | 2 915 | 20,26 | ||||
| 2025-09-04 | 13F/A | Advisor Group Holdings, Inc. | 5 236 | −30,90 | 444 | −27,50 | ||||
| 2025-07-30 | 13F | Crewe Advisors LLC | 63 | 0,00 | 5 | 0,00 | ||||
| 2025-07-23 | 13F | MADDEN SECURITIES Corp | 3 000 | 0,00 | 254 | 4,96 | ||||
| 2025-08-14 | 13F | Citadel Advisors Llc | Call | 44 500 | 28,61 | 3 770 | 34,93 | |||
| 2025-08-14 | 13F | Fmr Llc | 1 591 | 0,00 | 137 | 6,25 | ||||
| 2025-05-16 | 13F | Cape Investment Advisory, Inc. | 0 | −100,00 | 0 | −100,00 | ||||
| 2025-07-09 | 13F | Client First Investment Management LLC | 0 | −100,00 | 0 | −100,00 | ||||
| 2025-08-14 | 13F | Raymond James Financial Inc | 10 283 | −97,43 | 871 | −97,30 | ||||
| 2025-07-10 | 13F | Family Legacy Financial Solutions, LLC | 60 | 5 | ||||||
| 2025-08-14 | 13F | Comerica Bank | 268 | 0,00 | 23 | 4,76 | ||||
| 2025-08-15 | 13F | Morgan Stanley | 163 931 | 27,92 | 13 890 | 34,18 | ||||
| 2025-05-15 | 13F | Polymer Capital Management (HK) LTD | 0 | −100,00 | 0 | |||||
| 2025-07-22 | 13F | Miracle Mile Advisors, LLC | 0 | −100,00 | 0 | |||||
| 2025-07-30 | NP | ENDW - Cambria Endowment Style ETF | 318 | 29 | ||||||
| 2025-04-22 | 13F | Channing Global Advisors, Llc | 0 | −100,00 | 0 | |||||
| 2025-08-07 | 13F | Laffer Investments | 2 571 | 218 | ||||||
| 2025-08-14 | 13F | Schonfeld Strategic Advisors LLC | Put | 0 | −100,00 | 0 | ||||
| 2025-07-11 | 13F | Farther Finance Advisors, LLC | 33 | 0,00 | 3 | 0,00 | ||||
| 2025-08-11 | 13F | Rothschild Investment Llc | 200 | 0,00 | 17 | 0,00 | ||||
| 2025-08-12 | 13F | Steward Partners Investment Advisory, Llc | 1 091 | 60,68 | 92 | 70,37 | ||||
| 2025-08-14 | 13F | Citadel Advisors Llc | 45 224 | −57,36 | 3 832 | −55,27 | ||||
| 2025-08-14 | 13F | Jane Street Group, Llc | 76 170 | 48,94 | 6 454 | 56,25 | ||||
| 2025-08-14 | 13F | CIBC World Markets Inc. | 3 568 | 16,60 | 302 | 22,27 | ||||
| 2025-08-14 | 13F | Citadel Advisors Llc | Put | 31 000 | −29,22 | 2 627 | −25,76 | |||
| 2025-08-08 | 13F | Glaxis Capital Management, LLC | 30 000 | 2 542 | ||||||
| 2025-07-15 | 13F | Optima Capital Llc | 7 327 | 11,27 | 621 | 16,95 | ||||
| 2025-08-11 | 13F | Principal Securities, Inc. | 249 | −21,94 | 21 | −19,23 | ||||
| 2025-08-14 | 13F | Susquehanna International Group, Llp | Put | 11 400 | −89,71 | 966 | −89,22 | |||
| 2025-07-14 | 13F | Ridgewood Investments LLC | 600 | 0,00 | 51 | 4,17 | ||||
| 2025-08-14 | 13F | Susquehanna International Group, Llp | 66 625 | −22,31 | 5 645 | −18,50 | ||||
| 2025-04-14 | 13F | Wedmont Private Capital | 0 | −100,00 | 0 | |||||
| 2025-08-14 | 13F | Riggs Asset Managment Co. Inc. | 1 309 | 1 977,78 | 111 | 2 100,00 | ||||
| 2025-08-13 | 13F | Colonial Trust Co / SC | 0 | −100,00 | 0 | |||||
| 2025-08-13 | 13F | Federated Hermes, Inc. | 0 | −100,00 | 0 | |||||
| 2025-08-11 | 13F | Parametrica Management Ltd | 5 400 | 0,00 | 458 | 4,82 | ||||
| 2025-04-29 | 13F | Pensionmark Financial Group, Llc | 0 | −100,00 | 0 | |||||
| 2025-07-30 | 13F | Whittier Trust Co | 2 477 | 0,00 | 210 | 4,50 | ||||
| 2025-04-24 | 13F | Wright Fund Managment, LLC | 0 | −100,00 | 0 | |||||
| 2025-08-14 | 13F | Susquehanna International Group, Llp | Call | 121 900 | 104,19 | 10 329 | 114,23 | |||
| 2025-08-14 | 13F | Group One Trading, L.p. | 1 681 | 740,50 | 142 | 787,50 | ||||
| 2025-08-14 | 13F | Aprio Wealth Management, LLC | 6 000 | 3,00 | 508 | 8,09 | ||||
| 2025-08-14 | 13F | Bnp Paribas Arbitrage, Sa | 3 206 | −19,99 | 272 | −16,10 | ||||
| 2025-04-22 | 13F | Jfs Wealth Advisors, Llc | 0 | −100,00 | 0 | |||||
| 2025-08-07 | 13F | Encompass More Asset Management | 19 892 | 1 685 | ||||||
| 2025-07-10 | 13F | Rfg Holdings, Inc. | 27 755 | 2,16 | 2 352 | 7,16 | ||||
| 2025-08-13 | 13F | Northwestern Mutual Wealth Management Co | 0 | −100,00 | 0 | |||||
| 2025-08-13 | 13F | Flow Traders U.s. Llc | 69 866 | 6 | ||||||
| 2025-08-14 | 13F | Wells Fargo & Company/mn | 296 | −99,64 | 25 | −99,62 | ||||
| 2025-07-23 | 13F | Clear Creek Financial Management, LLC | 19 453 | 15,46 | 1 648 | 21,18 | ||||
| 2025-08-13 | 13F | Capital Analysts, Inc. | 0 | −100,00 | 0 | |||||
| 2025-08-14 | 13F | Blue Capital, Inc. | 0 | −100,00 | 0 | |||||
| 2025-08-13 | 13F | StoneX Group Inc. | 0 | −100,00 | 0 | −100,00 | ||||
| 2025-07-30 | 13F | Brookstone Capital Management | 6 223 | 1,63 | 527 | 6,68 | ||||
| 2025-07-24 | 13F | Verde Servicos Internacionais S.A. | 0 | −100,00 | 0 | |||||
| 2025-08-14 | 13F | Federation des caisses Desjardins du Quebec | 280 | 24 | ||||||
| 2025-07-09 | 13F | Fiduciary Alliance LLC | 23 420 | 28,53 | 1 984 | 34,87 | ||||
| 2025-08-13 | 13F | EverSource Wealth Advisors, LLC | 2 | 0 | ||||||
| 2025-07-29 | 13F | Private Trust Co Na | 399 | 0,00 | 34 | 3,13 | ||||
| 2025-08-04 | 13F | Spire Wealth Management | 4 593 | 83,57 | 418 | 106,93 | ||||
| 2025-07-01 | 13F | Harbor Investment Advisory, Llc | 250 | −83,33 | 21 | −82,64 | ||||
| 2025-08-14 | 13F | Banque Transatlantique SA | 0 | −100,00 | 0 | |||||
| 2025-06-27 | NP | GIAX - Nicholas Global Equity and Income ETF | 24 519 | −4,80 | 2 101 | −5,66 | ||||
| 2025-08-15 | 13F | Kestra Advisory Services, LLC | 0 | −100,00 | 0 | |||||
| 2025-08-14 | 13F | Sona Asset Management (us) Llc | 27 000 | −28,00 | 2 288 | −24,47 | ||||
| 2025-05-12 | 13F | Independent Advisor Alliance | 0 | −100,00 | 0 |