Grunnleggende statistikk
| Institusjonelle eiere | 212 total, 212 long only, 0 short only, 0 long/short - change of 3,92% MRQ |
| Gjennomsnittlig porteføljeallokering | 0.3177 % - change of −1,34% MRQ |
| Institusjonelle aksjer (Long) | 7 309 441 (ex 13D/G) - change of 0,74MM shares 11,30% MRQ |
| Institusjonell verdi (Long) | $ 391 963 USD ($1000) |
Institusjonelt eierskap og aksjonærer
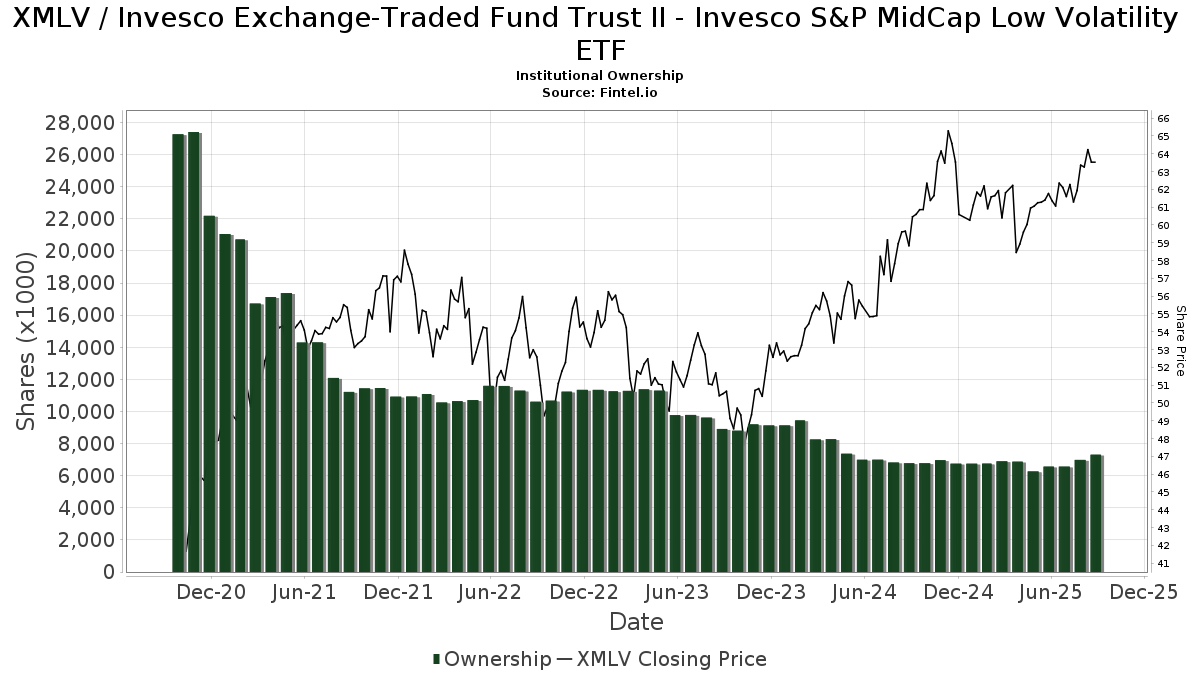
Invesco Exchange-Traded Fund Trust II - Invesco S&P MidCap Low Volatility ETF (US:XMLV) har 212 institusjonelle eiere og aksjonærer som har sendt inn 13D/G- eller 13F-skjemaer til Securities Exchange Commission (SEC). Disse institusjonene eier til sammen 7,309,441 aksjer. De største aksjonærene inkluderer LPL Financial LLC, Morgan Stanley, Cambridge Investment Research Advisors, Inc., Brookstone Capital Management, UBS Group AG, Envestnet Asset Management Inc, DORVAL Corp, Ameriprise Financial Inc, Commonwealth Equity Services, Llc, and Pnc Financial Services Group, Inc. .
Invesco Exchange-Traded Fund Trust II - Invesco S&P MidCap Low Volatility ETF (ARCA:XMLV) institusjonell eierstruktur viser nåværende posisjoner i selskapet fordelt på institusjoner og fond, samt de siste endringene i posisjonsstørrelse. De største aksjonærene kan være individuelle investorer, verdipapirfond, hedgefond eller institusjoner. Schedule 13D indikerer at investoren eier (eller har eid) mer enn 5 % av selskapet og har til hensikt (eller hadde til hensikt) å aktivt forfølge en endring i forretningsstrategien. Schedule 13G indikerer en passiv investering på over 5 %.
The share price as of September 9, 2025 is 63,72 / share. Previously, on September 10, 2024, the share price was 59,05 / share. This represents an increase of 7,91% over that period.
Fondssentiment-score
Fondssentiment Score (også kjent som akkumulering av eierskap poengsum) viser hvilke aksjer som er mest kjøpt av fond. Den er resultatet av en sofistikert, kvantitativ flerfaktormodell som identifiserer selskaper med de høyeste nivåene av institusjonell akkumulering. Beregningsmodellen for poeng bruker en kombinasjon av den totale økningen i antall offentliggjorte eiere, endringer i porteføljeallokeringen til disse eierne og andre beregninger. Tallet går fra 0 til 100, der høyere tall indikerer en høyere grad av akkumulering i forhold til sammenlignbare selskaper, der 50 er gjennomsnittet.
Oppdateringsfrekvens: Daglig
Sjekk ut Ownership Explorer, som inneholder en liste over de høyest rangerte selskapene.
Institusjonell Put/Call-forhold
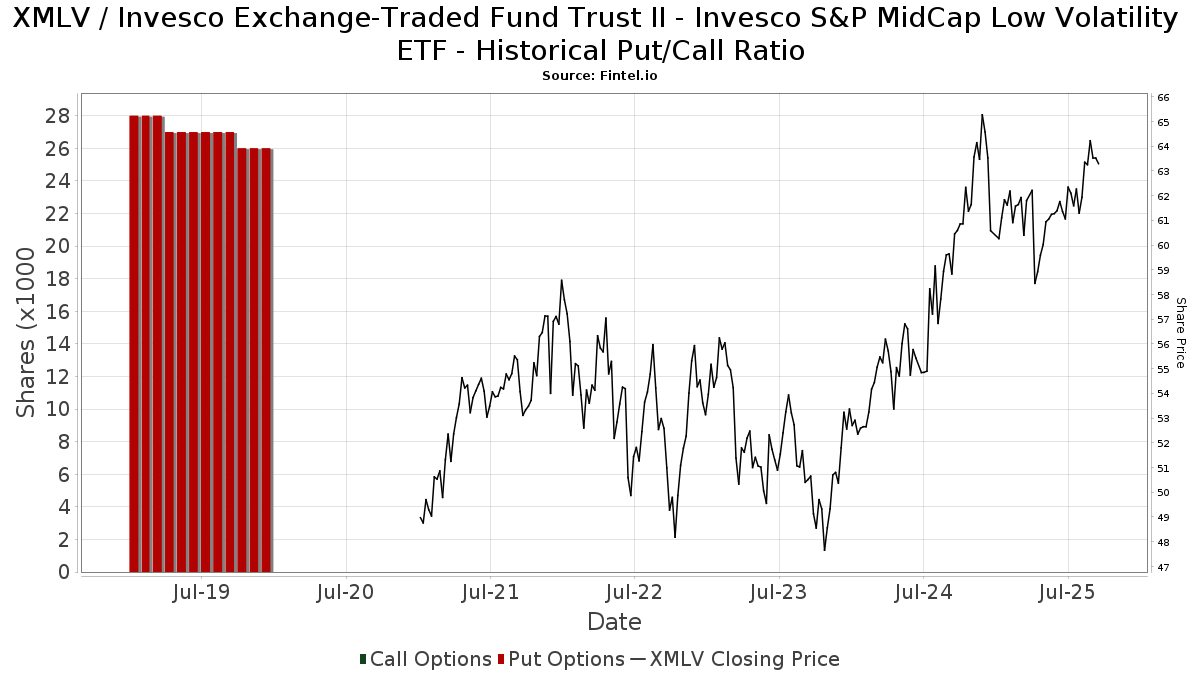
I tillegg til å rapportere standard aksje- og gjeldsemisjoner må institusjoner med mer enn 100 millioner kroner i forvaltningskapital også oppgi beholdningen av put- og callopsjoner. Siden put-opsjoner generelt indikerer et negativt sentiment, og call-opsjoner indikerer et positivt sentiment, kan vi få et inntrykk av det generelle institusjonelle sentimentet ved å plotte forholdet mellom put- og call-opsjoner. Diagrammet til høyre viser det historiske forholdet mellom put- og call-opsjoner for dette instrumentet.
Ved å bruke Put/Call-forholdet som en indikator på investorsentimentet kan man overvinne en av de viktigste svakhetene ved å bruke totalt institusjonelt eierskap, nemlig at en betydelig andel av forvaltningskapitalen investeres passivt for å følge indekser. Passivt forvaltede fond kjøper vanligvis ikke opsjoner, slik at indikatoren for put/call-forhold i større grad gjenspeiler stemningen i aktivt forvaltede fond.
13F- og NPORT-arkiveringer
Detaljer om 13F-arkiveringer er gratis. Detaljer om NP-arkiveringer krever et premium-medlemskap. Grønne rader indikerer nye posisjoner. Røde rader indikerer lukkede posisjoner. Klikk på lenke ikonet for å se hele transaksjonshistorikken.
Oppgrader
for å låse opp premiedata og eksportere til Excel. ![]() .
.
| Fildato | Kilde | Investor | Type | Gjennomsnittlig pris (estimert) |
Aksjer | Δ Aksjer (%) |
Rapportert verdi ($1000) | Verdi (%) | Portallokering (%) | |
|---|---|---|---|---|---|---|---|---|---|---|
| 2025-07-23 | 13F | Prime Capital Investment Advisors, LLC | 37 584 | −0,93 | 2 318 | −1,03 | ||||
| 2025-08-14 | 13F | Avid Wealth Partners LLC | 140 478 | 24,77 | 8 663 | 24,68 | ||||
| 2025-08-12 | 13F | Jpmorgan Chase & Co | 140 226 | 25,51 | 8 648 | 25,41 | ||||
| 2025-07-29 | 13F | Portland Financial Advisors Inc | 11 809 | 0,00 | 728 | 0,00 | ||||
| 2025-07-24 | 13F | Blair William & Co/il | 1 395 | −5,74 | 86 | −5,49 | ||||
| 2025-08-14 | 13F | Wiley Bros.-aintree Capital, Llc | 5 553 | 4,22 | 342 | 4,91 | ||||
| 2025-08-14 | 13F | Warren Averett Asset Management, LLC | 11 460 | 707 | ||||||
| 2025-07-22 | 13F | Legacy Trust | 0 | −100,00 | 0 | |||||
| 2025-08-12 | 13F | Change Path, LLC | 16 488 | −0,13 | 1 017 | −0,20 | ||||
| 2025-05-01 | 13F | Quest 10 Wealth Builders, Inc. | 0 | −100,00 | 0 | |||||
| 2025-07-17 | 13F | Janney Montgomery Scott LLC | 14 826 | 5,04 | 1 | |||||
| 2025-07-24 | 13F | Jfs Wealth Advisors, Llc | 21 391 | 2,40 | 1 319 | 2,33 | ||||
| 2025-08-07 | 13F | Runnymede Capital Advisors, Inc. | 0 | −100,00 | 0 | |||||
| 2025-07-22 | 13F | Merit Financial Group, LLC | 3 590 | 0,34 | 221 | 0,45 | ||||
| 2025-08-14 | 13F | EP Wealth Advisors, Inc. | 3 160 | 0,00 | 195 | −0,51 | ||||
| 2025-07-09 | 13F | Dynamic Advisor Solutions LLC | 6 495 | 1,09 | 401 | 1,01 | ||||
| 2025-07-14 | 13F | Ridgewood Investments LLC | 2 925 | 0,00 | 180 | 0,00 | ||||
| 2025-08-14 | 13F | Royal Bank Of Canada | 87 488 | −4,28 | 5 395 | −4,36 | ||||
| 2025-08-19 | 13F | Asset Dedication, LLC | 4 275 | 0,00 | 264 | 0,00 | ||||
| 2025-07-21 | 13F | Ameritas Advisory Services, LLC | 10 110 | −24,34 | 623 | −23,56 | ||||
| 2025-07-22 | 13F | CPR Investments Inc. | 3 420 | 211 | ||||||
| 2025-08-14 | 13F | Ambassador Advisors, LLC | 4 118 | 0,00 | 254 | −0,39 | ||||
| 2025-07-24 | 13F | Lmcg Investments, Llc | 37 591 | 12,97 | 2 318 | 12,91 | ||||
| 2025-08-07 | 13F | Kestra Private Wealth Services, Llc | 4 650 | −7,00 | 287 | −7,14 | ||||
| 2025-08-11 | 13F | Principal Securities, Inc. | 298 | −83,74 | 18 | −83,78 | ||||
| 2025-08-08 | 13F | Thoroughbred Financial Services, Llc | 3 285 | 0,00 | 0 | |||||
| 2025-08-29 | 13F | Total Investment Management Inc | 162 | 10 | ||||||
| 2025-07-10 | 13F | Marshall Financial Group LLC | 3 794 | −13,75 | 236 | −13,28 | ||||
| 2025-05-13 | 13F | Aptus Capital Advisors, LLC | 0 | −100,00 | 0 | |||||
| 2025-08-14 | 13F | Comerica Bank | 1 358 | 0,00 | 84 | 0,00 | ||||
| 2025-08-13 | 13F | Capital Analysts, Inc. | 21 997 | −1,34 | 1 | 0,00 | ||||
| 2025-08-14 | 13F | Money Concepts Capital Corp | 3 843 | 237 | ||||||
| 2025-08-13 | 13F | Congress Wealth Management LLC / DE / | 3 336 | 0,54 | 206 | 0,49 | ||||
| 2025-09-04 | 13F/A | Advisor Group Holdings, Inc. | 76 091 | −14,77 | 4 695 | −14,81 | ||||
| 2025-07-11 | 13F | SILVER OAK SECURITIES, Inc | 27 460 | −5,90 | 1 693 | −5,15 | ||||
| 2025-08-14 | 13F | Gen-Wealth Partners Inc | 1 833 | 0,00 | 113 | 0,00 | ||||
| 2025-06-24 | NP | TNWIX - 1290 Retirement 2050 Fund Class I | 3 374 | 0,00 | 203 | −3,35 | ||||
| 2025-07-25 | 13F | Atria Wealth Solutions, Inc. | 8 879 | 3,05 | 548 | 3,01 | ||||
| 2025-07-11 | 13F | Farther Finance Advisors, LLC | 338 | 9,39 | 21 | 5,26 | ||||
| 2025-04-29 | 13F | Bank of New York Mellon Corp | 0 | −100,00 | 0 | |||||
| 2025-07-10 | 13F | Sovran Advisors, LLC | 4 046 | 251 | ||||||
| 2025-07-15 | 13F | Well Done, LLC | 11 926 | −1,91 | 735 | −0,54 | ||||
| 2025-08-12 | 13F | J.w. Cole Advisors, Inc. | 9 403 | 152,36 | 580 | 152,84 | ||||
| 2025-08-29 | 13F | Evolution Wealth Management Inc. | 940 | 58 | ||||||
| 2025-07-25 | 13F | Commonwealth Financial Services, LLC | 6 525 | −0,91 | 402 | −0,99 | ||||
| 2025-07-24 | 13F | IFP Advisors, Inc | 470 | −11,82 | 29 | −12,50 | ||||
| 2025-08-08 | 13F | Financial Gravity Companies, Inc. | 0 | −100,00 | 0 | |||||
| 2025-08-14 | 13F | Avant Capital LLC | 8 248 | −10,47 | 509 | −10,56 | ||||
| 2025-08-13 | 13F | Jones Financial Companies Lllp | 112 625 | 24,93 | 6 934 | 25,68 | ||||
| 2025-06-24 | NP | TNIIX - 1290 Retirement 2020 Fund Class I | 593 | 0,00 | 36 | −2,78 | ||||
| 2025-07-15 | 13F | ACT Advisors, LLC. | 4 070 | −17,38 | 251 | −17,43 | ||||
| 2025-08-12 | 13F | Proequities, Inc. | 0 | 0 | ||||||
| 2025-07-10 | 13F | High Net Worth Advisory Group LLC | 4 450 | 0,00 | 274 | 0,00 | ||||
| 2025-08-08 | 13F | Avantax Advisory Services, Inc. | 10 902 | 14,84 | 672 | 14,87 | ||||
| 2025-05-15 | 13F | Old Mission Capital Llc | 0 | −100,00 | 0 | |||||
| 2025-08-14 | 13F | Jane Street Group, Llc | 10 835 | 668 | ||||||
| 2025-07-16 | 13F | Brown, Lisle/cummings, Inc. | 2 911 | 0,21 | 180 | 0,00 | ||||
| 2025-08-14 | 13F | Wells Fargo & Company/mn | 114 559 | 9,47 | 7 065 | 9,38 | ||||
| 2025-08-14 | 13F | Harvest Investment Services, LLC | 6 082 | 0,91 | 375 | 1,08 | ||||
| 2025-08-12 | 13F | Insigneo Advisory Services, Llc | 6 412 | 0,64 | 395 | 0,51 | ||||
| 2025-08-06 | 13F | Destiny Capital Corp/CO | 11 433 | −2,77 | 705 | −2,76 | ||||
| 2025-07-22 | 13F | Global Assets Advisory, LLC | 888 | 234 | ||||||
| 2025-06-24 | NP | TNLIX - 1290 Retirement 2035 Fund Class I | 1 286 | −1,53 | 77 | −3,75 | ||||
| 2025-08-08 | 13F | Pnc Financial Services Group, Inc. | 205 206 | −12,27 | 12 655 | −12,34 | ||||
| 2025-08-12 | 13F | Virtu Financial LLC | 8 373 | 1 | ||||||
| 2025-07-17 | 13F | Sound Income Strategies, LLC | 165 | −25,34 | 10 | −23,08 | ||||
| 2025-08-14 | 13F | Win Advisors, Inc | 14 934 | −1,20 | 921 | −1,29 | ||||
| 2025-07-22 | 13F | Rocky Mountain Advisers, Llc | 4 075 | 0,00 | 251 | 0,00 | ||||
| 2025-08-13 | 13F | Dana Investment Advisors, Inc. | 6 107 | 0,00 | 377 | 0,00 | ||||
| 2025-08-14 | 13F | Citadel Advisors Llc | 9 756 | 602 | ||||||
| 2025-08-08 | 13F | Comprehensive Financial Planning, Inc./PA | 460 | 0,88 | 28 | 0,00 | ||||
| 2025-08-05 | 13F | Tsfg, Llc | 150 | 0,00 | 0 | |||||
| 2025-08-12 | 13F | Bravias Capital Group, LLC | 3 318 | 205 | ||||||
| 2025-08-13 | 13F | Milestone Investment Advisors LLC | 318 | 0,00 | 20 | 0,00 | ||||
| 2025-08-12 | 13F | CIBC Private Wealth Group, LLC | 3 590 | 0,00 | 221 | 11,06 | ||||
| 2025-08-14 | 13F | Daiwa Securities Group Inc. | 7 800 | −3,70 | 0 | |||||
| 2025-08-11 | 13F | Citigroup Inc | 11 971 | −33,80 | 738 | −33,87 | ||||
| 2025-08-08 | 13F | Sculati Wealth Management, LLC | 46 068 | −67,64 | 2 841 | −67,66 | ||||
| 2025-08-12 | 13F | Jacobi Capital Management LLC | 6 957 | 0,56 | 429 | 0,70 | ||||
| 2025-07-21 | 13F | Monticello Wealth Management, Llc | 15 551 | −5,34 | 959 | −5,33 | ||||
| 2025-07-15 | 13F | LVZ Advisors, Inc. | 3 421 | 0,00 | 211 | −0,47 | ||||
| 2025-05-12 | 13F | Berger Financial Group, Inc | 0 | −100,00 | 0 | −100,00 | ||||
| 2025-07-18 | 13F | Trilogy Capital Inc. | 3 369 | 0,00 | 208 | 0,00 | ||||
| 2025-08-08 | 13F | Capital Investment Advisory Services, LLC | 316 | 0,00 | 20 | 0,00 | ||||
| 2025-08-27 | 13F/A | Brinker Capital Investments, LLC | 12 442 | −26,52 | 767 | −26,60 | ||||
| 2025-08-13 | 13F | Cerity Partners LLC | 0 | −100,00 | 0 | |||||
| 2025-06-24 | NP | TNJIX - 1290 Retirement 2025 Fund Class I | 75 | −12,79 | 5 | −20,00 | ||||
| 2025-06-24 | NP | TNKIX - 1290 Retirement 2030 Fund Class I | 1 016 | 0,00 | 61 | −3,23 | ||||
| 2025-08-14 | 13F | Visionary Wealth Advisors | 14 271 | −2,23 | 880 | −2,22 | ||||
| 2025-06-24 | NP | TNOIX - 1290 Retirement 2045 Fund Class I | 3 053 | 0,00 | 183 | −3,17 | ||||
| 2025-07-16 | 13F | Meridian Financial, LLC | 4 511 | 0,00 | 278 | 0,00 | ||||
| 2025-08-08 | 13F | Ogorek Anthony Joseph /ny/ /adv | 100 | 0,00 | 0 | |||||
| 2025-07-21 | 13F | DHJJ Financial Advisors, Ltd. | 515 | 32 | ||||||
| 2025-07-21 | 13F | Creative Capital Management Investments LLC | 589 | 0,00 | 36 | 0,00 | ||||
| 2025-08-12 | 13F | Calton & Associates, Inc. | 30 619 | 1 888 | ||||||
| 2025-08-15 | 13F | Equitable Holdings, Inc. | 46 004 | −25,01 | 2 837 | −25,07 | ||||
| 2025-08-11 | 13F | Private Advisor Group, LLC | 14 762 | 34,03 | 910 | 34,02 | ||||
| 2025-08-14 | 13F | UBS Group AG | 315 912 | 5,67 | 19 482 | 5,58 | ||||
| 2025-07-31 | 13F | Briaud Financial Planning, Inc | 23 | 0 | ||||||
| 2025-08-08 | 13F | Petix & Botte Co | 7 726 | 0,00 | 476 | 0,00 | ||||
| 2025-08-13 | 13F | Baird Financial Group, Inc. | 147 427 | 3,21 | 9 092 | 3,12 | ||||
| 2025-07-25 | 13F | Cwm, Llc | 8 417 | 134,26 | 1 | |||||
| 2025-07-29 | 13F | Signature Estate & Investment Advisors Llc | 36 785 | 2 269 | ||||||
| 2025-07-30 | 13F | Syntegra Private Wealth Group, LLC | 8 281 | 0,00 | 511 | −0,20 | ||||
| 2025-07-14 | 13F | IronOak Wealth LLC. | 0 | −100,00 | 0 | |||||
| 2025-05-12 | 13F | Independent Advisor Alliance | 0 | −100,00 | 0 | |||||
| 2025-08-04 | 13F | Arkadios Wealth Advisors | 19 262 | −2,38 | 1 188 | −2,47 | ||||
| 2025-07-07 | 13F | Nova Wealth Management, Inc. | 6 335 | 4 849,22 | 391 | 5 471,43 | ||||
| 2025-07-31 | 13F | City State Bank | 427 | 0,00 | 26 | 0,00 | ||||
| 2025-08-12 | 13F | Laurel Wealth Advisors LLC | 39 346 | 6 067,08 | 1 | −100,00 | ||||
| 2025-07-11 | 13F | Pinnacle Bancorp, Inc. | 4 200 | 0,00 | 259 | 0,00 | ||||
| 2025-08-08 | 13F | Creative Planning | 5 634 | 6,34 | 347 | 6,44 | ||||
| 2025-08-12 | 13F | Financial Advocates Investment Management | 12 978 | −10,61 | 800 | −10,71 | ||||
| 2025-07-16 | 13F | PFS Partners, LLC | 128 846 | 0,28 | 7 946 | 0,19 | ||||
| 2025-07-18 | 13F | Truist Financial Corp | 3 702 | −0,59 | 228 | −0,44 | ||||
| 2025-06-24 | NP | TNNIX - 1290 Retirement 2040 Fund Class I | 2 713 | 0,00 | 163 | −3,57 | ||||
| 2025-04-21 | 13F | PSI Advisors, LLC | 0 | −100,00 | 0 | |||||
| 2025-05-15 | 13F/A | Orion Portfolio Solutions, LLC | 16 932 | 30,34 | 1 045 | 32,28 | ||||
| 2025-08-06 | 13F | AE Wealth Management LLC | 622 | 18,70 | 38 | 18,75 | ||||
| 2025-08-14 | 13F | Harwood Advisory Group, LLC | 51 | −75,24 | 3 | −75,00 | ||||
| 2025-07-23 | 13F | Clear Creek Financial Management, LLC | 16 795 | −19,50 | 1 036 | −19,58 | ||||
| 2025-08-12 | 13F | Steward Partners Investment Advisory, Llc | 3 322 | −2,49 | 205 | −2,86 | ||||
| 2025-08-05 | 13F | EPG Wealth Management LLC | 0 | −100,00 | 0 | |||||
| 2025-08-14 | 13F | Goldman Sachs Group Inc | 9 456 | −67,70 | 583 | −67,74 | ||||
| 2025-05-15 | 13F | Integrated Wealth Concepts LLC | 0 | −100,00 | 0 | |||||
| 2025-08-11 | 13F | Synergy Investment Management, LLC | 0 | −100,00 | 0 | |||||
| 2025-04-15 | 13F | Chris Bulman Inc | 0 | −100,00 | 0 | |||||
| 2025-07-24 | 13F | Ronald Blue Trust, Inc. | 30 | 0,00 | 2 | 0,00 | ||||
| 2025-07-25 | 13F | Alpha Financial Partners, LLC | 0 | −100,00 | 0 | |||||
| 2025-07-25 | 13F | Hazlett, Burt & Watson, Inc. | 1 945 | −34,02 | 0 | |||||
| 2025-08-04 | 13F | Assetmark, Inc | 84 | −98,46 | 5 | −98,51 | ||||
| 2025-08-14 | 13F | Mml Investors Services, Llc | 53 289 | −2,59 | 3 | 0,00 | ||||
| 2025-08-11 | 13F | Rothschild Investment Llc | 2 000 | 0,00 | 123 | 0,00 | ||||
| 2025-08-14 | 13F | Raymond James Financial Inc | 193 541 | 9,94 | 11 936 | 9,85 | ||||
| 2025-07-22 | 13F | Accel Wealth Management | 6 198 | 4,94 | 382 | 4,95 | ||||
| 2025-08-06 | 13F | Commonwealth Equity Services, Llc | 217 510 | −15,55 | 13 | −13,33 | ||||
| 2025-07-10 | 13F | Wealth Enhancement Advisory Services, Llc | 11 712 | −18,18 | 734 | −16,99 | ||||
| 2025-07-30 | 13F | Pacific Sun Financial Corp | 21 200 | −0,38 | 1 307 | −0,46 | ||||
| 2025-08-14 | 13F | Fmr Llc | 7 294 | −9,30 | 450 | −9,48 | ||||
| 2025-08-12 | 13F | Global Retirement Partners, LLC | 864 | 234,88 | 53 | 253,33 | ||||
| 2025-08-14 | 13F | Aqr Capital Management Llc | 8 853 | 0,00 | 546 | −0,18 | ||||
| 2025-08-14 | 13F | Redwood Financial Network Corp | 3 273 | −5,30 | 202 | −5,63 | ||||
| 2025-07-23 | 13F | REAP Financial Group, LLC | 444 | 0,45 | 27 | 0,00 | ||||
| 2025-08-01 | 13F | Gwn Securities Inc. | 0 | −100,00 | 0 | |||||
| 2025-08-07 | 13F | Allworth Financial LP | 4 305 | 1,97 | 266 | 4,74 | ||||
| 2025-08-11 | 13F | CFS Investment Advisory Services, LLC | 4 595 | −2,03 | 0 | |||||
| 2025-08-14 | 13F | GWM Advisors LLC | 96 201 | 35,10 | 5 937 | 58,36 | ||||
| 2025-06-24 | NP | TNQIX - 1290 Retirement 2055 Fund Class I | 3 447 | 0,00 | 207 | −3,29 | ||||
| 2025-08-06 | 13F | Adviser Investments LLC | 0 | −100,00 | 0 | |||||
| 2025-07-18 | 13F | Provident Wealth Management, LLC | 2 | 0,00 | 0 | |||||
| 2025-07-31 | 13F | Cambridge Investment Research Advisors, Inc. | 535 542 | 18,17 | 33 | 22,22 | ||||
| 2025-08-05 | 13F | Sensible Money, LLC | 4 275 | 0,00 | 264 | 0,00 | ||||
| 2025-08-04 | 13F | Creative Financial Designs Inc /adv | 178 | 0,00 | 11 | 0,00 | ||||
| 2025-05-15 | 13F | Two Sigma Securities, Llc | 0 | −100,00 | 0 | |||||
| 2025-08-12 | 13F | Richmond Investment Services, LLC | 6 543 | 56,87 | 404 | 56,81 | ||||
| 2025-08-15 | 13F | Morgan Stanley | 597 901 | 1,36 | 36 873 | 1,27 | ||||
| 2025-07-29 | 13F | International Assets Investment Management, Llc | 4 382 | −6,25 | 270 | −6,25 | ||||
| 2025-07-17 | 13F | ERn Financial, LLC | 8 377 | 0,00 | 517 | −0,19 | ||||
| 2025-08-14 | 13F | Sunbelt Securities, Inc. | 23 | 0,00 | 1 | 0,00 | ||||
| 2025-07-30 | 13F | Liberty One Investment Management, Llc | 40 328 | −2,89 | 2 487 | −2,97 | ||||
| 2025-07-07 | 13F | Roxbury Financial LLC | 303 | 0,33 | 19 | 0,00 | ||||
| 2025-07-16 | 13F | Investment Partners Asset Management, Inc. | 16 553 | 2,76 | 1 021 | 2,62 | ||||
| 2025-08-11 | 13F | Wbi Investments, Inc. | 51 249 | −0,63 | 3 161 | −0,72 | ||||
| 2025-08-07 | 13F | Resources Investment Advisors, LLC. | 10 448 | −2,12 | 644 | −2,13 | ||||
| 2025-07-22 | 13F | Wealthcare Advisory Partners LLC | 8 037 | 64,52 | 496 | 64,45 | ||||
| 2025-08-14 | 13F | CoreCap Advisors, LLC | 76 | 0,00 | 5 | 0,00 | ||||
| 2025-08-14 | 13F | Snowden Capital Advisors LLC | 18 406 | 0,17 | 1 135 | 0,09 | ||||
| 2025-08-13 | 13F | Rsm Us Wealth Management Llc | 9 618 | 0,00 | 593 | 0,00 | ||||
| 2025-08-14 | 13F | Great Valley Advisor Group, Inc. | 6 593 | 0,66 | 407 | 0,74 | ||||
| 2025-08-13 | 13F | Avestar Capital, LLC | 15 176 | 25,48 | 936 | 25,34 | ||||
| 2025-07-17 | 13F | Johnson & White Wealth Management, LLC | 32 992 | 3,04 | 2 | 100,00 | ||||
| 2025-07-17 | 13F | Wagner Wealth Management, Llc | 25 | 4,17 | 2 | 0,00 | ||||
| 2025-08-13 | 13F | EverSource Wealth Advisors, LLC | 860 | 53 | ||||||
| 2025-08-14 | 13F | Qube Research & Technologies Ltd | 102 | 0,00 | 6 | 0,00 | ||||
| 2025-07-30 | 13F | Brookstone Capital Management | 322 262 | −6,19 | 19 874 | −6,26 | ||||
| 2025-07-15 | 13F | Sheets Smith Wealth Management | 12 331 | −7,50 | 760 | −7,54 | ||||
| 2025-08-06 | 13F | Atlas Legacy Advisors, LLC | 5 664 | −1,34 | 349 | −0,29 | ||||
| 2025-08-18 | 13F | Pacific Center for Financial Services | 4 379 | −3,01 | 270 | −2,88 | ||||
| 2025-07-30 | 13F | D.a. Davidson & Co. | 5 033 | −3,90 | 310 | −4,02 | ||||
| 2025-08-05 | 13F | Carolinas Wealth Consulting Llc | 0 | −100,00 | 0 | −100,00 | ||||
| 2025-08-12 | 13F | Marshall & Sterling Wealth Advisors Inc. | 695 | 0,87 | 43 | 0,00 | ||||
| 2025-08-14 | 13F | Hrt Financial Lp | 4 556 | 0 | ||||||
| 2025-08-14 | 13F | Stifel Financial Corp | 180 580 | 397,66 | 11 137 | 397,36 | ||||
| 2025-07-07 | 13F | Whitaker-Myers Wealth Managers, LTD. | 7 775 | 0,80 | 479 | 0,63 | ||||
| 2025-07-24 | 13F | Mainstay Capital Management Llc /adv | 0 | −100,00 | 0 | |||||
| 2025-08-05 | 13F | GPS Wealth Strategies Group, LLC | 393 | −63,61 | 24 | −63,64 | ||||
| 2025-07-16 | 13F | Moneywise, Inc. | 13 599 | −4,39 | 839 | −4,45 | ||||
| 2025-04-30 | 13F | Sofos Investments, Inc. | 0 | −100,00 | 0 | |||||
| 2025-07-16 | 13F/A | CX Institutional | 399 | 0,00 | 0 | |||||
| 2025-08-11 | 13F | FineMark National Bank & Trust | 21 003 | −5,69 | 1 295 | −5,75 | ||||
| 2025-08-13 | 13F | Russell Investments Group, Ltd. | 37 | 0,00 | 2 | 0,00 | ||||
| 2025-08-13 | 13F | Transce3nd, LLC | 1 373 | −4,98 | 85 | −5,62 | ||||
| 2025-08-08 | 13F | Larson Financial Group LLC | 228 | 0,44 | 14 | 7,69 | ||||
| 2025-08-14 | 13F | Mariner, LLC | 34 672 | −6,70 | 2 138 | −6,76 | ||||
| 2025-08-12 | 13F | LPL Financial LLC | 622 659 | 51,96 | 38 399 | 51,84 | ||||
| 2025-07-16 | 13F | Essex Financial Services, Inc. | 10 613 | 0,06 | 655 | 0,00 | ||||
| 2025-07-15 | 13F | Fifth Third Bancorp | 4 492 | 0,00 | 277 | 0,00 | ||||
| 2025-08-13 | 13F | Northwestern Mutual Wealth Management Co | 81 746 | 6,45 | 5 041 | 6,37 | ||||
| 2025-08-14 | 13F | Susquehanna International Group, Llp | 4 417 | −59,42 | 272 | −59,46 | ||||
| 2025-08-14 | 13F | Ameriprise Financial Inc | 225 465 | 1,26 | 13 903 | 1,13 | ||||
| 2025-08-11 | 13F | Inspire Advisors, LLC | 3 942 | 243 | ||||||
| 2025-07-07 | 13F | Thurston, Springer, Miller, Herd & Titak, Inc. | 658 | 0,61 | 41 | 0,00 | ||||
| 2025-08-11 | 13F | United Capital Financial Advisers, Llc | 15 323 | 0,00 | 945 | −0,11 | ||||
| 2025-08-15 | 13F | Kestra Advisory Services, LLC | 11 061 | 22,61 | 682 | 22,66 | ||||
| 2025-08-01 | 13F | Ashton Thomas Private Wealth, LLC | 6 714 | −8,49 | 414 | −8,41 | ||||
| 2025-07-28 | 13F | DORVAL Corp | 234 236 | 14 445 | ||||||
| 2025-04-16 | 13F | Ipswich Investment Management Co., Inc. | 0 | −100,00 | 0 | |||||
| 2025-08-08 | 13F | ProVise Management Group, LLC | 59 435 | −0,71 | 3 665 | −0,79 | ||||
| 2025-08-12 | 13F | Spectrum Wealth Advisory Group, LLC | 8 344 | 0,06 | 515 | 0,00 | ||||
| 2025-08-04 | 13F | Spire Wealth Management | 70 | 0,00 | 4 | 0,00 | ||||
| 2025-08-08 | 13F | Cetera Investment Advisers | 64 683 | 0,90 | 3 989 | 0,83 | ||||
| 2025-08-13 | 13F | Invesco Ltd. | 7 012 | 5,32 | 432 | 5,37 | ||||
| 2025-05-16 | 13F | Laidlaw Wealth Management LLC | 0 | −100,00 | 0 | |||||
| 2025-05-02 | 13F | Transcendent Capital Group LLC | 0 | −100,00 | 0 | |||||
| 2025-08-12 | 13F | SRS Capital Advisors, Inc. | 2 439 | 0,62 | 150 | 0,67 | ||||
| 2025-08-01 | 13F | Biltmore Family Office, LLC | 100 | −50,00 | 6 | −50,00 | ||||
| 2025-08-06 | 13F | Golden State Wealth Management, LLC | 22 078 | 0,35 | 1 362 | 0,29 | ||||
| 2025-08-15 | 13F | Tower Research Capital LLC (TRC) | 1 | 0,00 | 0 | |||||
| 2025-08-06 | 13F | North Capital, Inc. | 100 | 0,00 | 6 | 0,00 | ||||
| 2025-07-24 | 13F | Us Bancorp \de\ | 1 374 | 12,25 | 85 | 12,00 | ||||
| 2025-08-18 | 13F | Front Row Advisors LLC | 935 | 0,00 | 58 | 0,00 | ||||
| 2025-08-11 | 13F | HighTower Advisors, LLC | 43 690 | 5,04 | 2 694 | 4,95 | ||||
| 2025-08-18 | 13F | Geneos Wealth Management Inc. | 531 | −15,45 | 33 | −15,79 | ||||
| 2025-08-14 | 13F | Two Sigma Investments, Lp | 33 000 | −17,09 | 2 035 | −17,14 | ||||
| 2025-08-11 | 13F | Strategic Equity Management | 12 260 | 14,40 | 756 | 14,37 | ||||
| 2025-07-28 | 13F | Harbour Investments, Inc. | 33 061 | 1,12 | 2 039 | 0,99 | ||||
| 2025-08-12 | 13F | O'shaughnessy Asset Management, Llc | 60 | 0,00 | 4 | 0,00 | ||||
| 2025-08-01 | 13F | Envestnet Asset Management Inc | 310 516 | 2,26 | 19 150 | 2,18 | ||||
| 2025-08-14 | 13F | Obsidian Personal Planning Solutions LLC | 124 851 | 2,21 | 7 700 | 5,02 | ||||
| 2025-07-14 | 13F | U.S. Capital Wealth Advisors, LLC | 38 144 | 23,94 | 2 352 | 23,85 | ||||
| 2025-08-01 | 13F | Petra Financial Advisors Inc | 6 192 | 0,21 | 382 | 0,00 | ||||
| 2025-08-14 | 13F | Bank Of America Corp /de/ | 112 925 | 3,10 | 6 964 | 3,02 | ||||
| 2025-07-09 | 13F | Massmutual Trust Co Fsb/adv | 17 385 | 5,40 | 1 072 | 5,30 | ||||
| 2025-08-14 | 13F | Mercer Global Advisors Inc /adv | 128 227 | −3,73 | 7 908 | −3,82 | ||||
| 2025-08-12 | 13F | MAI Capital Management | 4 620 | 0,00 | 285 | −0,35 | ||||
| 2025-08-01 | 13F | MorganRosel Wealth Management, LLC | 97 900 | 655,46 | 6 037 | 655,57 | ||||
| 2025-08-14 | 13F | IHT Wealth Management, LLC | 3 587 | 0,11 | 221 | 0,00 | ||||
| 2025-07-24 | 13F | Capital Advisors, Ltd. LLC | 525 | 0,00 | 0 | |||||
| 2025-08-08 | 13F | Kingsview Wealth Management, LLC | 5 579 | −9,23 | 344 | −9,23 |