Grunnleggende statistikk
| Institusjonelle eiere | 211 total, 211 long only, 0 short only, 0 long/short - change of 3,92% MRQ |
| Gjennomsnittlig porteføljeallokering | 0.3484 % - change of −0,29% MRQ |
| Institusjonelle aksjer (Long) | 5 098 998 (ex 13D/G) - change of 0,40MM shares 8,41% MRQ |
| Institusjonell verdi (Long) | $ 1 273 948 USD ($1000) |
Institusjonelt eierskap og aksjonærer
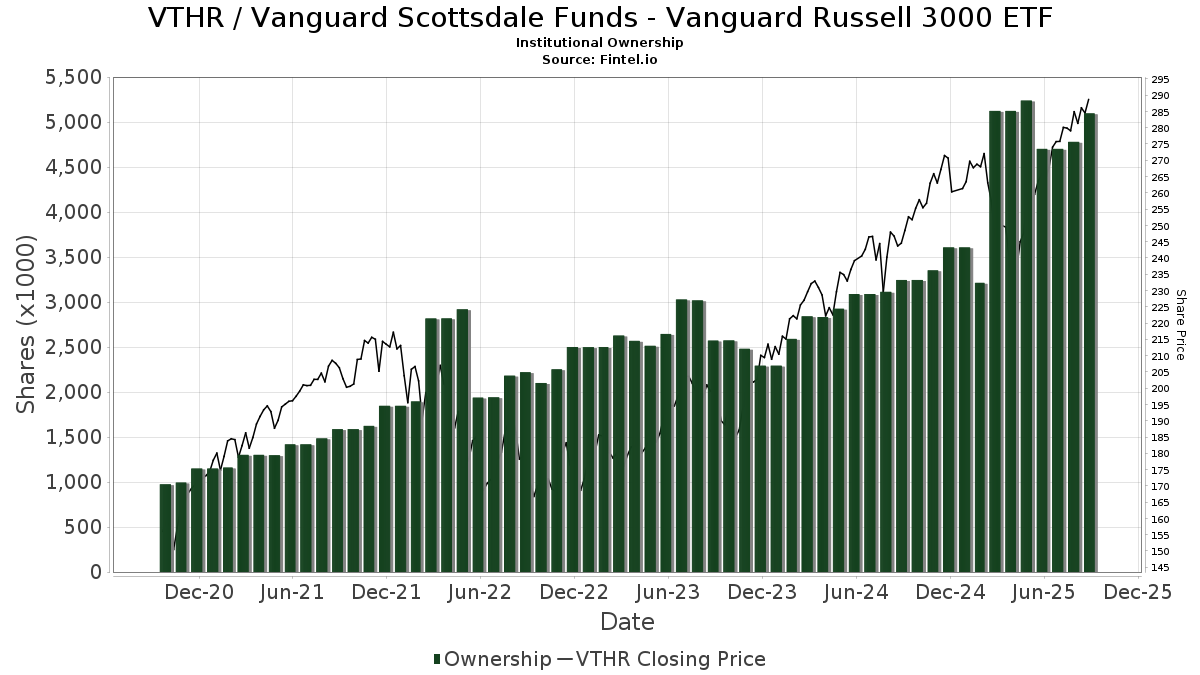
Vanguard Scottsdale Funds - Vanguard Russell 3000 ETF (US:VTHR) har 211 institusjonelle eiere og aksjonærer som har sendt inn 13D/G- eller 13F-skjemaer til Securities Exchange Commission (SEC). Disse institusjonene eier til sammen 5,098,998 aksjer. De største aksjonærene inkluderer Ameriprise Financial Inc, Lincoln National Corp, LINCOLN VARIABLE INSURANCE PRODUCTS TRUST - LVIP Vanguard Domestic Equity ETF Fund Standard Class, Cliffwater LLC, Morgan Stanley, Colony Group, LLC, Natixis Advisors, L.p., Tompkins Financial Corp, Cerity Partners LLC, and Fund Evaluation Group, LLC .
Vanguard Scottsdale Funds - Vanguard Russell 3000 ETF (NasdaqGM:VTHR) institusjonell eierstruktur viser nåværende posisjoner i selskapet fordelt på institusjoner og fond, samt de siste endringene i posisjonsstørrelse. De største aksjonærene kan være individuelle investorer, verdipapirfond, hedgefond eller institusjoner. Schedule 13D indikerer at investoren eier (eller har eid) mer enn 5 % av selskapet og har til hensikt (eller hadde til hensikt) å aktivt forfølge en endring i forretningsstrategien. Schedule 13G indikerer en passiv investering på over 5 %.
The share price as of September 10, 2025 is 288,62 / share. Previously, on September 10, 2024, the share price was 242,37 / share. This represents an increase of 19,08% over that period.
Fondssentiment-score
Fondssentiment Score (også kjent som akkumulering av eierskap poengsum) viser hvilke aksjer som er mest kjøpt av fond. Den er resultatet av en sofistikert, kvantitativ flerfaktormodell som identifiserer selskaper med de høyeste nivåene av institusjonell akkumulering. Beregningsmodellen for poeng bruker en kombinasjon av den totale økningen i antall offentliggjorte eiere, endringer i porteføljeallokeringen til disse eierne og andre beregninger. Tallet går fra 0 til 100, der høyere tall indikerer en høyere grad av akkumulering i forhold til sammenlignbare selskaper, der 50 er gjennomsnittet.
Oppdateringsfrekvens: Daglig
Sjekk ut Ownership Explorer, som inneholder en liste over de høyest rangerte selskapene.
Institusjonell Put/Call-forhold
I tillegg til å rapportere standard aksje- og gjeldsemisjoner må institusjoner med mer enn 100 millioner kroner i forvaltningskapital også oppgi beholdningen av put- og callopsjoner. Siden put-opsjoner generelt indikerer et negativt sentiment, og call-opsjoner indikerer et positivt sentiment, kan vi få et inntrykk av det generelle institusjonelle sentimentet ved å plotte forholdet mellom put- og call-opsjoner. Diagrammet til høyre viser det historiske forholdet mellom put- og call-opsjoner for dette instrumentet.
Ved å bruke Put/Call-forholdet som en indikator på investorsentimentet kan man overvinne en av de viktigste svakhetene ved å bruke totalt institusjonelt eierskap, nemlig at en betydelig andel av forvaltningskapitalen investeres passivt for å følge indekser. Passivt forvaltede fond kjøper vanligvis ikke opsjoner, slik at indikatoren for put/call-forhold i større grad gjenspeiler stemningen i aktivt forvaltede fond.

13F- og NPORT-arkiveringer
Detaljer om 13F-arkiveringer er gratis. Detaljer om NP-arkiveringer krever et premium-medlemskap. Grønne rader indikerer nye posisjoner. Røde rader indikerer lukkede posisjoner. Klikk på lenke ikonet for å se hele transaksjonshistorikken.
Oppgrader
for å låse opp premiedata og eksportere til Excel. ![]() .
.
| Fildato | Kilde | Investor | Type | Gjennomsnittlig pris (estimert) |
Aksjer | Δ Aksjer (%) |
Rapportert verdi ($1000) | Verdi (%) | Portallokering (%) | |
|---|---|---|---|---|---|---|---|---|---|---|
| 2025-07-31 | 13F | City State Bank | 50 | 0,00 | 14 | 8,33 | ||||
| 2025-08-08 | 13F | Firestone Capital Management | 1 000 | 0,00 | 273 | 10,57 | ||||
| 2025-08-13 | 13F | Quadrant Capital Group Llc | 0 | −100,00 | 0 | |||||
| 2025-08-01 | 13F | Chilton Capital Management Llc | 203 | 0,00 | 55 | 10,00 | ||||
| 2025-07-25 | 13F | NorthRock Partners, LLC | 41 | −73,55 | 11 | −71,05 | ||||
| 2025-08-11 | 13F | Wealthspire Advisors, LLC | 3 417 | 0,00 | 932 | 10,56 | ||||
| 2025-08-14 | 13F | Mariner, LLC | 74 648 | 214,84 | 20 360 | 248,03 | ||||
| 2025-08-15 | 13F | Kestra Advisory Services, LLC | 10 327 | 30,89 | 2 817 | 44,71 | ||||
| 2025-07-21 | 13F | Verus Financial Partners, Inc. | 8 358 | 1,31 | 2 305 | 18,09 | ||||
| 2025-08-08 | 13F | Pnc Financial Services Group, Inc. | 10 046 | −16,66 | 2 740 | −7,87 | ||||
| 2025-08-14 | 13F | Raymond James Financial Inc | 78 929 | −0,10 | 21 528 | 10,42 | ||||
| 2025-07-16 | 13F | Dakota Wealth Management | 903 | 0,00 | 246 | 10,81 | ||||
| 2025-08-14 | 13F | Glenmede Investment Management, LP | 21 100 | 5 755 | ||||||
| 2025-08-14 | 13F | Old Mission Capital Llc | 1 966 | 0,31 | 536 | 10,97 | ||||
| 2025-08-07 | 13F | Kestra Private Wealth Services, Llc | 883 | 241 | ||||||
| 2025-08-13 | 13F | Natixis Advisors, L.p. | 222 295 | 0,36 | 61 | 11,11 | ||||
| 2025-07-15 | 13F | Main Street Group, LTD | 0 | −100,00 | 0 | |||||
| 2025-08-11 | 13F | Lowe Brockenbrough & Co Inc | 36 664 | 10 000 | ||||||
| 2025-08-07 | 13F | Evoke Wealth, Llc | 10 182 | 2 777 | ||||||
| 2025-08-12 | 13F | SRS Capital Advisors, Inc. | 50 | 14 | ||||||
| 2025-08-28 | 13F/A | Tolleson Wealth Management, Inc. | 16 701 | 0,00 | 4 555 | 10,53 | ||||
| 2025-09-04 | 13F/A | Advisor Group Holdings, Inc. | 2 580 | −11,76 | 703 | −2,63 | ||||
| 2025-07-09 | 13F | Bowman & Co S.C. | 1 045 | 14,33 | 285 | 26,67 | ||||
| 2025-08-13 | 13F | Virtue Capital Management, LLC | 0 | −100,00 | 0 | |||||
| 2025-07-28 | 13F | Corundum Trust Company, INC | 1 892 | 0,00 | 516 | 10,73 | ||||
| 2025-08-07 | 13F | Tacita Capital Inc | 625 | 0,00 | 170 | 10,39 | ||||
| 2025-08-13 | 13F | Jones Financial Companies Lllp | 551 | 1 024,49 | 150 | 1 141,67 | ||||
| 2025-08-14 | 13F | GWM Advisors LLC | 3 377 | −14,01 | 921 | −4,95 | ||||
| 2025-07-24 | 13F | Lokken Investment Group LLC | 1 905 | 520 | ||||||
| 2025-07-22 | 13F | Evensky & Katz LLC | 44 464 | 429,40 | 12 | 500,00 | ||||
| 2025-07-07 | 13F | Global Wealth Strategies & Associates | 0 | −100,00 | 0 | |||||
| 2025-07-31 | 13F | Mycio Wealth Partners, Llc | 314 | 86 | ||||||
| 2025-08-14 | 13F | Wells Fargo & Company/mn | 17 779 | 46,32 | 4 849 | 61,74 | ||||
| 2025-08-04 | 13F | Linscomb & Williams, Inc. | 26 427 | −1,73 | 7 208 | 8,62 | ||||
| 2025-07-18 | 13F | Centricity Wealth Management, LLC | 287 | 0,00 | 78 | 11,43 | ||||
| 2025-08-15 | 13F | Koesten, Hirschmann & Crabtree, INC. | 452 | 0,22 | 123 | 10,81 | ||||
| 2025-08-12 | 13F | Steward Partners Investment Advisory, Llc | 14 447 | 0,38 | 3 940 | 10,95 | ||||
| 2025-07-29 | 13F | Stratos Wealth Advisors, LLC | 16 417 | 1,40 | 4 478 | 12,07 | ||||
| 2025-07-21 | 13F | Precedent Wealth Partners, Llc | 1 820 | 9,84 | 496 | 21,57 | ||||
| 2025-07-31 | 13F | Sage Mountain Advisors LLC | 420 | 0,00 | 115 | 10,68 | ||||
| 2025-07-09 | 13F | Radnor Capital Management, LLC | 1 100 | 0,00 | 0 | |||||
| 2025-08-07 | 13F | Allworth Financial LP | 586 | 0,34 | 160 | 12,77 | ||||
| 2025-08-07 | 13F | Fund Evaluation Group, LLC | 139 081 | 37 934 | ||||||
| 2025-07-30 | 13F | Arbor Investment Advisors, LLC | 1 787 | −11,80 | 487 | −2,40 | ||||
| 2025-08-05 | 13F | Lincoln National Corp | 466 325 | 1,42 | 127 190 | 12,10 | ||||
| 2025-08-14 | 13F | Gould Capital, LLC | 13 | 8,33 | 4 | 50,00 | ||||
| 2025-08-13 | 13F | Lido Advisors, LLC | 12 533 | 0,01 | 3 418 | 10,54 | ||||
| 2025-07-31 | 13F | Fiduciary Wealth Partners, LLC | 0 | −100,00 | 0 | −100,00 | ||||
| 2025-08-14 | 13F | Ieq Capital, Llc | 21 194 | −22,13 | 5 781 | −13,92 | ||||
| 2025-08-19 | 13F/A | Pitcairn Co | 23 421 | −18,27 | 6 388 | −9,66 | ||||
| 2025-07-25 | 13F | Johnson Investment Counsel Inc | 4 802 | 0,00 | 1 310 | 10,56 | ||||
| 2025-07-25 | 13F | Investment Advisory Group, LLC | 5 978 | −0,91 | 1 631 | 9,54 | ||||
| 2025-07-31 | 13F | Nilsine Partners, LLC | 1 498 | −5,96 | 409 | 3,82 | ||||
| 2025-08-11 | 13F | Diversified Portfolios, Inc. | 53 527 | 1,70 | 14 599 | 12,41 | ||||
| 2025-07-09 | 13F | Inspirion Wealth Advisors, Llc | 0 | −100,00 | 0 | |||||
| 2025-07-02 | 13F | Central Pacific Bank - Trust Division | 24 | 0,00 | 7 | 20,00 | ||||
| 2025-07-28 | 13F | Harbour Investments, Inc. | 0 | −100,00 | 0 | |||||
| 2025-08-05 | 13F | Bank Of Montreal /can/ | 136 | 0,00 | 37 | 12,12 | ||||
| 2025-08-14 | 13F | Atomi Financial Group, Inc. | 1 478 | 0,00 | 403 | 10,71 | ||||
| 2025-07-30 | 13F | Forum Financial Management, LP | 2 448 | 0,29 | 668 | 10,80 | ||||
| 2025-08-14 | 13F | Citadel Advisors Llc | 2 847 | −66,80 | 777 | −63,31 | ||||
| 2025-07-30 | 13F | Whittier Trust Co | 5 659 | 0,00 | 1 543 | 10,53 | ||||
| 2025-08-07 | 13F | Resources Investment Advisors, LLC. | 3 081 | −0,03 | 840 | 10,53 | ||||
| 2025-08-04 | 13F | Flagship Harbor Advisors, Llc | 5 648 | 7,07 | 1 541 | 18,37 | ||||
| 2025-08-12 | 13F | Howe & Rusling Inc | 281 | 0,00 | 77 | 10,14 | ||||
| 2025-08-18 | 13F | Geneos Wealth Management Inc. | 2 966 | 56,60 | 809 | 73,02 | ||||
| 2025-07-11 | 13F | Farther Finance Advisors, LLC | 2 406 | 74,22 | 656 | 91,81 | ||||
| 2025-07-10 | 13F | Wedmont Private Capital | 5 599 | −0,94 | 1 544 | 16,37 | ||||
| 2025-04-24 | 13F | Wingate Wealth Advisors, Inc. | 0 | −100,00 | 0 | |||||
| 2025-08-13 | 13F | Russell Investments Group, Ltd. | 1 691 | 461 | ||||||
| 2025-08-06 | NP | LINCOLN VARIABLE INSURANCE PRODUCTS TRUST - LVIP Vanguard Domestic Equity ETF Fund Standard Class | 466 325 | 1,42 | 127 190 | 12,10 | ||||
| 2025-07-31 | 13F | FSA Investment Group, LLC | 9 255 | 36,10 | 2 524 | 50,42 | ||||
| 2025-08-15 | 13F | Captrust Financial Advisors | 15 001 | 43,50 | 4 092 | 58,63 | ||||
| 2025-07-22 | 13F | Bay Harbor Wealth Management, LLC | 16 | 0,00 | 4 | 33,33 | ||||
| 2025-08-07 | 13F | BOK Financial Private Wealth, Inc. | 1 807 | 0,00 | 493 | 10,56 | ||||
| 2025-08-05 | 13F | Centennial Bank/AR/ | 4 946 | 210,29 | 1 349 | 243,26 | ||||
| 2025-07-09 | 13F | Christopher J. Hasenberg, Inc | 12 886 | −55,06 | 3 515 | −50,53 | ||||
| 2025-08-12 | 13F | O'shaughnessy Asset Management, Llc | 40 | 0,00 | 11 | 11,11 | ||||
| 2025-08-13 | 13F | Northwestern Mutual Wealth Management Co | 1 384 | 5,09 | 378 | 16,00 | ||||
| 2025-08-14 | 13F/A | Rockefeller Capital Management L.P. | 15 292 | 0,94 | 4 171 | 11,56 | ||||
| 2025-08-14 | 13F | EP Wealth Advisors, Inc. | 1 372 | −15,52 | 374 | −6,50 | ||||
| 2025-04-23 | 13F | Moran Wealth Management, LLC | 0 | −100,00 | 0 | |||||
| 2025-08-14 | 13F | Moneta Group Investment Advisors Llc | 1 616 | 0,00 | 441 | 10,55 | ||||
| 2025-08-19 | 13F | Asset Dedication, LLC | 208 | 0,00 | 57 | 9,80 | ||||
| 2025-07-15 | 13F | DB Fitzpatrick & Co, Inc | 14 210 | −2,70 | 3 876 | 7,55 | ||||
| 2025-08-12 | 13F/A | Cozad Asset Management Inc | 2 493 | 0,00 | 680 | 10,41 | ||||
| 2025-08-11 | 13F | Banque Cantonale Vaudoise | 1 794 | 0,00 | 0 | |||||
| 2025-08-13 | 13F | Cliffwater LLC | 235 936 | −9,98 | 64 352 | −0,50 | ||||
| 2025-08-13 | 13F | Cresset Asset Management, LLC | 4 027 | −8,58 | 1 099 | 1,10 | ||||
| 2025-07-17 | 13F | Coastline Trust Co | 12 240 | −2,67 | 3 338 | 7,57 | ||||
| 2025-08-06 | 13F | Wedbush Securities Inc | 9 546 | −1,99 | 3 | 0,00 | ||||
| 2025-08-14 | 13F | Tennessee Valley Asset Management Partners | 12 549 | 3,47 | 3 423 | 14,37 | ||||
| 2025-07-18 | 13F | BSW Wealth Partners | 771 | 210 | ||||||
| 2025-07-10 | 13F | Wealth Enhancement Advisory Services, Llc | 14 617 | 17,07 | 4 038 | 31,10 | ||||
| 2025-07-11 | 13F | Diversified Trust Co | 84 088 | 0,02 | 22 935 | 10,56 | ||||
| 2025-07-31 | 13F | Oppenheimer & Co Inc | 0 | −100,00 | 0 | |||||
| 2025-08-08 | 13F | Thoroughbred Financial Services, Llc | 0 | −100,00 | 0 | |||||
| 2025-08-14 | 13F | Goldman Sachs Group Inc | 64 547 | 19,84 | 17 605 | 32,47 | ||||
| 2025-07-08 | 13F | Nbc Securities, Inc. | 11 000 | −5,71 | 3 | 50,00 | ||||
| 2025-08-04 | 13F | Assetmark, Inc | 719 | −49,61 | 196 | −44,32 | ||||
| 2025-07-17 | 13F | Janney Montgomery Scott LLC | 901 | −30,59 | 0 | |||||
| 2025-07-30 | 13F | Strategic Blueprint, LLC | 0 | −100,00 | 0 | |||||
| 2025-07-07 | 13F | Wesbanco Bank Inc | 5 005 | 0,00 | 1 365 | 10,53 | ||||
| 2025-08-12 | 13F | Coldstream Capital Management Inc | 1 368 | 2,86 | 373 | 13,72 | ||||
| 2025-08-08 | 13F | Hartland & Co., LLC | 14 849 | 0,53 | 4 050 | 11,14 | ||||
| 2025-07-22 | 13F | Belpointe Asset Management LLC | 1 132 | 0,00 | 309 | 10,39 | ||||
| 2025-08-06 | 13F | Commonwealth Equity Services, Llc | 16 033 | −0,71 | 4 | 33,33 | ||||
| 2025-07-24 | 13F | IFP Advisors, Inc | 2 887 | −0,62 | 787 | 9,92 | ||||
| 2025-07-11 | 13F | Orrstown Financial Services Inc | 8 373 | −2,71 | 2 284 | 7,54 | ||||
| 2025-08-01 | 13F | Envestnet Asset Management Inc | 31 081 | −28,87 | 8 477 | −21,38 | ||||
| 2025-08-12 | 13F | Pathstone Holdings, LLC | 24 501 | 26,74 | 6 683 | 40,08 | ||||
| 2025-05-06 | 13F | Venturi Wealth Management, LLC | 0 | −100,00 | 0 | |||||
| 2025-08-04 | 13F | JDM Financial Group LLC | 59 | 0,00 | 16 | 14,29 | ||||
| 2025-05-08 | 13F | Armis Advisers, LLC | 0 | −100,00 | 0 | |||||
| 2025-07-31 | 13F | Brighton Jones Llc | 1 190 | 0,25 | 325 | 10,96 | ||||
| 2025-07-25 | 13F | Sequoia Financial Advisors, LLC | 3 309 | 33,54 | 903 | 47,63 | ||||
| 2025-08-05 | 13F | GPS Wealth Strategies Group, LLC | 24 | 0,00 | 7 | 0,00 | ||||
| 2025-07-31 | 13F | Topsail Wealth Management, LLC | 101 | 0,00 | 28 | 12,50 | ||||
| 2025-08-06 | 13F | Prospera Financial Services Inc | 1 500 | −57,14 | 409 | −52,61 | ||||
| 2025-08-14 | 13F | Royal Bank Of Canada | 12 129 | 7,00 | 3 308 | 18,23 | ||||
| 2025-08-14 | 13F | Mml Investors Services, Llc | 64 523 | −60,37 | 18 | −57,50 | ||||
| 2025-05-14 | 13F | Retirement Capital Strategies | 0 | −100,00 | 0 | |||||
| 2025-07-10 | 13F | NorthCrest Asset Manangement, LLC | 5 590 | 0,00 | 1 544 | 11,97 | ||||
| 2025-08-07 | 13F | CENTRAL TRUST Co | 32 | 0,00 | 9 | 14,29 | ||||
| 2025-08-08 | 13F | SBI Securities Co., Ltd. | 165 | 1,23 | 45 | 12,50 | ||||
| 2025-08-14 | 13F | Warren Averett Asset Management, LLC | 8 925 | 0,00 | 2 434 | 10,54 | ||||
| 2025-07-21 | 13F | Monticello Wealth Management, Llc | 9 411 | 0,00 | 2 567 | 10,51 | ||||
| 2025-04-17 | 13F | Qrg Capital Management, Inc. | 0 | −100,00 | 0 | |||||
| 2025-05-14 | 13F | Huntington National Bank | 116 | −4,96 | ||||||
| 2025-08-14 | 13F | Aqr Capital Management Llc | 63 374 | 81,39 | 17 285 | 100,50 | ||||
| 2025-08-05 | 13F | Bank of New York Mellon Corp | 29 293 | 7 990 | ||||||
| 2025-08-14 | 13F | Silvercrest Asset Management Group Llc | 4 034 | 0,30 | 1 100 | 10,89 | ||||
| 2025-05-15 | 13F | Glenmede Trust Co Na | 21 100 | 0,00 | 5 207 | −5,00 | ||||
| 2025-08-14 | 13F | Graney & King, LLC | 102 | 0,00 | 28 | 8,00 | ||||
| 2025-08-14 | 13F | Bank Of America Corp /de/ | 97 699 | −1,64 | 26 648 | 8,71 | ||||
| 2025-07-07 | 13F | Bangor Savings Bank | 0 | −100,00 | 0 | |||||
| 2025-07-16 | 13F | Embree Financial Group | 9 870 | −0,17 | 2 692 | 10,37 | ||||
| 2025-07-31 | 13F | CNB Bank | 3 189 | −11,54 | 870 | −2,25 | ||||
| 2025-07-25 | 13F | Atria Wealth Solutions, Inc. | 1 636 | −4,05 | 449 | 6,90 | ||||
| 2025-08-13 | 13F | Marshall Wace, Llp | 988 | 269 | ||||||
| 2025-08-14 | 13F | Gotham Asset Management, LLC | 41 208 | 30,62 | 11 239 | 44,37 | ||||
| 2025-08-14 | 13F | Great Valley Advisor Group, Inc. | 4 803 | 0,00 | 1 310 | 10,55 | ||||
| 2025-07-22 | 13F | Wealthcare Advisory Partners LLC | 1 763 | 0,00 | 481 | 10,60 | ||||
| 2025-08-13 | 13F | American Investment Services, Inc. | 0 | −100,00 | 0 | |||||
| 2025-08-12 | 13F | Proequities, Inc. | 0 | 0 | ||||||
| 2025-08-13 | 13F | BCJ Capital Management, LLC | 930 | 0,00 | 254 | 10,48 | ||||
| 2025-07-22 | 13F | Compass Financial Group, INC/SD | 4 665 | 0,00 | 1 272 | 10,51 | ||||
| 2025-07-18 | 13F | Cooper Financial Group | 1 470 | 401 | ||||||
| 2025-08-14 | 13F | Principal Street Partners, LLC | 5 248 | 100,00 | 1 431 | 121,17 | ||||
| 2025-08-11 | 13F | HighTower Advisors, LLC | 93 624 | −1,99 | 25 536 | 8,33 | ||||
| 2025-08-12 | 13F | New Republic Capital, LLC | 1 063 | 290 | ||||||
| 2025-08-14 | 13F | Jane Street Group, Llc | 3 800 | 44,10 | 1 036 | 59,38 | ||||
| 2025-08-12 | 13F | Jpmorgan Chase & Co | 40 506 | −2,51 | 11 048 | 7,76 | ||||
| 2025-08-14 | 13F | Susquehanna International Group, Llp | 75 540 | 105,11 | 20 604 | 126,73 | ||||
| 2025-07-30 | 13F | Brookstone Capital Management | 1 405 | 0,00 | 383 | 10,69 | ||||
| 2025-08-14 | 13F | Ameriprise Financial Inc | 525 460 | 1,47 | 143 561 | 12,46 | ||||
| 2025-08-08 | 13F | Emerald Investment Partners, Llc | 10 | 0,00 | 3 | 0,00 | ||||
| 2025-08-08 | 13F | Jacksonville Wealth Management, LLC | 2 990 | −1,52 | 816 | 8,81 | ||||
| 2025-03-12 | 13F/A | Private Capital Management Llc | 272 | 65 | ||||||
| 2025-07-02 | 13F | First Financial Bank - Trust Division | 3 788 | 1,23 | 1 033 | 11,92 | ||||
| 2025-08-14 | 13F | Mercer Global Advisors Inc /adv | 2 453 | 79,18 | 669 | 98,52 | ||||
| 2025-08-08 | 13F | Capital Investment Advisory Services, LLC | 618 | 0,00 | 168 | 10,53 | ||||
| 2025-08-14 | 13F | Operose Advisors LLC | 5 166 | 0,19 | 1 409 | 10,69 | ||||
| 2025-08-04 | 13F | Pensionmark Financial Group, Llc | 4 250 | −0,86 | 1 159 | 9,65 | ||||
| 2025-08-11 | 13F | Aptus Capital Advisors, LLC | 30 | 0,00 | 8 | 14,29 | ||||
| 2025-08-12 | 13F | MAI Capital Management | 3 505 | −0,79 | 956 | 9,64 | ||||
| 2025-08-29 | 13F | Evolution Wealth Management Inc. | 5 802 | 1 582 | ||||||
| 2025-08-08 | 13F | Cetera Investment Advisers | 18 502 | 2,83 | 5 046 | 13,65 | ||||
| 2025-07-28 | 13F | BRYN MAWR TRUST Co | 2 110 | 0,00 | 576 | 10,58 | ||||
| 2025-08-07 | 13F | Everhart Financial Group, Inc. | 3 148 | 37,11 | 859 | 51,59 | ||||
| 2025-08-14 | 13F | Capital Planning Advisors, LLC | 1 891 | 0,00 | 516 | 10,52 | ||||
| 2025-08-13 | 13F | Cerity Partners LLC | 140 611 | 4,93 | 38 352 | 15,98 | ||||
| 2025-08-08 | 13F | Avantax Advisory Services, Inc. | 6 049 | 2,44 | 1 650 | 13,18 | ||||
| 2025-08-08 | 13F | Family Firm, Inc. | 41 713 | 3,59 | 11 377 | 14,50 | ||||
| 2025-08-14 | 13F | NCP Inc. | 0 | −100,00 | 0 | |||||
| 2025-07-01 | 13F | Harbor Investment Advisory, Llc | 41 | 0,00 | 11 | 10,00 | ||||
| 2025-08-06 | 13F | AE Wealth Management LLC | 26 | 13,04 | 7 | 40,00 | ||||
| 2025-08-14 | 13F | Colony Group, LLC | 224 686 | 0,94 | 61 283 | 11,58 | ||||
| 2025-07-18 | 13F | PBMares Wealth Management LLC | 7 710 | −21,99 | 2 103 | −13,78 | ||||
| 2025-07-28 | 13F | Davidson Investment Advisors | 2 424 | 661 | ||||||
| 2025-08-13 | 13F | EverSource Wealth Advisors, LLC | 1 | 0,00 | 0 | |||||
| 2025-05-07 | 13F | Evermay Wealth Management Llc | 0 | −100,00 | 0 | |||||
| 2025-08-12 | 13F | Fairscale Capital, LLC | 2 655 | 0,00 | 740 | 12,82 | ||||
| 2025-08-13 | 13F | Grove Street Fiduciary, LLC | 1 992 | 0,00 | 543 | 10,59 | ||||
| 2025-07-11 | 13F | Adirondack Trust Co | 24 674 | 20,33 | 6 730 | 33,01 | ||||
| 2025-08-11 | 13F | Sykon Capital Llc | 920 | 0,00 | 251 | 10,13 | ||||
| 2025-07-29 | 13F | International Assets Investment Management, Llc | 0 | −100,00 | 0 | |||||
| 2025-08-08 | 13F | Red Cedar Investment Management, Llc | 14 523 | −9,13 | 3 961 | 0,46 | ||||
| 2025-08-14 | 13F | Fmr Llc | 3 873 | −22,74 | 1 056 | −14,63 | ||||
| 2025-08-13 | 13F | Momentous Wealth Management, Inc. | 943 | 0,00 | 257 | 10,78 | ||||
| 2025-07-10 | 13F | Tompkins Financial Corp | 220 065 | 22,58 | 60 023 | 35,49 | ||||
| 2025-07-22 | 13F | Olistico Wealth, LLC | 6 | 2 | ||||||
| 2025-08-08 | 13F | Creative Planning | 3 967 | 4,86 | 1 082 | 15,86 | ||||
| 2025-08-12 | 13F | Jacobi Capital Management LLC | 1 324 | 0,00 | 361 | 10,74 | ||||
| 2025-08-14 | 13F | Qube Research & Technologies Ltd | 188 | −47,63 | 51 | −42,05 | ||||
| 2025-08-14 | 13F | Pennington Partners & Co., Llc | 46 295 | 7,41 | 12 627 | 18,72 | ||||
| 2025-08-12 | 13F | AlphaCore Capital LLC | 29 711 | 6,76 | 8 104 | 18,00 | ||||
| 2025-08-14 | 13F | Comerica Bank | 14 | −99,34 | 4 | −99,43 | ||||
| 2025-08-12 | 13F | Global Retirement Partners, LLC | 344 | 421,21 | 94 | 447,06 | ||||
| 2025-08-15 | 13F | Morgan Stanley | 224 848 | 2,70 | 61 328 | 13,52 | ||||
| 2025-08-12 | 13F | Coston, McIsaac & Partners | 0 | −100,00 | 0 | |||||
| 2025-07-11 | 13F | AA Financial Advisors, LLC | 1 026 | −0,10 | 280 | 10,28 | ||||
| 2025-08-08 | 13F | Smithfield Trust Co | 340 | 0,00 | 0 | |||||
| 2025-08-14 | 13F | Synovus Financial Corp | 897 | 245 | ||||||
| 2025-07-24 | 13F | Us Bancorp \de\ | 2 681 | 0,00 | 731 | 10,59 | ||||
| 2025-08-13 | 13F | Baker Avenue Asset Management, LP | 1 517 | −45,92 | 414 | −40,32 | ||||
| 2025-08-14 | 13F | CoreCap Advisors, LLC | 0 | −100,00 | 0 | |||||
| 2025-08-13 | 13F | Keystone Financial Group | 2 615 | 0,00 | 713 | 10,54 | ||||
| 2025-08-12 | 13F | LPL Financial LLC | 85 680 | −8,04 | 23 369 | 1,65 | ||||
| 2025-07-31 | 13F | Cambridge Investment Research Advisors, Inc. | 16 341 | 3,35 | 4 | 33,33 | ||||
| 2025-07-10 | 13F | ARS Wealth Advisors Group, LLC | 1 834 | 0,00 | 500 | 10,62 | ||||
| 2025-07-28 | 13F | Private Wealth Asset Management, LLC | 4 400 | 1 200 | ||||||
| 2025-08-14 | 13F | Hrt Financial Lp | 8 737 | 2 | ||||||
| 2025-08-18 | 13F | N.E.W. Advisory Services LLC | 0 | −100,00 | 0 | |||||
| 2025-07-29 | 13F | Activest Wealth Management | 155 | 0,00 | 42 | 10,53 | ||||
| 2025-07-23 | 13F | Hardy Reed LLC | 8 048 | 0,00 | 2 195 | 10,58 | ||||
| 2025-07-09 | 13F | Pallas Capital Advisors LLC | 15 055 | 4 106 | ||||||
| 2025-08-15 | 13F | Tower Research Capital LLC (TRC) | 5 248 | 439,92 | 1 431 | 498,74 | ||||
| 2025-08-14 | 13F | Hirtle Callaghan & Co LLC | 2 500 | −16,67 | 682 | −7,97 | ||||
| 2025-08-07 | 13F | Commerce Bank | 37 517 | −6,38 | 10 233 | 3,48 | ||||
| 2025-06-03 | 13F/A | First National Bank Of Omaha | 1 274 | −39,01 | 314 | −29,28 | ||||
| 2025-04-30 | 13F | Brown Advisory Inc | 0 | −100,00 | 0 | −100,00 | ||||
| 2025-07-08 | 13F | Apella Capital, LLC | 4 269 | 1 170 | ||||||
| 2025-08-11 | 13F | Private Advisor Group, LLC | 32 686 | −14,42 | 8 915 | −5,40 | ||||
| 2025-07-24 | 13F | Jfs Wealth Advisors, Llc | 581 | 0,35 | 158 | 11,27 | ||||
| 2025-07-22 | 13F | Silvia Mccoll Wealth Management, Llc | 2 463 | 0,00 | 672 | 10,54 | ||||
| 2025-08-14 | 13F | Stifel Financial Corp | 19 198 | 31,33 | 5 236 | 45,16 | ||||
| 2025-08-04 | 13F | Silver Coast Investments LLC | 6 052 | 3,36 | 1 651 | 14,27 | ||||
| 2025-08-13 | 13F | Flow Traders U.s. Llc | 2 700 | 1 | ||||||
| 2025-08-14 | 13F | UBS Group AG | 60 887 | 32,10 | 16 607 | 46,01 | ||||
| 2025-07-09 | 13F | Sunpointe, LLC | 1 495 | 408 | ||||||
| 2025-07-24 | 13F | Blair William & Co/il | 386 | 26,56 | 105 | 40,00 | ||||
| 2025-05-02 | 13F | Wealthfront Advisers Llc | 0 | −100,00 | 0 | −100,00 | ||||
| 2025-04-28 | 13F | Strategic Financial Concepts, LLC | 0 | −100,00 | 0 | −100,00 | ||||
| 2025-08-06 | 13F | Paulson Wealth Management Inc. | 1 900 | −0,11 | 518 | 10,45 | ||||
| 2025-07-25 | 13F | Cwm, Llc | 26 918 | 0,96 | 7 | 16,67 | ||||
| 2025-08-14 | 13F | Kovitz Investment Group Partners, LLC | 866 | 0,00 | 236 | 10,80 | ||||
| 2025-07-29 | 13F | Wealthstream Advisors, Inc. | 32 874 | −2,84 | 8 966 | 7,39 | ||||
| 2025-08-11 | 13F | Nations Financial Group Inc, /ia/ /adv | 11 653 | −0,07 | 3 178 | 10,46 | ||||
| 2025-07-30 | 13F | Sonata Capital Group Inc | 850 | 0,00 | 0 |