Grunnleggende statistikk
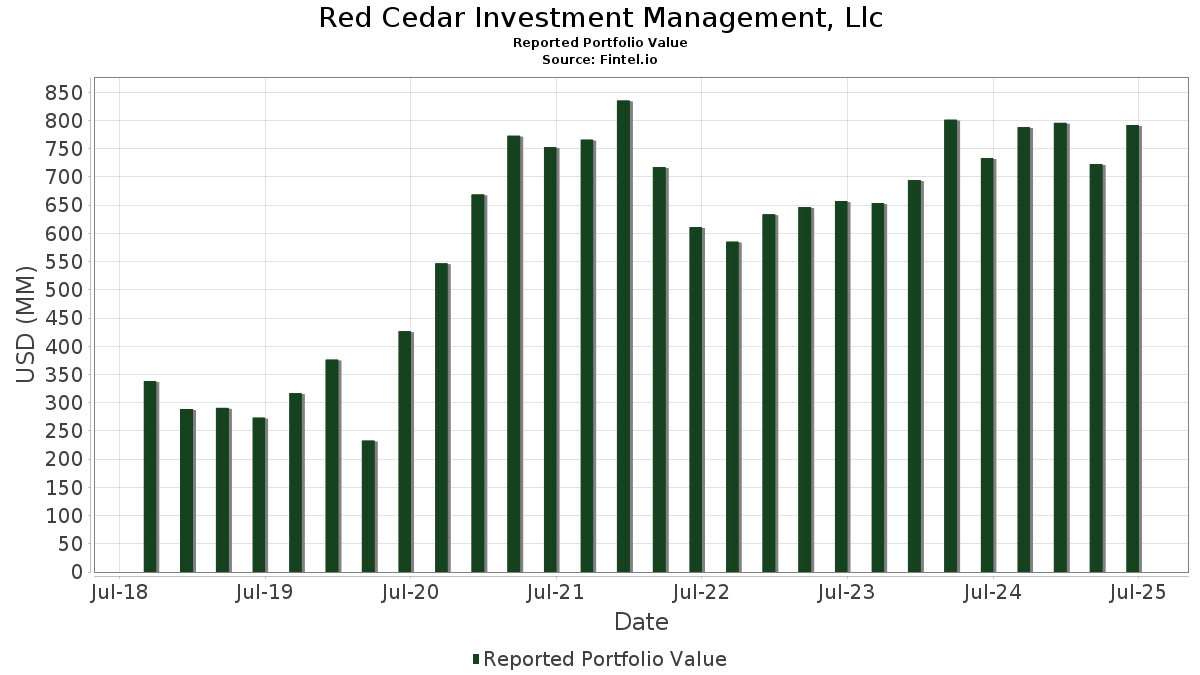
| Porteføljeverdi | $ 792 099 304 |
| Nåværende posisjoner | 81 |
Siste beholdninger, prestasjoner, forvaltet kapital (fra 13F, 13D)
Red Cedar Investment Management, Llc har oppgitt 81 totale beholdninger i sine siste SEC-arkiveringer. Siste porteføljeverdi er beregnet til 792 099 304 USD. Faktisk forvaltet kapital (AUM) er denne verdien pluss kontanter (som ikke er oppgitt). Red Cedar Investment Management, Llcs største beholdninger er Vanguard Scottsdale Funds - Vanguard Russell 1000 ETF (US:VONE) , iShares Trust - iShares Russell 1000 ETF (US:IWB) , iShares Trust - iShares Core S&P Mid-Cap ETF (US:IJH) , iShares, Inc. - iShares Core MSCI Emerging Markets ETF (US:IEMG) , and iShares, Inc. - iShares MSCI Japan ETF (US:EWJ) . Red Cedar Investment Management, Llcs nye posisjoner inkluderer iShares Trust - iShares Core S&P Mid-Cap ETF (US:IJH) , SPDR Gold Trust (US:GLD) , Vanguard Index Funds - Vanguard Mid-Cap ETF (US:VO) , .
De største økningene dette kvartalet
Vi bruker endringen i porteføljeallokeringen fordi dette er det mest meningsfulle målet. Endringer kan skyldes handler eller endringer i aksjekursene.
| Verdipapirer | Aksjer (MM) |
Verdi (MM$) |
Portefølje % | ΔPortefølje % |
|---|---|---|---|---|
| 0,82 | 51,03 | 6,4429 | 6,4429 | |
| 0,21 | 20,38 | 2,5735 | 2,0145 | |
| 0,05 | 14,04 | 1,7724 | 1,7724 | |
| 0,01 | 5,39 | 0,6804 | 0,6804 | |
| 0,05 | 14,68 | 1,8530 | 0,5425 | |
| 0,01 | 3,06 | 0,3868 | 0,3868 | |
| 0,10 | 5,50 | 0,6948 | 0,2583 | |
| 0,02 | 11,75 | 1,4836 | 0,2566 | |
| 0,27 | 4,22 | 0,5326 | 0,1369 | |
| 0,02 | 3,47 | 0,4380 | 0,1264 |
De største reduksjonene dette kvartalet
Vi bruker endringen i porteføljeallokeringen fordi dette er det mest meningsfulle målet. Endringer kan skyldes handler eller endringer i aksjekurser.
| Verdipapirer | Aksjer (MM) |
Verdi (MM$) |
Portefølje % | ΔPortefølje % |
|---|---|---|---|---|
| 0,12 | 10,75 | 1,3577 | −4,4842 | |
| 0,05 | 10,65 | 1,3449 | −4,4206 | |
| 0,56 | 157,56 | 19,8918 | −0,7603 | |
| 0,43 | 147,42 | 18,6118 | −0,6479 | |
| 0,45 | 13,60 | 1,7173 | −0,3442 | |
| 0,66 | 16,04 | 2,0255 | −0,1832 | |
| 0,01 | 8,06 | 1,0170 | −0,1638 | |
| 0,03 | 5,05 | 0,6376 | −0,1511 | |
| 0,02 | 6,63 | 0,8374 | −0,1181 | |
| 0,01 | 2,99 | 0,3769 | −0,0912 |
13F- og Fondsarkiveringer
Dette skjemaet ble sendt inn den 2025-08-08 for rapporteringsperioden 2025-06-30. Klikk på lenkeikonet for å se hele transaksjonshistorikken.
Oppgradere for å låse opp premiedata og eksportere til Excel![]() .
.
| Verdipapirer | Type | Gjennomsnittlig aksjekurs | Aksjer (MM) |
ΔAksjer (%) |
ΔAksjer (%) |
Verdi ($MM) |
Portefølje (%) |
ΔPortefølje (%) |
|
|---|---|---|---|---|---|---|---|---|---|
| VONE / Vanguard Scottsdale Funds - Vanguard Russell 1000 ETF | 0,56 | −4,60 | 157,56 | 5,55 | 19,8918 | −0,7603 | |||
| IWB / iShares Trust - iShares Russell 1000 ETF | 0,43 | −4,34 | 147,42 | 5,90 | 18,6118 | −0,6479 | |||
| IJH / iShares Trust - iShares Core S&P Mid-Cap ETF | 0,82 | 51,03 | 6,4429 | 6,4429 | |||||
| IEMG / iShares, Inc. - iShares Core MSCI Emerging Markets ETF | 0,57 | 0,84 | 34,32 | 12,17 | 4,3327 | 0,0997 | |||
| EWJ / iShares, Inc. - iShares MSCI Japan ETF | 0,40 | 0,08 | 30,21 | 9,44 | 3,8133 | −0,0051 | |||
| SCHF / Schwab Strategic Trust - Schwab International Equity ETF | 1,09 | 0,65 | 24,11 | 12,46 | 3,0432 | 0,0777 | |||
| EFA / iShares Trust - iShares MSCI EAFE ETF | 0,26 | 0,56 | 22,86 | 9,99 | 2,8855 | 0,0104 | |||
| AGG / iShares Trust - iShares Core U.S. Aggregate Bond ETF | 0,21 | 403,07 | 20,38 | 404,55 | 2,5735 | 2,0145 | |||
| GDX / VanEck ETF Trust - VanEck Gold Miners ETF | 0,32 | 0,00 | 16,52 | 13,24 | 2,0855 | 0,0674 | |||
| SCHX / Schwab Strategic Trust - Schwab U.S. Large-Cap ETF | 0,66 | −9,21 | 16,04 | 0,49 | 2,0255 | −0,1832 | |||
| AVGO / Broadcom Inc. | 0,05 | −5,88 | 14,68 | 54,95 | 1,8530 | 0,5425 | |||
| GLD / SPDR Gold Trust | 0,05 | 14,04 | 1,7724 | 1,7724 | |||||
| SPSB / SPDR Series Trust - SPDR Portfolio Short Term Corporate Bond ETF | 0,45 | −8,98 | 13,60 | −8,71 | 1,7173 | −0,3442 | |||
| MSFT / Microsoft Corporation | 0,02 | 0,00 | 11,75 | 32,51 | 1,4836 | 0,2566 | |||
| VTWO / Vanguard Scottsdale Funds - Vanguard Russell 2000 ETF | 0,12 | −76,45 | 10,75 | −74,53 | 1,3577 | −4,4842 | |||
| IWM / iShares Trust - iShares Russell 2000 ETF | 0,05 | −76,37 | 10,65 | −74,44 | 1,3449 | −4,4206 | |||
| VOO / Vanguard Index Funds - Vanguard S&P 500 ETF | 0,01 | −5,42 | 8,21 | 4,55 | 1,0365 | −0,0500 | |||
| JPM / JPMorgan Chase & Co. | 0,03 | 0,00 | 8,20 | 18,19 | 1,0354 | 0,0753 | |||
| LLY / Eli Lilly and Company | 0,01 | 0,00 | 8,06 | −5,61 | 1,0170 | −0,1638 | |||
| ETN / Eaton Corporation plc | 0,02 | −10,06 | 7,16 | 18,12 | 0,9044 | 0,0653 | |||
| MSI / Motorola Solutions, Inc. | 0,02 | 0,00 | 6,63 | −3,97 | 0,8374 | −0,1181 | |||
| PH / Parker-Hannifin Corporation | 0,01 | 0,00 | 6,46 | 14,91 | 0,8154 | 0,0378 | |||
| META / Meta Platforms, Inc. | 0,01 | 0,00 | 6,13 | 28,05 | 0,7735 | 0,1116 | |||
| AMP / Ameriprise Financial, Inc. | 0,01 | 0,00 | 5,62 | 10,25 | 0,7090 | 0,0043 | |||
| GLW / Corning Incorporated | 0,10 | 51,83 | 5,50 | 74,42 | 0,6948 | 0,2583 | |||
| SPY / SPDR S&P 500 ETF | 0,01 | 5,39 | 0,6804 | 0,6804 | |||||
| QTPI / Exchange Place Advisors Trust - North Square RCIM Tax-Advantaged Preferred and Income Securities ETF | 0,20 | 0,00 | 5,06 | 1,14 | 0,6390 | −0,0533 | |||
| ABBV / AbbVie Inc. | 0,03 | 0,00 | 5,05 | −11,42 | 0,6376 | −0,1511 | |||
| COST / Costco Wholesale Corporation | 0,00 | 0,00 | 4,39 | 4,68 | 0,5538 | −0,0260 | |||
| HD / The Home Depot, Inc. | 0,01 | 0,00 | 4,26 | 0,05 | 0,5374 | −0,0513 | |||
| KGC / Kinross Gold Corporation | 0,27 | 19,01 | 4,22 | 47,48 | 0,5326 | 0,1369 | |||
| MCD / McDonald's Corporation | 0,01 | 0,00 | 4,15 | −6,47 | 0,5240 | −0,0899 | |||
| SO / The Southern Company | 0,04 | 0,00 | 4,12 | −0,15 | 0,5205 | −0,0506 | |||
| GSG / iShares S&P GSCI Commodity-Indexed Trust | 0,18 | 0,00 | 4,06 | −3,22 | 0,5130 | −0,0678 | |||
| AGI / Alamos Gold Inc. | 0,15 | 43,14 | 4,05 | 42,18 | 0,5111 | 0,1171 | |||
| VTHR / Vanguard Scottsdale Funds - Vanguard Russell 3000 ETF | 0,01 | −9,13 | 3,96 | 0,46 | 0,5001 | −0,0455 | |||
| AEM / Agnico Eagle Mines Limited | 0,03 | 19,05 | 3,75 | 30,58 | 0,4729 | 0,0761 | |||
| BLK / BlackRock, Inc. | 0,00 | 0,00 | 3,70 | 10,85 | 0,4671 | 0,0054 | |||
| QCOM / QUALCOMM Incorporated | 0,02 | 0,00 | 3,68 | 3,66 | 0,4646 | −0,0265 | |||
| RTX / RTX Corporation | 0,02 | 39,75 | 3,47 | 54,04 | 0,4380 | 0,1264 | |||
| V / Visa Inc. | 0,01 | 0,00 | 3,36 | 1,33 | 0,4241 | −0,0346 | |||
| PAYX / Paychex, Inc. | 0,02 | 0,00 | 3,24 | −5,70 | 0,4093 | −0,0664 | |||
| PG / The Procter & Gamble Company | 0,02 | 0,00 | 3,13 | −6,51 | 0,3952 | −0,0681 | |||
| VO / Vanguard Index Funds - Vanguard Mid-Cap ETF | 0,01 | 3,06 | 0,3868 | 0,3868 | |||||
| ADI / Analog Devices, Inc. | 0,01 | −25,24 | 2,99 | −11,79 | 0,3769 | −0,0912 | |||
| MMC / Marsh & McLennan Companies, Inc. | 0,01 | 0,00 | 2,97 | −10,41 | 0,3748 | −0,0836 | |||
| SYK / Stryker Corporation | 0,01 | 0,00 | 2,75 | 6,27 | 0,3467 | −0,0108 | |||
| AAPL / Apple Inc. | 0,01 | 0,00 | 2,45 | −7,67 | 0,3088 | −0,0576 | |||
| AXP / American Express Company | 0,01 | 0,00 | 2,43 | 18,57 | 0,3072 | 0,0232 | |||
| ACN / Accenture plc | 0,01 | 0,00 | 2,35 | −4,24 | 0,2965 | −0,0427 | |||
| WELL / Welltower Inc. | 0,01 | 5,11 | 2,30 | 5,45 | 0,2908 | −0,0113 | |||
| PNC / The PNC Financial Services Group, Inc. | 0,01 | 0,00 | 2,26 | 6,06 | 0,2851 | −0,0095 | |||
| NEE / NextEra Energy, Inc. | 0,03 | 0,00 | 2,18 | −2,07 | 0,2747 | −0,0327 | |||
| WEC / WEC Energy Group, Inc. | 0,02 | 0,00 | 2,09 | −4,40 | 0,2637 | −0,0385 | |||
| TJX / The TJX Companies, Inc. | 0,02 | 56,06 | 2,07 | 58,27 | 0,2610 | 0,0802 | |||
| SPG / Simon Property Group, Inc. | 0,01 | 0,00 | 2,05 | −3,21 | 0,2587 | −0,0342 | |||
| CTAS / Cintas Corporation | 0,01 | 0,00 | 2,03 | 8,43 | 0,2567 | −0,0027 | |||
| MDLZ / Mondelez International, Inc. | 0,03 | 0,00 | 1,91 | −0,62 | 0,2413 | −0,0247 | |||
| MCK / McKesson Corporation | 0,00 | 84,33 | 1,74 | 100,81 | 0,2198 | 0,0998 | |||
| MRK / Merck & Co., Inc. | 0,02 | 0,00 | 1,67 | −11,83 | 0,2108 | −0,0511 | |||
| CVX / Chevron Corporation | 0,01 | 0,00 | 1,62 | −14,39 | 0,2050 | −0,0575 | |||
| EQIX / Equinix, Inc. | 0,00 | 0,00 | 1,55 | −2,46 | 0,1956 | −0,0241 | |||
| LMT / Lockheed Martin Corporation | 0,00 | 0,00 | 1,52 | 3,69 | 0,1914 | −0,0109 | |||
| MAR / Marriott International, Inc. | 0,01 | 0,00 | 1,47 | 14,71 | 0,1852 | 0,0083 | |||
| GD / General Dynamics Corporation | 0,00 | 0,00 | 1,45 | 7,00 | 0,1834 | −0,0044 | |||
| PSX / Phillips 66 | 0,01 | 0,00 | 1,38 | −3,35 | 0,1747 | −0,0234 | |||
| CFG / Citizens Financial Group, Inc. | 0,03 | 0,00 | 1,37 | 9,17 | 0,1729 | −0,0006 | |||
| XOM / Exxon Mobil Corporation | 0,01 | 0,00 | 1,36 | −9,41 | 0,1714 | −0,0358 | |||
| APD / Air Products and Chemicals, Inc. | 0,00 | 0,00 | 1,25 | −4,37 | 0,1576 | −0,0230 | |||
| MINT / PIMCO ETF Trust - PIMCO Enhanced Short Maturity Active Exchange-Traded Fund | 0,01 | 0,00 | 1,09 | −0,09 | 0,1376 | −0,0133 | |||
| VCSH / Vanguard Scottsdale Funds - Vanguard Short-Term Corporate Bond ETF | 0,01 | 0,00 | 1,07 | 0,76 | 0,1345 | −0,0119 | |||
| IGSB / iShares Trust - iShares 1-5 Year Investment Grade Corporate Bond ETF | 0,02 | 0,00 | 1,05 | 0,77 | 0,1326 | −0,0116 | |||
| VICI / VICI Properties Inc. | 0,03 | 0,00 | 1,03 | 0,00 | 0,1298 | −0,0125 | |||
| DLR / Digital Realty Trust, Inc. | 0,01 | 11,56 | 0,95 | 35,71 | 0,1200 | 0,0231 | |||
| FPE / First Trust Exchange-Traded Fund III - First Trust Preferred Securities and Income ETF | 0,05 | 0,00 | 0,87 | 1,29 | 0,1093 | −0,0091 | |||
| BSV / Vanguard Bond Index Funds - Vanguard Short-Term Bond ETF | 0,01 | 0,00 | 0,83 | 0,61 | 0,1049 | −0,0094 | |||
| VLO / Valero Energy Corporation | 0,01 | 0,00 | 0,77 | 1,73 | 0,0967 | −0,0074 | |||
| PEP / PepsiCo, Inc. | 0,00 | 0,00 | 0,37 | −11,88 | 0,0469 | −0,0115 | |||
| KO / The Coca-Cola Company | 0,00 | 0,00 | 0,34 | −1,17 | 0,0426 | −0,0047 | |||
| FIS / Fidelity National Information Services, Inc. | 0,00 | 0,00 | 0,31 | 8,93 | 0,0385 | −0,0002 | |||
| MPC / Marathon Petroleum Corporation | 0,00 | 0,00 | 0,24 | 14,35 | 0,0302 | 0,0012 | |||
| VTWV / Vanguard Scottsdale Funds - Vanguard Russell 2000 Value ETF | 0,00 | −100,00 | 0,00 | 0,0000 | |||||
| URI / United Rentals, Inc. | 0,00 | −100,00 | 0,00 | 0,0000 | |||||
| IWF / iShares Trust - iShares Russell 1000 Growth ETF | 0,00 | −100,00 | 0,00 | 0,0000 |