Grunnleggende statistikk
| Institusjonelle eiere | 142 total, 139 long only, 1 short only, 2 long/short - change of −9,55% MRQ |
| Gjennomsnittlig porteføljeallokering | 0.1326 % - change of −16,83% MRQ |
| Institusjonelle aksjer (Long) | 20 961 440 (ex 13D/G) - change of −1,62MM shares −7,19% MRQ |
| Institusjonell verdi (Long) | $ 137 074 USD ($1000) |
Institusjonelt eierskap og aksjonærer
BlackRock TCP Capital Corp. (US:TCPC) har 142 institusjonelle eiere og aksjonærer som har sendt inn 13D/G- eller 13F-skjemaer til Securities Exchange Commission (SEC). Disse institusjonene eier til sammen 21,272,201 aksjer. De største aksjonærene inkluderer Van Eck Associates Corp, BIZD - VanEck Vectors BDC Income ETF, KBWD - Invesco KBW High Dividend Yield Financial ETF, UBS Group AG, Invesco Ltd., Transcend Wealth Collective, Llc, Next Capital Management LLC, Two Sigma Advisers, Lp, Two Sigma Investments, Lp, and Morgan Stanley .
BlackRock TCP Capital Corp. (NasdaqGS:TCPC) institusjonell eierstruktur viser nåværende posisjoner i selskapet fordelt på institusjoner og fond, samt de siste endringene i posisjonsstørrelse. De største aksjonærene kan være individuelle investorer, verdipapirfond, hedgefond eller institusjoner. Schedule 13D indikerer at investoren eier (eller har eid) mer enn 5 % av selskapet og har til hensikt (eller hadde til hensikt) å aktivt forfølge en endring i forretningsstrategien. Schedule 13G indikerer en passiv investering på over 5 %.
The share price as of September 9, 2025 is 7,19 / share. Previously, on September 10, 2024, the share price was 9,07 / share. This represents a decline of 20,73% over that period.

Fondssentiment-score
Fondssentiment Score (også kjent som akkumulering av eierskap poengsum) viser hvilke aksjer som er mest kjøpt av fond. Den er resultatet av en sofistikert, kvantitativ flerfaktormodell som identifiserer selskaper med de høyeste nivåene av institusjonell akkumulering. Beregningsmodellen for poeng bruker en kombinasjon av den totale økningen i antall offentliggjorte eiere, endringer i porteføljeallokeringen til disse eierne og andre beregninger. Tallet går fra 0 til 100, der høyere tall indikerer en høyere grad av akkumulering i forhold til sammenlignbare selskaper, der 50 er gjennomsnittet.
Oppdateringsfrekvens: Daglig
Sjekk ut Ownership Explorer, som inneholder en liste over de høyest rangerte selskapene.
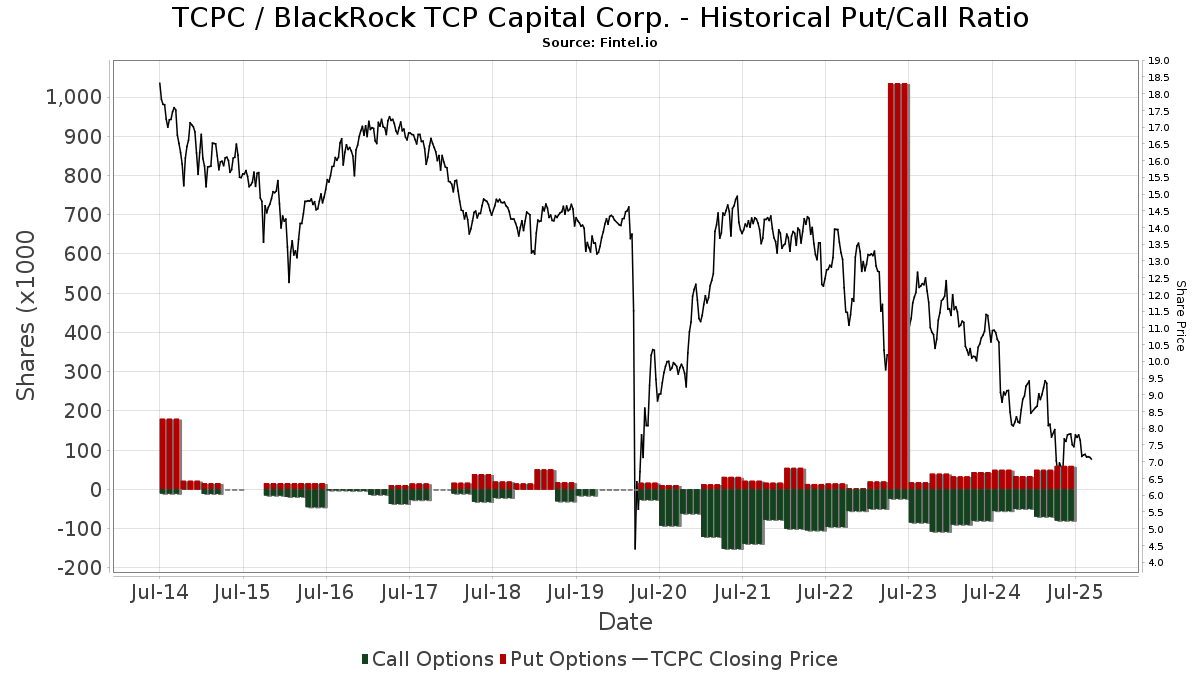
Institusjonell Put/Call-forhold
I tillegg til å rapportere standard aksje- og gjeldsemisjoner må institusjoner med mer enn 100 millioner kroner i forvaltningskapital også oppgi beholdningen av put- og callopsjoner. Siden put-opsjoner generelt indikerer et negativt sentiment, og call-opsjoner indikerer et positivt sentiment, kan vi få et inntrykk av det generelle institusjonelle sentimentet ved å plotte forholdet mellom put- og call-opsjoner. Diagrammet til høyre viser det historiske forholdet mellom put- og call-opsjoner for dette instrumentet.
Ved å bruke Put/Call-forholdet som en indikator på investorsentimentet kan man overvinne en av de viktigste svakhetene ved å bruke totalt institusjonelt eierskap, nemlig at en betydelig andel av forvaltningskapitalen investeres passivt for å følge indekser. Passivt forvaltede fond kjøper vanligvis ikke opsjoner, slik at indikatoren for put/call-forhold i større grad gjenspeiler stemningen i aktivt forvaltede fond.
13F- og NPORT-arkiveringer
Detaljer om 13F-arkiveringer er gratis. Detaljer om NP-arkiveringer krever et premium-medlemskap. Grønne rader indikerer nye posisjoner. Røde rader indikerer lukkede posisjoner. Klikk på lenke ikonet for å se hele transaksjonshistorikken.
Oppgrader
for å låse opp premiedata og eksportere til Excel. ![]() .
.
| Fildato | Kilde | Investor | Type | Gjennomsnittlig pris (estimert) |
Aksjer | Δ Aksjer (%) |
Rapportert verdi ($1000) | Verdi (%) | Portallokering (%) | |
|---|---|---|---|---|---|---|---|---|---|---|
| 2025-07-23 | 13F | Kingswood Wealth Advisors, Llc | 0 | −100,00 | 0 | −100,00 | ||||
| 2025-08-08 | 13F | Alberta Investment Management Corp | 0 | −100,00 | 0 | |||||
| 2025-08-14 | 13F | Federation des caisses Desjardins du Quebec | 1 150 | 0,00 | 9 | −11,11 | ||||
| 2025-07-22 | 13F | Romano Brothers And Company | 87 645 | 0,00 | 675 | −3,99 | ||||
| 2025-08-14 | 13F | Royal Bank Of Canada | 32 988 | 11,40 | 254 | 7,17 | ||||
| 2025-04-09 | 13F | American National Bank | 0 | −100,00 | 0 | −100,00 | ||||
| 2025-08-12 | 13F | LPL Financial LLC | 212 989 | −4,68 | 1 640 | −8,33 | ||||
| 2025-08-15 | 13F | Morgan Stanley | 707 036 | −24,10 | 5 444 | −27,04 | ||||
| 2025-07-10 | 13F | Redhawk Wealth Advisors, Inc. | 106 720 | 822 | ||||||
| 2025-07-23 | 13F | Joel Isaacson & Co., LLC | 16 710 | 0,00 | 129 | −3,76 | ||||
| 2025-08-12 | 13F | Barings Llc | 497 580 | 0,00 | 3 831 | −3,86 | ||||
| 2025-08-04 | 13F | Arkadios Wealth Advisors | 65 670 | −31,96 | 506 | −34,67 | ||||
| 2025-08-13 | 13F | Loomis Sayles & Co L P | 245 000 | 0,00 | 1 886 | 188 500,00 | ||||
| 2025-08-13 | 13F | Colonial Trust Advisors | 573 | 4 | ||||||
| 2025-08-14 | 13F | Van Eck Associates Corp | 2 178 715 | 7,30 | 17 | 0,00 | ||||
| 2025-08-06 | 13F | Ethos Financial Group, LLC | 0 | −100,00 | 0 | −100,00 | ||||
| 2025-08-14 | 13F | CF Capital LLC | 0 | −100,00 | 0 | |||||
| 2025-08-01 | 13F | Transcend Wealth Collective, Llc | 1 333 693 | −9,43 | 10 269 | −12,94 | ||||
| 2025-08-04 | 13F | Muzinich & Co., Inc. | 256 389 | −2,84 | 1 974 | −6,58 | ||||
| 2025-08-08 | 13F | Cetera Investment Advisers | 58 379 | −89,64 | 450 | −90,05 | ||||
| 2025-08-01 | 13F | Y-Intercept (Hong Kong) Ltd | 0 | −100,00 | 0 | |||||
| 2025-08-13 | 13F | Northern Trust Corp | 29 776 | 229 | ||||||
| 2025-08-14 | 13F | Citadel Advisors Llc | Put | 0 | −100,00 | 0 | ||||
| 2025-08-13 | 13F | Transce3nd, LLC | 6 868 | 0,53 | 53 | −3,70 | ||||
| 2025-08-14 | 13F | Mariner, LLC | 29 592 | 2,98 | 228 | −1,30 | ||||
| 2025-07-30 | 13F | Bogart Wealth, LLC | 11 812 | 0,00 | 91 | −4,26 | ||||
| 2025-07-11 | 13F | Farther Finance Advisors, LLC | 799 | 0,00 | 6 | 0,00 | ||||
| 2025-07-30 | NP | ORR - Militia Long/Short Equity ETF | Short | −310 761 | 311,67 | −2 436 | 282,42 | |||
| 2025-04-11 | 13F | Seacrest Wealth Management, Llc | 0 | −100,00 | 0 | |||||
| 2025-05-12 | 13F | Connor, Clark & Lunn Investment Management Ltd. | 0 | −100,00 | 0 | |||||
| 2025-05-12 | 13F | Fmr Llc | 0 | −100,00 | 0 | |||||
| 2025-07-21 | 13F | Ameritas Advisory Services, LLC | 1 364 | 11 | ||||||
| 2025-07-31 | 13F | Sumitomo Mitsui Trust Holdings, Inc. | 253 357 | −2,88 | 1 951 | −6,65 | ||||
| 2025-08-12 | 13F | J.w. Cole Advisors, Inc. | 142 047 | 24,94 | 1 094 | 20,11 | ||||
| 2025-08-14 | 13F | Ubs Asset Management Americas Inc | 131 304 | −11,45 | 1 011 | −14,83 | ||||
| 2025-05-13 | 13F | Evoke Wealth, Llc | 0 | −100,00 | 0 | |||||
| 2025-08-06 | 13F | Prospera Financial Services Inc | 14 936 | 115 | ||||||
| 2025-08-13 | 13F | Virtus Investment Advisers, Inc. | 165 000 | 6,35 | 1 270 | 2,25 | ||||
| 2025-07-10 | 13F | Wealth Enhancement Advisory Services, Llc | 11 656 | 13,12 | 91 | 10,98 | ||||
| 2025-08-05 | 13F | Huntington National Bank | 1 000 | 8 | ||||||
| 2025-07-31 | 13F | Cambridge Investment Research Advisors, Inc. | 26 389 | −4,93 | 0 | |||||
| 2025-08-12 | 13F | Advisors Asset Management, Inc. | 58 397 | −57,51 | 450 | −59,18 | ||||
| 2025-08-14 | 13F | Aquatic Capital Management LLC | 0 | −100,00 | 0 | |||||
| 2025-04-21 | 13F | Nelson, Van Denburg & Campbell Wealth Management Group, LLC | 0 | −100,00 | 0 | |||||
| 2025-08-12 | 13F | Legal & General Group Plc | 559 479 | −0,01 | 4 300 | −4,25 | ||||
| 2025-08-11 | 13F | Nomura Asset Management Co Ltd | 3 904 | 30 | ||||||
| 2025-08-07 | 13F | Samalin Investment Counsel, LLC | 65 611 | −4,32 | 505 | −8,01 | ||||
| 2025-08-14 | 13F | Kovitz Investment Group Partners, LLC | 120 032 | −51,56 | 924 | −53,43 | ||||
| 2025-08-12 | 13F | BlackRock, Inc. | 510 941 | 29,32 | 3 934 | 24,34 | ||||
| 2025-05-12 | 13F | National Bank Of Canada /fi/ | 0 | −100,00 | 0 | |||||
| 2025-08-11 | 13F | United Advisor Group, LLC | 141 741 | −5,80 | 1 091 | −9,46 | ||||
| 2025-07-24 | 13F | Us Bancorp \de\ | 1 991 | 0,00 | 15 | 0,00 | ||||
| 2025-05-15 | 13F | Alpine Global Management, LLC | 0 | −100,00 | 0 | −100,00 | ||||
| 2025-08-07 | 13F | Midwest Trust Co | 12 500 | 96 | ||||||
| 2025-08-13 | 13F | Cerity Partners LLC | 24 643 | −74,79 | 190 | −75,83 | ||||
| 2025-08-27 | 13F/A | Squarepoint Ops LLC | 0 | −100,00 | 0 | −100,00 | ||||
| 2025-05-13 | 13F | Cercano Management LLC | 0 | −100,00 | 0 | |||||
| 2025-08-13 | 13F | Lido Advisors, LLC | 27 775 | −30,85 | 214 | −33,64 | ||||
| 2025-05-13 | 13F | Sterling Capital Management LLC | 0 | −100,00 | 0 | |||||
| 2025-08-14 | 13F | Bank Of America Corp /de/ | 223 722 | 101,64 | 1 723 | 93,92 | ||||
| 2025-08-25 | 13F/A | Neuberger Berman Group LLC | 21 200 | 0,00 | 163 | −3,55 | ||||
| 2025-08-05 | 13F | Mission Wealth Management, Lp | 14 859 | 114 | ||||||
| 2025-07-17 | 13F | Sound Income Strategies, LLC | 1 468 | 0,00 | 11 | 0,00 | ||||
| 2025-05-30 | NP | ERNZ - TrueShares Active Yield ETF | 0 | −100,00 | 0 | −100,00 | ||||
| 2025-08-13 | 13F | Invesco Ltd. | 1 423 209 | −7,63 | 10 959 | −11,21 | ||||
| 2025-08-14 | 13F | Schonfeld Strategic Advisors LLC | 0 | −100,00 | 0 | |||||
| 2025-08-13 | 13F | OMERS ADMINISTRATION Corp | 0 | −100,00 | 0 | |||||
| 2025-08-14 | 13F | Two Sigma Advisers, Lp | 950 517 | 2,34 | 7 319 | −1,63 | ||||
| 2025-08-12 | 13F | Change Path, LLC | 96 565 | 11,69 | 744 | 7,37 | ||||
| 2025-08-12 | 13F | CIBC Private Wealth Group, LLC | 3 160 | 0,00 | 24 | 20,00 | ||||
| 2025-07-11 | 13F | Mallini Complete Financial Planning LLC | 22 898 | 1,75 | 176 | −2,22 | ||||
| 2025-08-13 | 13F | EverSource Wealth Advisors, LLC | 750 | 0,00 | 6 | −16,67 | ||||
| 2025-08-12 | 13F | Journey Strategic Wealth Llc | 10 826 | 0,00 | 83 | −3,49 | ||||
| 2025-08-12 | 13F | Wood Tarver Financial Group, LLC | 470 | 0,00 | 0 | −100,00 | ||||
| 2025-08-14 | 13F | Goldman Sachs Group Inc | 0 | −100,00 | 0 | |||||
| 2025-07-28 | NP | KBWD - Invesco KBW High Dividend Yield Financial ETF This fund is a listed as child fund of Invesco Ltd. and if that institution has disclosed ownership in this security, then these positions will not be double counted when calculating total shares and total value | 1 516 037 | −4,05 | 11 886 | −10,87 | ||||
| 2025-05-15 | 13F | Hrt Financial Lp | 0 | −100,00 | 0 | |||||
| 2025-08-08 | 13F | Larson Financial Group LLC | 1 000 | 0,00 | 8 | −12,50 | ||||
| 2025-08-07 | 13F/A | Tortoise Investment Management, LLC | 0 | −100,00 | 0 | |||||
| 2025-08-06 | 13F | Legacy Wealth Managment, LLC/ID | 0 | −100,00 | 0 | −100,00 | ||||
| 2025-08-15 | 13F | Great West Life Assurance Co /can/ | 86 364 | 4,41 | 1 | |||||
| 2025-08-08 | 13F/A | Ignite Planners, LLC | 30 754 | −67,55 | 236 | −63,07 | ||||
| 2025-08-04 | 13F | MeadowBrook Investment Advisors LLC | 6 733 | 0,00 | 52 | −3,77 | ||||
| 2025-08-01 | 13F | Financial Counselors Inc | 0 | −100,00 | 0 | |||||
| 2025-07-22 | 13F | Accel Wealth Management | 12 000 | 0,00 | 92 | −4,17 | ||||
| 2025-07-22 | 13F | Wealthcare Advisory Partners LLC | 10 135 | −3,49 | 78 | −7,14 | ||||
| 2025-08-06 | 13F | Legacy Investment Solutions, LLC | 0 | −100,00 | 0 | −100,00 | ||||
| 2025-08-14 | 13F | Aqr Capital Management Llc | 59 557 | 459 | ||||||
| 2025-07-31 | 13F | Nisa Investment Advisors, Llc | 0 | −100,00 | 0 | |||||
| 2025-07-23 | 13F | Columbus Macro, LLC | 0 | −100,00 | 0 | |||||
| 2025-08-04 | 13F | Creekmur Asset Management LLC | 1 | 0,00 | 0 | |||||
| 2025-06-25 | NP | VPC - Virtus Private Credit Strategy ETF | 141 720 | −3,57 | 969 | −28,38 | ||||
| 2025-08-13 | 13F | Wealthedge Investment Advisors, Llc | 0 | −100,00 | 0 | |||||
| 2025-08-14 | 13F | Two Sigma Investments, Lp | 712 321 | 8,83 | 5 485 | 4,62 | ||||
| 2025-08-14 | 13F | Atomi Financial Group, Inc. | 13 151 | 0,00 | 101 | −3,81 | ||||
| 2025-07-25 | 13F | Verdence Capital Advisors LLC | 0 | −100,00 | 0 | |||||
| 2025-08-13 | 13F | M&t Bank Corp | 24 122 | 0,00 | 186 | −4,15 | ||||
| 2025-09-04 | 13F/A | Advisor Group Holdings, Inc. | 63 921 | 1,89 | 492 | −1,99 | ||||
| 2025-08-12 | 13F | Jpmorgan Chase & Co | 0 | −100,00 | 0 | |||||
| 2025-07-28 | 13F | Harbour Investments, Inc. | 221 | 2,79 | 2 | 0,00 | ||||
| 2025-07-30 | 13F | Privium Fund Management (UK) Ltd | 125 977 | −15,04 | 983 | −16,78 | ||||
| 2025-08-15 | 13F | Caxton Associates Llp | 60 779 | 16,21 | 468 | 11,72 | ||||
| 2025-08-05 | 13F | Simplex Trading, Llc | 0 | −100,00 | 0 | |||||
| 2025-08-15 | 13F | Captrust Financial Advisors | 38 312 | −62,14 | 295 | −63,58 | ||||
| 2025-08-14 | 13F | Eight 31 Financial Llc | 17 246 | 133 | ||||||
| 2025-08-14 | 13F | Stifel Financial Corp | 75 444 | −0,78 | 581 | −4,76 | ||||
| 2025-07-28 | 13F | Curated Wealth Partners LLC | 38 587 | 0,00 | 297 | −3,88 | ||||
| 2025-08-14 | 13F | BI Asset Management Fondsmaeglerselskab A/S | 417 991 | 6,06 | 3 | 0,00 | ||||
| 2025-07-18 | 13F | Truist Financial Corp | 0 | −100,00 | 0 | |||||
| 2025-08-14 | 13F | Comerica Bank | 1 840 | −1,18 | 14 | 0,00 | ||||
| 2025-08-14 | 13F/A | Rockefeller Capital Management L.P. | 120 624 | −44,46 | 929 | −46,64 | ||||
| 2025-08-14 | 13F | Millennium Management Llc | 11 447 | 88 | ||||||
| 2025-07-31 | 13F | Caitong International Asset Management Co., Ltd | 960 | 153,97 | 7 | 133,33 | ||||
| 2025-08-07 | 13F | Lakeridge Wealth Management LLC | 0 | −100,00 | 0 | |||||
| 2025-08-12 | 13F | Clear Street Markets Llc | 0 | −100,00 | 0 | |||||
| 2025-08-13 | 13F | Centiva Capital, LP | 0 | −100,00 | 0 | |||||
| 2025-05-15 | 13F | Talon Private Wealth, LLC | 0 | −100,00 | 0 | −100,00 | ||||
| 2025-05-09 | 13F | Pathway Financial Advisers, LLC | 0 | −100,00 | 0 | |||||
| 2025-05-14 | 13F | Credit Agricole S A | 235 | 0,00 | 2 | −50,00 | ||||
| 2025-08-12 | 13F | Dynamic Technology Lab Private Ltd | 48 440 | 359,15 | 373 | 338,82 | ||||
| 2025-08-14 | 13F | AllSquare Wealth Management LLC | 0 | −100,00 | 0 | |||||
| 2025-08-18 | 13F | Geneos Wealth Management Inc. | 304 | 0,00 | 2 | 0,00 | ||||
| 2025-08-13 | 13F | WealthTrust Axiom LLC | 14 975 | 0,00 | 115 | −3,36 | ||||
| 2025-08-06 | 13F | Commonwealth Equity Services, Llc | 68 149 | 0,21 | 1 | |||||
| 2025-06-27 | NP | LBO - WHITEWOLF Publicly Listed Private Equity ETF | 8 743 | 14,27 | 60 | −15,71 | ||||
| 2025-08-08 | 13F | MTM Investment Management, LLC | 5 976 | 46 | ||||||
| 2025-08-14 | 13F | Ameriprise Financial Inc | 21 380 | −1,03 | 165 | −5,20 | ||||
| 2025-08-19 | 13F | Asset Dedication, LLC | 148 | 0,00 | 1 | 0,00 | ||||
| 2025-08-14 | 13F | Quarry LP | 2 064 | 16 | ||||||
| 2025-08-11 | 13F | TD Waterhouse Canada Inc. | 215 | 0,00 | 2 | 0,00 | ||||
| 2025-08-15 | 13F | Kestra Advisory Services, LLC | 56 782 | −24,68 | 437 | −27,53 | ||||
| 2025-07-28 | 13F | BRYN MAWR TRUST Co | 2 000 | 0,00 | 15 | −6,25 | ||||
| 2025-08-14 | 13F | UBS Group AG | 1 475 030 | 12,37 | 11 358 | 8,02 | ||||
| 2025-08-11 | 13F | Hexagon Capital Partners LLC | 0 | −100,00 | 0 | |||||
| 2025-07-31 | 13F | Oppenheimer & Co Inc | 13 900 | −17,75 | 107 | −20,74 | ||||
| 2025-08-11 | 13F | Universal- Beteiligungs- und Servicegesellschaft mbH | 51 900 | 0,00 | 400 | −3,86 | ||||
| 2025-08-14 | 13F | Jane Street Group, Llc | 20 428 | 157 | ||||||
| 2025-05-15 | 13F | Ares Management Llc | 0 | −100,00 | 0 | |||||
| 2025-08-07 | 13F | Hennion & Walsh Asset Management, Inc. | 290 474 | −24,42 | 2 237 | −27,36 | ||||
| 2025-08-04 | 13F | Spire Wealth Management | 0 | −100,00 | 0 | |||||
| 2025-08-12 | 13F | Bokf, Na | 208 | 0,00 | 2 | 0,00 | ||||
| 2025-08-15 | 13F | Tower Research Capital LLC (TRC) | 0 | −100,00 | 0 | |||||
| 2025-07-17 | 13F | GraniteShares Advisors LLC | 319 833 | 6,67 | 2 463 | 2,54 | ||||
| 2025-08-06 | 13F | First Horizon Advisors, Inc. | 0 | −100,00 | 0 | |||||
| 2025-08-13 | 13F | Jones Financial Companies Lllp | 1 715 | 0,00 | 13 | 0,00 | ||||
| 2025-08-13 | 13F | Marshall Wace, Llp | 525 266 | 4 045 | ||||||
| 2025-08-14 | 13F | Susquehanna International Group, Llp | Call | 28 600 | −45,73 | 220 | −47,87 | |||
| 2025-08-21 | NP | BIZD - VanEck Vectors BDC Income ETF | 1 926 567 | 2,81 | 14 835 | −1,17 | ||||
| 2025-08-01 | 13F | Envestnet Asset Management Inc | 64 809 | −89,08 | 499 | −89,50 | ||||
| 2025-08-05 | 13F | Next Capital Management LLC | 1 134 826 | 2 131,36 | 8 738 | 2 046,93 | ||||
| 2025-08-13 | 13F | Northwestern Mutual Wealth Management Co | 0 | −100,00 | 0 | |||||
| 2025-08-11 | 13F | Lsv Asset Management | 361 470 | 1,78 | 3 | 0,00 | ||||
| 2025-08-14 | 13F | Susquehanna International Group, Llp | 65 302 | 47,26 | 503 | 41,41 | ||||
| 2025-08-14 | 13F | Susquehanna International Group, Llp | Put | 57 000 | 25,00 | 439 | 20,00 | |||
| 2025-08-12 | 13F | XTX Topco Ltd | 21 536 | 166 | ||||||
| 2025-03-28 | NP | DVDN - Kingsbarn Dividend Opportunity ETF | 6 318 | 58 | ||||||
| 2025-05-13 | 13F | M Holdings Securities, Inc. | 0 | −100,00 | 0 | |||||
| 2025-04-22 | 13F | TrueMark Investments, LLC | 0 | −100,00 | 0 | |||||
| 2025-08-05 | 13F | Simplex Trading, Llc | Put | 3 100 | 10,71 | 0 | ||||
| 2025-08-05 | 13F | Simplex Trading, Llc | Call | 5 700 | 62,86 | 0 | ||||
| 2025-07-29 | 13F | Disciplined Investments, LLC | 20 000 | 0,00 | 154 | −3,75 | ||||
| 2025-08-07 | 13F | Verus Capital Partners, Llc | 12 750 | −79,47 | 98 | −80,28 | ||||
| 2025-08-12 | 13F | Steward Partners Investment Advisory, Llc | 13 563 | 0,00 | 104 | −3,70 | ||||
| 2025-08-05 | 13F | Access Investment Management LLC | 54 300 | 0,00 | 418 | −11,44 | ||||
| 2025-08-11 | 13F | VSM Wealth Advisory, LLC | 7 563 | −32,65 | 58 | −34,83 | ||||
| 2025-07-23 | 13F | Steel Peak Wealth Management LLC | 10 000 | 0,00 | 77 | −3,75 | ||||
| 2025-08-14 | 13F | Sunbelt Securities, Inc. | 13 580 | −6,86 | 118 | 1,72 | ||||
| 2025-05-14 | 13F | Virtus ETF Advisers LLC | 0 | −100,00 | 0 | |||||
| 2025-07-25 | 13F | Cwm, Llc | 2 295 | 0,00 | 0 | |||||
| 2025-08-11 | 13F | Nations Financial Group Inc, /ia/ /adv | 50 811 | −2,55 | 391 | −6,24 | ||||
| 2025-07-17 | 13F | Janney Montgomery Scott LLC | 0 | −100,00 | 0 | |||||
| 2025-08-14 | 13F | Raymond James Financial Inc | 90 675 | 7,73 | 698 | 3,56 | ||||
| 2025-08-08 | 13F | Avantax Advisory Services, Inc. | 12 922 | 0,20 | 100 | −3,88 | ||||
| 2025-07-18 | 13F | Bartlett & Co. Wealth Management Llc | 20 000 | 25,00 | 154 | 20,31 | ||||
| 2025-05-15 | 13F | Balyasny Asset Management Llc | 0 | −100,00 | 0 | −100,00 | ||||
| 2025-05-15 | 13F | Two Sigma Securities, Llc | 0 | −100,00 | 0 | |||||
| 2025-08-05 | 13F | GPS Wealth Strategies Group, LLC | 2 761 | 0,00 | 21 | −4,55 | ||||
| 2025-05-14 | 13F | Group One Trading, L.p. | 0 | −100,00 | 0 | |||||
| 2025-08-08 | 13F | Pnc Financial Services Group, Inc. | 10 200 | 0,00 | 79 | −3,70 | ||||
| 2025-07-24 | 13F | IFP Advisors, Inc | 200 | −13,04 | 2 | 0,00 | ||||
| 2025-08-13 | 13F | ExodusPoint Capital Management, LP | 0 | −100,00 | 0 | |||||
| 2025-08-07 | 13F | Allworth Financial LP | 1 956 | 15 | ||||||
| 2025-05-12 | 13F | Entropy Technologies, LP | 0 | −100,00 | 0 | |||||
| 2025-08-12 | 13F | Proequities, Inc. | Put | 0 | 0 | |||||
| 2025-08-14 | 13F | GWM Advisors LLC | 1 334 | −27,26 | 10 | −28,57 | ||||
| 2025-05-09 | 13F | Atria Wealth Solutions, Inc. | 0 | −100,00 | 0 | |||||
| 2025-08-12 | 13F | Proequities, Inc. | Call | 0 | 0 | |||||
| 2025-08-12 | 13F | Proequities, Inc. | 0 | 0 | ||||||
| 2025-08-14 | 13F | McIlrath & Eck, LLC | 5 489 | 0,00 | 42 | −2,33 | ||||
| 2025-08-14 | 13F | Group One Trading, L.p. | Call | 25 000 | 1 150,00 | 192 | 1 100,00 | |||
| 2025-05-12 | 13F | Virtu Financial LLC | 0 | −100,00 | 0 | |||||
| 2025-08-08 | 13F | Creative Planning | 11 062 | 85 | ||||||
| 2025-06-12 | 13F/A | Deutsche Bank Ag\ | 0 | −100,00 | 0 | |||||
| 2025-08-05 | 13F | Key FInancial Inc | 26 | 0,00 | 0 | |||||
| 2025-08-14 | 13F | Wells Fargo & Company/mn | 66 327 | 0,08 | 511 | −3,77 | ||||
| 2025-07-21 | 13F | Future Financial Wealth Managment LLC | 4 000 | 0,00 | 31 | −6,25 | ||||
| 2025-07-07 | 13F | Investors Research Corp | 3 471 | 0,00 | 27 | −3,70 | ||||
| 2025-07-30 | 13F | D.a. Davidson & Co. | 459 881 | −3,28 | 3 541 | −7,01 | ||||
| 2025-08-12 | 13F | Insigneo Advisory Services, Llc | 12 055 | −0,86 | 93 | −5,15 | ||||
| 2025-07-09 | 13F | Triumph Capital Management | 30 834 | −2,63 | 237 | −6,32 | ||||
| 2025-08-11 | 13F | Citigroup Inc | 1 | 0 | ||||||
| 2025-08-29 | NP | GraniteShares ETF Trust - GraniteShares HIPS US High Income ETF | 319 833 | 6,67 | 2 463 | 2,54 | ||||
| 2025-07-22 | 13F | Merit Financial Group, LLC | 13 942 | 0,90 | 107 | −2,73 | ||||
| 2025-08-14 | 13F | Citadel Advisors Llc | Call | 20 100 | 76,32 | 155 | 69,23 | |||
| 2025-08-14 | 13F | New England Asset Management Inc | 170 034 | 0,00 | 1 309 | −3,82 | ||||
| 2025-08-14 | 13F | Wiley Bros.-aintree Capital, Llc | 35 580 | 0,00 | 274 | −3,87 | ||||
| 2025-05-14 | 13F | CI Private Wealth, LLC | 0 | −100,00 | 0 | −100,00 |