Grunnleggende statistikk
| Institusjonelle eiere | 107 total, 105 long only, 1 short only, 1 long/short - change of 21,59% MRQ |
| Gjennomsnittlig porteføljeallokering | 0.0302 % - change of −0,88% MRQ |
| Institusjonelle aksjer (Long) | 6 387 203 (ex 13D/G) - change of 1,81MM shares 39,68% MRQ |
| Institusjonell verdi (Long) | $ 138 898 USD ($1000) |
Institusjonelt eierskap og aksjonærer
Global X Funds - Global X SuperDividend ETF (US:SDIV) har 107 institusjonelle eiere og aksjonærer som har sendt inn 13D/G- eller 13F-skjemaer til Securities Exchange Commission (SEC). Disse institusjonene eier til sammen 6,819,612 aksjer. De største aksjonærene inkluderer LPL Financial LLC, Howard Capital Management Inc., Morgan Stanley, Foguth Wealth Management, LLC., Signal Advisors Wealth, LLC, Bank Of America Corp /de/, Advisor Group Holdings, Inc., Wells Fargo & Company/mn, Susquehanna International Group, Llp, and Newbridge Financial Services Group, Inc. .
Global X Funds - Global X SuperDividend ETF (ARCA:SDIV) institusjonell eierstruktur viser nåværende posisjoner i selskapet fordelt på institusjoner og fond, samt de siste endringene i posisjonsstørrelse. De største aksjonærene kan være individuelle investorer, verdipapirfond, hedgefond eller institusjoner. Schedule 13D indikerer at investoren eier (eller har eid) mer enn 5 % av selskapet og har til hensikt (eller hadde til hensikt) å aktivt forfølge en endring i forretningsstrategien. Schedule 13G indikerer en passiv investering på over 5 %.
The share price as of September 10, 2025 is 23,77 / share. Previously, on September 11, 2024, the share price was 21,94 / share. This represents an increase of 8,34% over that period.

Fondssentiment-score
Fondssentiment Score (også kjent som akkumulering av eierskap poengsum) viser hvilke aksjer som er mest kjøpt av fond. Den er resultatet av en sofistikert, kvantitativ flerfaktormodell som identifiserer selskaper med de høyeste nivåene av institusjonell akkumulering. Beregningsmodellen for poeng bruker en kombinasjon av den totale økningen i antall offentliggjorte eiere, endringer i porteføljeallokeringen til disse eierne og andre beregninger. Tallet går fra 0 til 100, der høyere tall indikerer en høyere grad av akkumulering i forhold til sammenlignbare selskaper, der 50 er gjennomsnittet.
Oppdateringsfrekvens: Daglig
Sjekk ut Ownership Explorer, som inneholder en liste over de høyest rangerte selskapene.
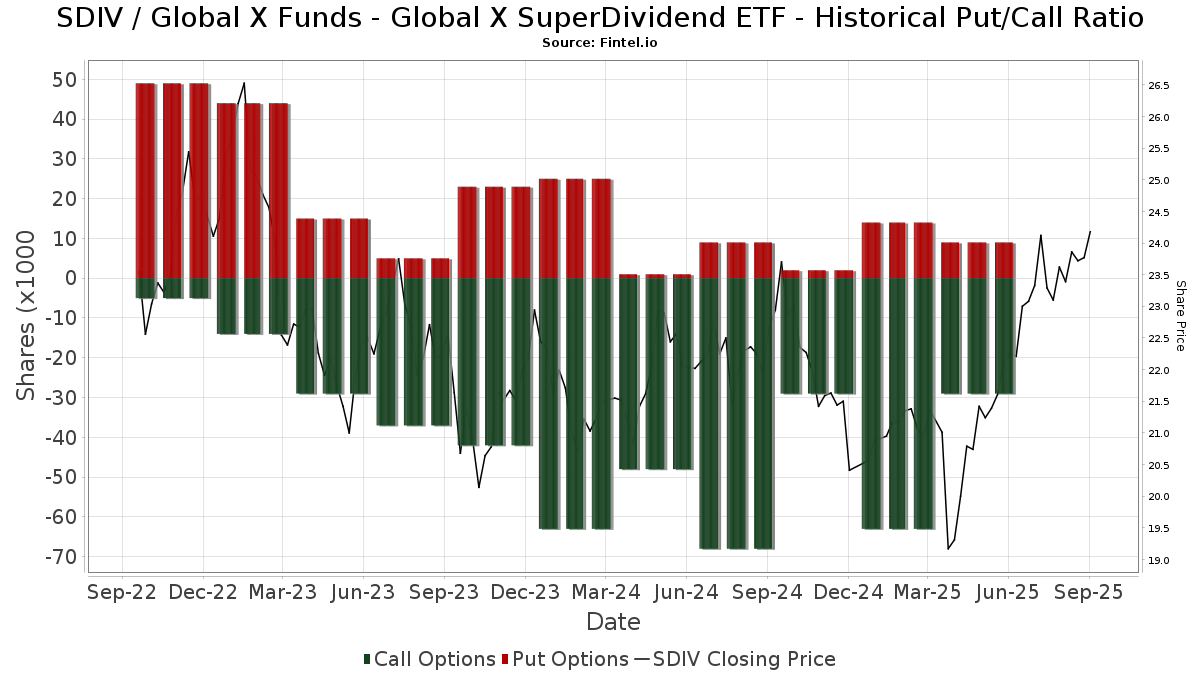
Institusjonell Put/Call-forhold
I tillegg til å rapportere standard aksje- og gjeldsemisjoner må institusjoner med mer enn 100 millioner kroner i forvaltningskapital også oppgi beholdningen av put- og callopsjoner. Siden put-opsjoner generelt indikerer et negativt sentiment, og call-opsjoner indikerer et positivt sentiment, kan vi få et inntrykk av det generelle institusjonelle sentimentet ved å plotte forholdet mellom put- og call-opsjoner. Diagrammet til høyre viser det historiske forholdet mellom put- og call-opsjoner for dette instrumentet.
Ved å bruke Put/Call-forholdet som en indikator på investorsentimentet kan man overvinne en av de viktigste svakhetene ved å bruke totalt institusjonelt eierskap, nemlig at en betydelig andel av forvaltningskapitalen investeres passivt for å følge indekser. Passivt forvaltede fond kjøper vanligvis ikke opsjoner, slik at indikatoren for put/call-forhold i større grad gjenspeiler stemningen i aktivt forvaltede fond.
13F- og NPORT-arkiveringer
Detaljer om 13F-arkiveringer er gratis. Detaljer om NP-arkiveringer krever et premium-medlemskap. Grønne rader indikerer nye posisjoner. Røde rader indikerer lukkede posisjoner. Klikk på lenke ikonet for å se hele transaksjonshistorikken.
Oppgrader
for å låse opp premiedata og eksportere til Excel. ![]() .
.
| Fildato | Kilde | Investor | Type | Gjennomsnittlig pris (estimert) |
Aksjer | Δ Aksjer (%) |
Rapportert verdi ($1000) | Verdi (%) | Portallokering (%) | |
|---|---|---|---|---|---|---|---|---|---|---|
| 2025-08-13 | 13F | Renaissance Technologies Llc | 28 045 | 632 | ||||||
| 2025-08-07 | 13F | Kestra Private Wealth Services, Llc | 46 775 | 67,90 | 1 055 | 80,48 | ||||
| 2025-08-14 | 13F | Bank Of America Corp /de/ | 410 676 | −8,65 | 9 261 | −1,77 | ||||
| 2025-07-31 | 13F | Cambridge Investment Research Advisors, Inc. | 120 288 | 3,35 | 3 | 0,00 | ||||
| 2025-08-06 | 13F | Atlantic Union Bankshares Corp | 230 | 5 | ||||||
| 2025-08-04 | 13F | Integrity Alliance, Llc. | 18 674 | −0,19 | 421 | 7,40 | ||||
| 2025-08-11 | 13F | Private Advisor Group, LLC | 14 377 | 324 | ||||||
| 2025-08-14 | 13F | Jane Street Group, Llc | 17 057 | 385 | ||||||
| 2025-07-09 | 13F | Lifestyle Asset Management, Inc. | 14 372 | 324 | ||||||
| 2025-05-15 | 13F | Talon Private Wealth, LLC | 0 | −100,00 | 0 | −100,00 | ||||
| 2025-08-05 | 13F | Simplex Trading, Llc | 3 350 | 0 | ||||||
| 2025-05-09 | 13F | CoreCap Advisors, LLC | 0 | −100,00 | 0 | |||||
| 2025-07-17 | 13F | Janney Montgomery Scott LLC | 18 376 | −3,91 | 0 | |||||
| 2025-08-06 | 13F | AE Wealth Management LLC | 14 518 | 23,08 | 327 | 32,39 | ||||
| 2025-07-29 | 13F | International Assets Investment Management, Llc | 19 263 | −10,25 | 434 | −3,56 | ||||
| 2025-08-12 | 13F | Waterloo Capital, L.P. | 10 251 | 0,00 | 231 | 7,94 | ||||
| 2025-08-11 | 13F | Wealthspire Advisors, LLC | 23 804 | 1,04 | 537 | 8,50 | ||||
| 2025-05-16 | 13F/A | Kestra Investment Management, LLC | 0 | −100,00 | 0 | |||||
| 2025-05-15 | 13F | Gts Securities Llc | 0 | −100,00 | 0 | |||||
| 2025-08-11 | 13F | Principal Securities, Inc. | 87 453 | 2 387,99 | 1 972 | 2 638,89 | ||||
| 2025-08-14 | 13F | Qube Research & Technologies Ltd | 26 056 | −25,56 | 588 | −19,92 | ||||
| 2025-08-05 | 13F | GPS Wealth Strategies Group, LLC | 9 | 0,00 | 0 | |||||
| 2025-08-12 | 13F | Global Retirement Partners, LLC | 11 865 | 34,57 | 268 | 47,51 | ||||
| 2025-07-22 | 13F/A | Kingstone Capital Partners Texas, LLC | 10 899 | 2,01 | 246 | 9,82 | ||||
| 2025-08-14 | 13F | UBS Group AG | 54 948 | −86,16 | 1 239 | −85,11 | ||||
| 2025-08-28 | NP | BTSAX - BTS Managed Income Fund Class A Shares | 25 303 | 571 | ||||||
| 2025-07-18 | 13F | Truist Financial Corp | 0 | −100,00 | 0 | |||||
| 2025-04-29 | 13F | Wood Tarver Financial Group, LLC | 0 | −100,00 | 0 | |||||
| 2025-07-31 | 13F | Wealthfront Advisers Llc | 54 733 | 10,18 | 1 234 | 18,54 | ||||
| 2025-08-12 | 13F | Founders Financial Alliance, LLC | 19 717 | 3,93 | 445 | 11,84 | ||||
| 2025-07-25 | 13F | Cwm, Llc | 2 174 | 794,65 | 0 | |||||
| 2025-07-18 | 13F | PFG Investments, LLC | 24 146 | −0,15 | 544 | 7,30 | ||||
| 2025-07-21 | 13F | Crews Bank & Trust | 6 115 | 69,16 | 138 | 82,67 | ||||
| 2025-07-09 | 13F | Sterling Manor Financial, LLC | 14 333 | 323 | ||||||
| 2025-08-14 | 13F | Citadel Advisors Llc | Call | 0 | −100,00 | 0 | ||||
| 2025-08-14 | 13F | Citadel Advisors Llc | Put | 0 | −100,00 | 0 | ||||
| 2025-07-21 | 13F | Ameritas Advisory Services, LLC | 38 532 | 9,30 | 869 | 17,62 | ||||
| 2025-07-28 | 13F | Ckw Financial Group | 1 000 | 0,00 | 0 | |||||
| 2025-07-23 | 13F | Kingswood Wealth Advisors, Llc | 44 576 | 41,08 | 1 005 | 51,81 | ||||
| 2025-08-08 | 13F | SBI Securities Co., Ltd. | 44 841 | −0,29 | 1 011 | 7,21 | ||||
| 2025-08-14 | 13F | Raymond James Financial Inc | 81 692 | 2,99 | 1 842 | 10,76 | ||||
| 2025-08-08 | 13F | Financial Gravity Companies, Inc. | 666 | 0,00 | 15 | 15,38 | ||||
| 2025-08-08 | 13F | Cetera Investment Advisers | 103 842 | 18,89 | 2 342 | 27,85 | ||||
| 2025-08-04 | 13F | Kovack Advisors, Inc. | 15 562 | 20,77 | 351 | 29,63 | ||||
| 2025-08-08 | 13F | Fortis Group Advisors, LLC | 14 741 | 340 | ||||||
| 2025-08-08 | 13F | Advyzon Investment Management, LLC | 15 939 | −0,28 | 359 | 7,16 | ||||
| 2025-05-15 | 13F | Tower Research Capital LLC (TRC) | 0 | −100,00 | 0 | |||||
| 2025-08-14 | 13F/A | Rockefeller Capital Management L.P. | 23 428 | 3,12 | 528 | 10,92 | ||||
| 2025-07-10 | 13F | Signal Advisors Wealth, LLC | 528 346 | 723,03 | 11 914 | 785,14 | ||||
| 2025-07-09 | 13F | Triumph Capital Management | 41 074 | 1,22 | 926 | 8,94 | ||||
| 2025-08-13 | 13F | VestGen Advisors, LLC | 12 336 | 278 | ||||||
| 2025-07-08 | 13F | Parallel Advisors, LLC | 230 | 0,00 | 5 | 25,00 | ||||
| 2025-08-29 | 13F | Total Investment Management Inc | 1 506 | 34 | ||||||
| 2025-08-14 | 13F | Royal Bank Of Canada | 9 330 | 19,65 | 211 | 28,66 | ||||
| 2025-08-14 | 13F | Stifel Financial Corp | 14 316 | −2,77 | 323 | 4,55 | ||||
| 2025-08-19 | 13F | Newbridge Financial Services Group, Inc. | 129 172 | 4,19 | 2 913 | 12,04 | ||||
| 2025-08-08 | 13F | Pnc Financial Services Group, Inc. | 366 | 8 | ||||||
| 2025-08-18 | 13F | Geneos Wealth Management Inc. | 133 | 0,00 | 3 | 0,00 | ||||
| 2025-08-04 | 13F | Assetmark, Inc | 72 | 2 | ||||||
| 2025-08-12 | 13F | Jpmorgan Chase & Co | 86 471 | 10,58 | 1 950 | 18,91 | ||||
| 2025-09-04 | 13F/A | Advisor Group Holdings, Inc. | 200 139 | 12,36 | 4 515 | 20,82 | ||||
| 2025-07-10 | 13F | Wealth Enhancement Advisory Services, Llc | 87 521 | −0,24 | 2 002 | 8,81 | ||||
| 2025-08-05 | 13F | Strategic Financial Concepts, LLC | 52 265 | −2,43 | 1 179 | 4,90 | ||||
| 2025-08-14 | 13F | Wells Fargo & Company/mn | 149 778 | 15,17 | 3 377 | 23,84 | ||||
| 2025-05-05 | 13F | Hazlett, Burt & Watson, Inc. | 0 | −100,00 | 0 | |||||
| 2025-08-11 | 13F | Aptus Capital Advisors, LLC | 768 | 17 | ||||||
| 2025-07-22 | 13F | Foguth Wealth Management, LLC. | 536 276 | 735,39 | 12 093 | 798,44 | ||||
| 2025-08-04 | 13F | Spire Wealth Management | 0 | −100,00 | 0 | |||||
| 2025-08-11 | 13F | Tidemark, LLC | 0 | −100,00 | 0 | |||||
| 2025-08-12 | 13F | Proequities, Inc. | 0 | 0 | ||||||
| 2025-08-14 | 13F | Susquehanna International Group, Llp | Call | 29 300 | −42,88 | 661 | −38,60 | |||
| 2025-08-14 | 13F | Mariner, LLC | 9 558 | 216 | ||||||
| 2025-08-01 | 13F | Brookwood Investment Group LLC | 13 726 | 310 | ||||||
| 2025-08-13 | 13F | Northwestern Mutual Wealth Management Co | 23 010 | 106,29 | 519 | 122,32 | ||||
| 2025-08-14 | 13F | Sei Investments Co | 39 944 | 13,10 | 901 | 21,62 | ||||
| 2025-07-24 | 13F | IFP Advisors, Inc | 764 | 86,80 | 17 | 112,50 | ||||
| 2025-08-13 | 13F | Flow Traders U.s. Llc | 0 | −100,00 | 0 | |||||
| 2025-08-14 | 13F | Susquehanna International Group, Llp | Put | 9 200 | −14,81 | 207 | −8,41 | |||
| 2025-08-28 | NP | TFAFX - Tactical Growth Allocation Fund Class I | 2 646 | 60 | ||||||
| 2025-08-14 | 13F | Susquehanna International Group, Llp | 138 100 | 16,44 | 3 114 | 25,21 | ||||
| 2025-08-15 | 13F | Kestra Advisory Services, LLC | 22 805 | 82,57 | 514 | 96,93 | ||||
| 2025-07-17 | 13F | Fifth Third Securities, Inc. | 97 389 | −9,96 | 2 196 | −3,17 | ||||
| 2025-08-05 | 13F | Dunhill Financial, LLC | 1 683 | 38 | ||||||
| 2025-08-12 | 13F | Deutsche Bank Ag\ | 1 | 0 | ||||||
| 2025-07-16 | 13F | Strategic Investment Solutions, Inc. /IL | 150 | 3 | ||||||
| 2025-07-11 | 13F | Farther Finance Advisors, LLC | 3 063 | 2,07 | 69 | 9,52 | ||||
| 2025-04-25 | 13F | New Wave Wealth Advisors Llc | 0 | −100,00 | 0 | |||||
| 2025-07-30 | 13F | BTS Asset Management, Inc. | 26 802 | 604 | ||||||
| 2025-08-14 | 13F | Fmr Llc | 526 | 497,73 | 12 | 1 000,00 | ||||
| 2025-07-31 | 13F | Optimum Investment Advisors | 1 000 | 0,00 | 23 | 10,00 | ||||
| 2025-08-11 | 13F | HighTower Advisors, LLC | 25 247 | −0,30 | 569 | 7,16 | ||||
| 2025-08-12 | 13F | MAI Capital Management | 2 050 | 51 150,00 | 46 | |||||
| 2025-07-28 | 13F | Harbour Investments, Inc. | 5 474 | 0,00 | 123 | 7,89 | ||||
| 2025-08-14 | 13F | Comerica Bank | 178 | 20,27 | 4 | 33,33 | ||||
| 2025-08-06 | 13F | Commonwealth Equity Services, Llc | 38 070 | 35,53 | 1 | |||||
| 2025-08-18 | 13F/A | National Bank Of Canada /fi/ | 15 000 | 0,00 | 325 | 6,56 | ||||
| 2025-08-13 | 13F | SageView Advisory Group, LLC | 11 762 | −9,66 | 278 | 1,47 | ||||
| 2025-08-13 | 13F | M Holdings Securities, Inc. | 17 433 | 0 | ||||||
| 2025-07-08 | 13F | Goldstone Financial Group, LLC | 44 451 | −1,34 | 1 017 | 7,63 | ||||
| 2025-08-11 | 13F | Citigroup Inc | 400 | 0,00 | 9 | 12,50 | ||||
| 2025-08-14 | 13F | Mml Investors Services, Llc | 26 894 | 111,20 | 1 | |||||
| 2025-07-21 | 13F | Ameriflex Group, Inc. | 0 | −100,00 | 0 | |||||
| 2025-08-06 | 13F | Prospera Financial Services Inc | 23 242 | 14,07 | 524 | 22,72 | ||||
| 2025-08-11 | 13F | Western Wealth Management, LLC | 15 714 | −12,28 | 354 | −5,60 | ||||
| 2025-08-14 | 13F | GWM Advisors LLC | 75 791 | 7,48 | 1 709 | 15,63 | ||||
| 2025-08-05 | 13F | Westside Investment Management, Inc. | 1 000 | 0,00 | 23 | 10,00 | ||||
| 2025-07-29 | 13F | Private Trust Co Na | 1 166 | 0,00 | 26 | 8,33 | ||||
| 2025-08-14 | 13F | Ameriprise Financial Inc | 75 794 | 18,62 | 1 709 | 27,63 | ||||
| 2025-07-16 | 13F | ORG Partners LLC | 0 | −100,00 | 0 | |||||
| 2025-08-12 | 13F | LPL Financial LLC | 808 842 | 6,79 | 18 239 | 14,84 | ||||
| 2025-08-08 | 13F | Good Life Advisors, LLC | 18 263 | 3,76 | 412 | 11,38 | ||||
| 2025-08-01 | 13F | Howard Capital Management Inc. | 681 750 | 15 373 | ||||||
| 2025-07-21 | 13F | Synergy Financial Management, LLC | 87 496 | 1 973 | ||||||
| 2025-04-30 | 13F | Sofos Investments, Inc. | 666 | 0,00 | 14 | −7,14 | ||||
| 2025-07-18 | 13F | Bartlett & Co. Wealth Management Llc | 0 | −100,00 | 0 | |||||
| 2025-08-01 | 13F | Envestnet Asset Management Inc | 64 381 | 3,72 | 1 452 | 11,53 | ||||
| 2025-08-13 | 13F | Capital Analysts, Inc. | 266 | 0,00 | 0 | |||||
| 2025-07-25 | 13F | Atria Wealth Solutions, Inc. | 9 467 | −25,58 | 214 | −19,55 | ||||
| 2025-08-19 | 13F | Cape Investment Advisory, Inc. | 1 000 | 23 | ||||||
| 2025-05-12 | 13F | Sandy Spring Bank | 230 | 0,00 | 5 | 0,00 | ||||
| 2025-08-14 | 13F | Federation des caisses Desjardins du Quebec | 685 | −16,05 | 15 | −11,76 | ||||
| 2025-07-30 | NP | ORR - Militia Long/Short Equity ETF | Short | −432 409 | −9 310 | |||||
| 2025-07-08 | 13F | Nbc Securities, Inc. | 75 | 0,00 | 0 | |||||
| 2025-05-09 | 13F | GeoWealth Management, LLC | 0 | −100,00 | 0 | −100,00 | ||||
| 2025-07-21 | 13F | Mirae Asset Global Investments Co., Ltd. | 3 800 | 86 | ||||||
| 2025-05-14 | 13F | Gould Capital, LLC | 0 | −100,00 | 0 | |||||
| 2025-08-07 | 13F | Allworth Financial LP | 112 | 0,00 | 3 | 0,00 | ||||
| 2025-08-13 | 13F | Jones Financial Companies Lllp | 35 893 | 56,29 | 803 | 66,25 | ||||
| 2025-08-15 | 13F | Morgan Stanley | 580 719 | 1,80 | 13 095 | 9,48 |