Grunnleggende statistikk
| Institusjonelle eiere | 109 total, 109 long only, 0 short only, 0 long/short - change of 21,11% MRQ |
| Gjennomsnittlig porteføljeallokering | 0.2889 % - change of −24,41% MRQ |
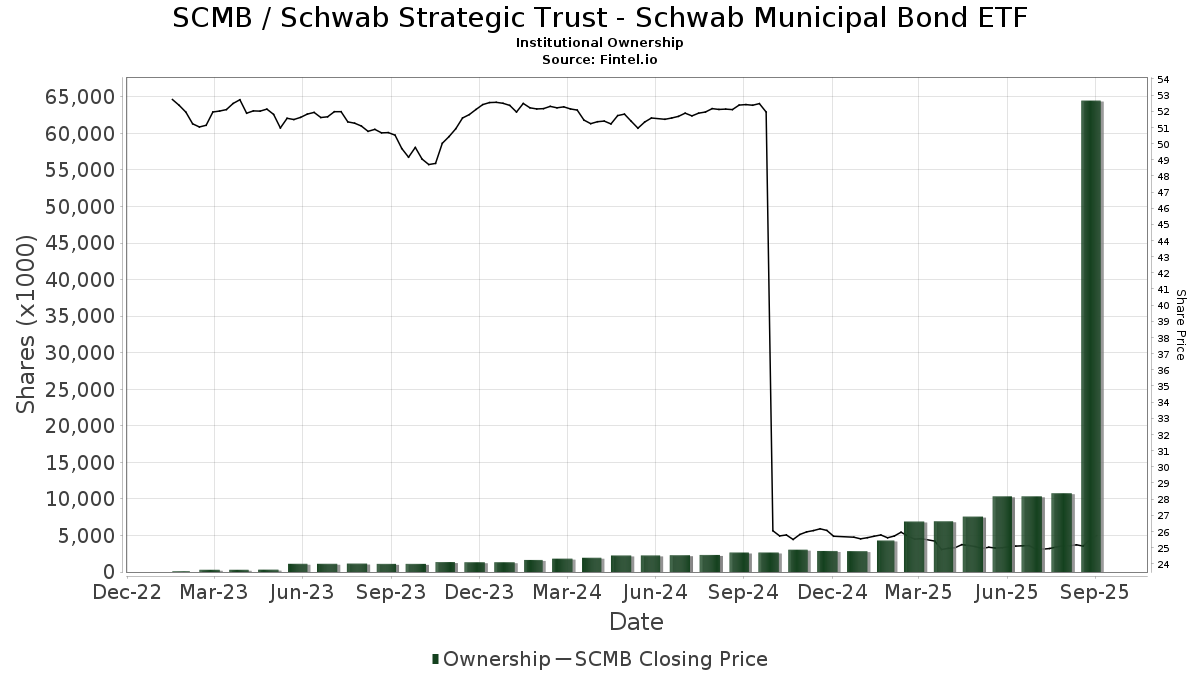
| Institusjonelle aksjer (Long) | 64 482 964 (ex 13D/G) - change of 54,13MM shares 522,99% MRQ |
| Institusjonell verdi (Long) | $ 1 614 862 USD ($1000) |
Institusjonelt eierskap og aksjonærer
Schwab Strategic Trust - Schwab Municipal Bond ETF (US:SCMB) har 109 institusjonelle eiere og aksjonærer som har sendt inn 13D/G- eller 13F-skjemaer til Securities Exchange Commission (SEC). Disse institusjonene eier til sammen 64,482,964 aksjer. De største aksjonærene inkluderer Charles Schwab Investment Management Inc, Jones Financial Companies Lllp, Fort Point Capital Partners LLC, Pallas Capital Advisors LLC, Charles Schwab Trust Co, Jane Street Group, Llc, Wedmont Private Capital, United Capital Financial Advisers, Llc, Bank Of America Corp /de/, and Envestnet Asset Management Inc .
Schwab Strategic Trust - Schwab Municipal Bond ETF (ARCA:SCMB) institusjonell eierstruktur viser nåværende posisjoner i selskapet fordelt på institusjoner og fond, samt de siste endringene i posisjonsstørrelse. De største aksjonærene kan være individuelle investorer, verdipapirfond, hedgefond eller institusjoner. Schedule 13D indikerer at investoren eier (eller har eid) mer enn 5 % av selskapet og har til hensikt (eller hadde til hensikt) å aktivt forfølge en endring i forretningsstrategien. Schedule 13G indikerer en passiv investering på over 5 %.
The share price as of September 9, 2025 is 25,42 / share. Previously, on September 10, 2024, the share price was 26,16 / share. This represents a decline of 2,85% over that period.
Fondssentiment-score
Fondssentiment Score (også kjent som akkumulering av eierskap poengsum) viser hvilke aksjer som er mest kjøpt av fond. Den er resultatet av en sofistikert, kvantitativ flerfaktormodell som identifiserer selskaper med de høyeste nivåene av institusjonell akkumulering. Beregningsmodellen for poeng bruker en kombinasjon av den totale økningen i antall offentliggjorte eiere, endringer i porteføljeallokeringen til disse eierne og andre beregninger. Tallet går fra 0 til 100, der høyere tall indikerer en høyere grad av akkumulering i forhold til sammenlignbare selskaper, der 50 er gjennomsnittet.
Oppdateringsfrekvens: Daglig
Sjekk ut Ownership Explorer, som inneholder en liste over de høyest rangerte selskapene.
Institusjonell Put/Call-forhold
I tillegg til å rapportere standard aksje- og gjeldsemisjoner må institusjoner med mer enn 100 millioner kroner i forvaltningskapital også oppgi beholdningen av put- og callopsjoner. Siden put-opsjoner generelt indikerer et negativt sentiment, og call-opsjoner indikerer et positivt sentiment, kan vi få et inntrykk av det generelle institusjonelle sentimentet ved å plotte forholdet mellom put- og call-opsjoner. Diagrammet til høyre viser det historiske forholdet mellom put- og call-opsjoner for dette instrumentet.
Ved å bruke Put/Call-forholdet som en indikator på investorsentimentet kan man overvinne en av de viktigste svakhetene ved å bruke totalt institusjonelt eierskap, nemlig at en betydelig andel av forvaltningskapitalen investeres passivt for å følge indekser. Passivt forvaltede fond kjøper vanligvis ikke opsjoner, slik at indikatoren for put/call-forhold i større grad gjenspeiler stemningen i aktivt forvaltede fond.
13F- og NPORT-arkiveringer
Detaljer om 13F-arkiveringer er gratis. Detaljer om NP-arkiveringer krever et premium-medlemskap. Grønne rader indikerer nye posisjoner. Røde rader indikerer lukkede posisjoner. Klikk på lenke ikonet for å se hele transaksjonshistorikken.
Oppgrader
for å låse opp premiedata og eksportere til Excel. ![]() .
.
| Fildato | Kilde | Investor | Type | Gjennomsnittlig pris (estimert) |
Aksjer | Δ Aksjer (%) |
Rapportert verdi ($1000) | Verdi (%) | Portallokering (%) | |
|---|---|---|---|---|---|---|---|---|---|---|
| 2025-08-11 | 13F | United Capital Financial Advisers, Llc | 462 276 | 164,93 | 11 640 | 162,99 | ||||
| 2025-08-14 | 13F | Goldman Sachs Group Inc | 0 | −100,00 | 0 | |||||
| 2025-08-14 | 13F | Mariner, LLC | 8 200 | 0,00 | 206 | −0,96 | ||||
| 2025-07-30 | 13F | VCI Wealth Management LLC | 15 982 | 3,26 | 402 | 2,55 | ||||
| 2025-07-23 | 13F | West Paces Advisors Inc. | 6 615 | −37,39 | 167 | −38,06 | ||||
| 2025-07-25 | 13F | Ackerman Capital Advisors, LLC | 69 482 | 1 750 | ||||||
| 2025-08-08 | 13F | Larson Financial Group LLC | 3 809 | 277,88 | 96 | 280,00 | ||||
| 2025-08-15 | 13F | Kestra Advisory Services, LLC | 31 904 | 7,41 | 803 | 6,64 | ||||
| 2025-08-19 | 13F | Anchor Investment Management, LLC | 0 | −100,00 | 0 | |||||
| 2025-07-17 | 13F | Halbert Hargrove Global Advisors, Llc | 700 | 18 | ||||||
| 2025-07-22 | 13F | Compass Financial Group, INC/SD | 23 036 | 2,40 | 580 | 1,75 | ||||
| 2025-08-14 | 13F | Quantinno Capital Management LP | 91 765 | 2 311 | ||||||
| 2025-08-12 | 13F | Charles Schwab Investment Management Inc | 52 643 707 | 4 409,67 | 1 325 569 | 4 376,00 | ||||
| 2025-07-24 | 13F | VanderPol Investments L.L.C. | 83 785 | −3,03 | 2 110 | −3,74 | ||||
| 2025-08-14 | 13F | Warren Averett Asset Management, LLC | 18 202 | 458 | ||||||
| 2025-08-15 | 13F | Captrust Financial Advisors | 55 477 | 43,36 | 1 397 | 42,30 | ||||
| 2025-07-18 | 13F | Northeast Financial Group, Inc. | 51 676 | 34,08 | 1 301 | 33,16 | ||||
| 2025-07-30 | 13F | Paul Damon & Associates, Inc. | 24 527 | 5,50 | 618 | 4,75 | ||||
| 2025-08-13 | 13F | Natixis Advisors, L.p. | 119 749 | 333,53 | 3 | |||||
| 2025-07-31 | 13F | Cambridge Investment Research Advisors, Inc. | 33 205 | 1 | ||||||
| 2025-04-23 | 13F | Carl Stuart Investment Advisor, Inc | 0 | −100,00 | 0 | |||||
| 2025-08-14 | 13F | Raymond James Financial Inc | 4 368 | 110 | ||||||
| 2025-07-09 | 13F | Breakwater Investment Management | 9 740 | 245 | ||||||
| 2025-07-31 | 13F | TSA Wealth Managment LLC | 52 747 | 85,70 | 1 328 | 84,44 | ||||
| 2025-08-08 | 13F | Cetera Investment Advisers | 44 660 | −24,20 | 1 125 | −24,77 | ||||
| 2025-08-12 | 13F | Putnam Fl Investment Management Co | 8 329 | −68,68 | 210 | −68,99 | ||||
| 2025-07-16 | 13F | Perigon Wealth Management, LLC | 179 898 | 8,92 | 4 530 | 8,09 | ||||
| 2025-08-14 | 13F | Bank Of America Corp /de/ | 453 989 | −1,14 | 11 431 | −1,88 | ||||
| 2025-08-14 | 13F | Coastal Bridge Advisors, LLC | 47 202 | −2,73 | 1 189 | −3,49 | ||||
| 2025-08-12 | 13F | Bedel Financial Consulting, Inc. | 10 513 | 5,64 | 265 | 6,02 | ||||
| 2025-08-15 | 13F | Morgan Stanley | 1 | 0 | ||||||
| 2025-07-08 | 13F | FF Advisors,LLC | 17 981 | 0,00 | 453 | 0,22 | ||||
| 2025-07-31 | 13F | CVA Family Office, LLC | 700 | −71,83 | 18 | −73,02 | ||||
| 2025-08-19 | 13F | National Asset Management, Inc. | 0 | −100,00 | 0 | |||||
| 2025-07-30 | 13F | Avidian Wealth Solutions, LLC | 77 355 | 1 948 | ||||||
| 2025-08-14 | 13F | Citadel Advisors Llc | 0 | −100,00 | 0 | |||||
| 2025-07-09 | 13F | Pallas Capital Advisors LLC | 755 515 | 12,89 | 19 024 | 12,04 | ||||
| 2025-09-04 | 13F/A | Advisor Group Holdings, Inc. | 34 249 | −11,94 | 862 | −12,58 | ||||
| 2025-07-22 | 13F | Rochester Wealth Strategies, LLC | 0 | −100,00 | 0 | |||||
| 2025-04-29 | 13F | Truist Financial Corp | 0 | −100,00 | 0 | |||||
| 2025-07-08 | 13F | Heartwood Wealth Advisors LLC | 9 243 | 233 | ||||||
| 2025-08-11 | 13F | Elequin Capital Lp | 100 000 | 2 518 | ||||||
| 2025-07-28 | NP | SPMFX - Symmetry Panoramic Municipal Fixed Income Fund Class I Shares | 154 000 | 0,00 | 3 856 | −3,53 | ||||
| 2025-08-14 | 13F | Mml Investors Services, Llc | 78 195 | 97,72 | 2 | 0,00 | ||||
| 2025-08-06 | 13F | Commonwealth Equity Services, Llc | 12 108 | 0 | ||||||
| 2025-08-26 | 13F/A | Thrivent Financial For Lutherans | 0 | −100,00 | 0 | |||||
| 2025-07-09 | 13F | Breakwater Capital Group | 8 194 | 206 | ||||||
| 2025-08-15 | 13F | Asset Allocation Strategies LLC | 10 609 | −4,65 | 267 | −5,32 | ||||
| 2025-08-04 | 13F | Grant Street Asset Management, Inc. | 15 776 | 0,71 | 397 | 0,00 | ||||
| 2025-08-14 | 13F | Jane Street Group, Llc | 522 022 | 143,51 | 13 145 | 141,71 | ||||
| 2025-08-11 | 13F | Aptus Capital Advisors, LLC | 205 | 0,00 | 5 | 0,00 | ||||
| 2025-07-15 | 13F | Garrett Investment Advisors LLC | 207 164 | −11,49 | 5 216 | −12,14 | ||||
| 2025-08-01 | 13F | Envestnet Asset Management Inc | 320 242 | 44,83 | 8 064 | 43,75 | ||||
| 2025-08-14 | 13F | Wells Fargo & Company/mn | 1 | 0 | ||||||
| 2025-08-12 | 13F | Howe & Rusling Inc | 8 174 | 206 | ||||||
| 2025-08-14 | 13F | Mercer Global Advisors Inc /adv | 25 812 | 0,19 | 650 | −0,61 | ||||
| 2025-07-16 | 13F | Vestia Personal Wealth Advisors | 18 728 | 472 | ||||||
| 2025-08-12 | 13F | Jpmorgan Chase & Co | 128 813 | 165,54 | 3 244 | 163,66 | ||||
| 2025-08-14 | 13F | Aqr Capital Management Llc | 58 755 | 1 479 | ||||||
| 2025-07-28 | 13F | Harbour Investments, Inc. | 9 252 | 101,48 | 233 | 100,00 | ||||
| 2025-07-24 | 13F | Galvin, Gaustad & Stein, LLC | 17 628 | 3,76 | 444 | 2,78 | ||||
| 2025-07-03 | 13F | Trinity Financial Advisors LLC | 0 | −100,00 | 0 | |||||
| 2025-08-11 | 13F | Root Financial Partners, LLC | 22 672 | 0,00 | 571 | −0,87 | ||||
| 2025-07-24 | 13F | IFP Advisors, Inc | 3 290 | 0,00 | 83 | −1,20 | ||||
| 2025-07-22 | 13F | Gemmer Asset Management LLC | 13 831 | 33,76 | 348 | 32,82 | ||||
| 2025-08-07 | 13F | Donaldson Capital Management, Llc | 41 887 | 0,00 | 1 055 | −0,75 | ||||
| 2025-07-11 | 13F | Myecfo, Llc | 145 160 | 9,34 | 3 659 | 9,03 | ||||
| 2025-07-17 | 13F | Charles Schwab Trust Co | 733 104 | 38,73 | 18 460 | 37,69 | ||||
| 2025-07-23 | 13F | Columbus Macro, LLC | 43 946 | −26,79 | 1 107 | −27,33 | ||||
| 2025-08-13 | 13F | Northwestern Mutual Wealth Management Co | 1 258 | 0,00 | 32 | 0,00 | ||||
| 2025-08-12 | 13F | Proequities, Inc. | 0 | 0 | ||||||
| 2025-07-21 | 13F | Pflug Koory, LLC | 12 | 0,00 | 0 | |||||
| 2025-07-22 | 13F | Red Tortoise LLC | 377 | −8,50 | 9 | −10,00 | ||||
| 2025-08-19 | 13F | Cape Investment Advisory, Inc. | 510 | 0,59 | 13 | 0,00 | ||||
| 2025-07-17 | 13F | Janney Montgomery Scott LLC | 75 000 | 15,38 | 2 | 0,00 | ||||
| 2025-04-29 | 13F | Element Wealth, LLC | 0 | −100,00 | 0 | |||||
| 2025-05-13 | 13F | EPG Wealth Management LLC | 0 | −100,00 | 0 | −100,00 | ||||
| 2025-08-13 | 13F | Continuum Advisory, LLC | 14 631 | 1 728,88 | 368 | 1 740,00 | ||||
| 2025-08-07 | 13F | Allworth Financial LP | 0 | −100,00 | 0 | |||||
| 2025-05-13 | 13F | UBS Group AG | 0 | −100,00 | 0 | |||||
| 2025-07-18 | 13F | O'ROURKE & COMPANY, Inc | 76 021 | −14,09 | 1 914 | −14,74 | ||||
| 2025-08-12 | 13F | CIBC Private Wealth Group, LLC | 6 000 | 0,00 | 151 | 2,03 | ||||
| 2025-07-17 | 13F | Legacy Wealth Management, Inc | 34 193 | 182,35 | 861 | 180,13 | ||||
| 2025-07-22 | 13F | Berger Financial Group, Inc | 20 644 | −15,94 | 520 | −16,69 | ||||
| 2025-08-08 | 13F | Capital Investment Advisory Services, LLC | 0 | −100,00 | 0 | |||||
| 2025-04-21 | 13F | Nelson, Van Denburg & Campbell Wealth Management Group, LLC | 0 | −100,00 | 0 | |||||
| 2025-08-13 | 13F | Smith, Moore & Co. | 44 860 | 1 130 | ||||||
| 2025-08-13 | 13F | Capital Analysts, Inc. | 3 874 | 38,80 | 0 | |||||
| 2025-08-08 | 13F | Francis Financial, Inc. | 42 671 | 1 074 | ||||||
| 2025-08-12 | 13F | Change Path, LLC | 16 337 | 33,35 | 411 | 32,58 | ||||
| 2025-08-14 | 13F | Susquehanna International Group, Llp | 0 | −100,00 | 0 | |||||
| 2025-08-06 | 13F | Adviser Investments LLC | 98 812 | −27,98 | 2 488 | −28,51 | ||||
| 2025-08-14 | 13F | Peapack Gladstone Financial Corp | 22 598 | 1 | ||||||
| 2025-07-21 | 13F | Investment Planning Advisors, Inc. | 62 039 | 11,85 | 1 562 | 11,02 | ||||
| 2025-08-13 | 13F | Jones Financial Companies Lllp | 2 950 244 | 14,40 | 74 258 | 13,61 | ||||
| 2025-07-23 | 13F | Pure Portfolios Holdings Llc | 87 748 | 481,69 | 2 209 | 478,27 | ||||
| 2025-08-14 | 13F | Fort Point Capital Partners LLC | 1 241 508 | 90,21 | 31 261 | 88,80 | ||||
| 2025-07-31 | 13F | CAP Partners, LLC | 14 554 | 8,18 | 366 | 7,33 | ||||
| 2025-07-14 | 13F | AdvisorNet Financial, Inc | 32 128 | 0,00 | 809 | −0,86 | ||||
| 2025-08-12 | 13F | Blueprint Financial Advisors LLC | 24 245 | 610 | ||||||
| 2025-08-08 | 13F | Emerald Investment Partners, Llc | 5 724 | 0,00 | 144 | −0,69 | ||||
| 2025-08-04 | 13F | Assetmark, Inc | 738 | 19 | ||||||
| 2025-08-12 | 13F | MAI Capital Management | 24 802 | 1,69 | 625 | 0,97 | ||||
| 2025-07-10 | 13F | Wealth Enhancement Advisory Services, Llc | 134 584 | 136,07 | 3 377 | 133,47 | ||||
| 2025-08-15 | 13F | Chapman Financial Group, Llc | 5 800 | 0,00 | 146 | −1,35 | ||||
| 2025-04-18 | 13F | Bell Bank | 0 | −100,00 | 0 | |||||
| 2025-07-21 | 13F | Ameritas Advisory Services, LLC | 5 530 | 139 | ||||||
| 2025-08-08 | 13F | Burling Wealth Partners, Llc | 8 625 | 217 | ||||||
| 2025-08-05 | 13F | Golden Bell Financial Planning LLC | 15 455 | 12,31 | 389 | 11,46 | ||||
| 2025-08-14 | 13F | Beaird Harris Wealth Management, LLC | 209 152 | −1,25 | 5 266 | −1,99 | ||||
| 2025-08-08 | 13F | Meridian Wealth Management, LLC | 57 392 | 0,10 | 1 445 | −0,62 | ||||
| 2025-08-08 | 13F | Altiora Financial Group, LLC | 20 000 | 0,00 | 504 | −0,79 | ||||
| 2025-08-14 | 13F | Royal Bank Of Canada | 130 722 | 3 292 | ||||||
| 2025-08-08 | 13F | Cornerstone Advisors Asset Management, Inc | 85 203 | 5,03 | 2 145 | 4,28 | ||||
| 2025-08-04 | 13F | Creative Financial Designs Inc /adv | 53 969 | −6,13 | 1 359 | −6,86 | ||||
| 2025-08-08 | 13F | Creative Planning | 34 647 | −2,54 | 872 | −3,22 | ||||
| 2025-08-06 | 13F | AE Wealth Management LLC | 672 | −30,72 | 17 | −33,33 | ||||
| 2025-07-10 | 13F | Wedmont Private Capital | 489 484 | −14,78 | 12 296 | −13,15 | ||||
| 2025-07-03 | 13F | Fiduciary Financial Group, Llc | 12 844 | −37,58 | 323 | −36,74 | ||||
| 2025-08-27 | 13F/A | Brinker Capital Investments, LLC | 10 689 | 269 | ||||||
| 2025-08-04 | 13F | Savvy Advisors, Inc. | 0 | −100,00 | 0 | |||||
| 2025-07-25 | 13F | Sequoia Financial Advisors, LLC | 14 791 | −19,88 | 372 | −20,51 | ||||
| 2025-08-14 | 13F | Great Valley Advisor Group, Inc. | 15 285 | 385 | ||||||
| 2025-08-15 | 13F | CI Private Wealth, LLC | 52 852 | 1 331 | ||||||
| 2025-04-28 | 13F | BCO Wealth Management LLC | 0 | −100,00 | 0 | |||||
| 2025-08-12 | 13F | LPL Financial LLC | 12 516 | 315 | ||||||
| 2025-07-31 | 13F | Resonant Capital Advisors, LLC | 41 046 | 13,36 | 1 034 | 12,53 | ||||
| 2025-08-13 | 13F | SageView Advisory Group, LLC | 9 940 | 248 | ||||||
| 2025-08-11 | 13F | HighTower Advisors, LLC | 10 083 | 254 | ||||||
| 2025-04-21 | 13F | LifeGoal Wealth Advisors | 0 | −100,00 | 0 |