Grunnleggende statistikk
| Institusjonelle eiere | 168 total, 168 long only, 0 short only, 0 long/short - change of −11,05% MRQ |
| Gjennomsnittlig porteføljeallokering | 0.1253 % - change of −16,27% MRQ |
| Institusjonelle aksjer (Long) | 10 435 096 (ex 13D/G) - change of −0,80MM shares −7,13% MRQ |
| Institusjonell verdi (Long) | $ 297 531 USD ($1000) |
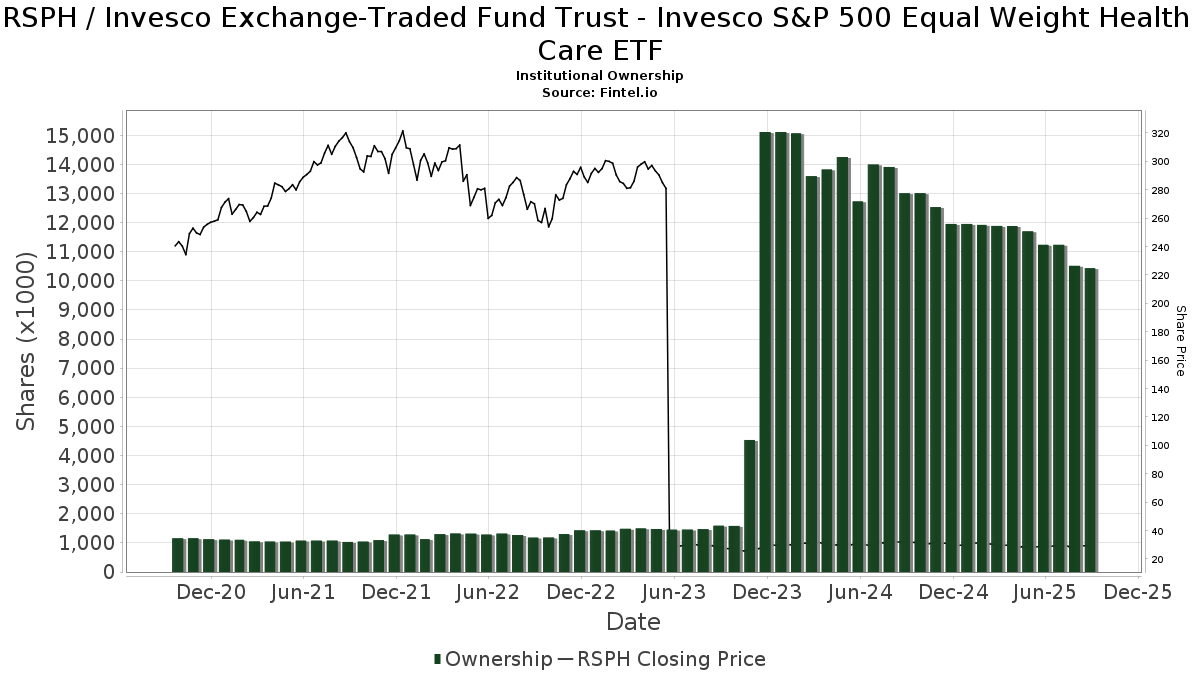
Institusjonelt eierskap og aksjonærer
Invesco Exchange-Traded Fund Trust - Invesco S&P 500 Equal Weight Health Care ETF (US:RSPH) har 168 institusjonelle eiere og aksjonærer som har sendt inn 13D/G- eller 13F-skjemaer til Securities Exchange Commission (SEC). Disse institusjonene eier til sammen 10,435,096 aksjer. De største aksjonærene inkluderer HighTower Advisors, LLC, Morgan Stanley, LPL Financial LLC, Walled Lake Planning & Wealth Management, Llc, Bank Of America Corp /de/, Royal Bank Of Canada, Raymond James Financial Inc, MAI Capital Management, Jpmorgan Chase & Co, and Federation des caisses Desjardins du Quebec .
Invesco Exchange-Traded Fund Trust - Invesco S&P 500 Equal Weight Health Care ETF (ARCA:RSPH) institusjonell eierstruktur viser nåværende posisjoner i selskapet fordelt på institusjoner og fond, samt de siste endringene i posisjonsstørrelse. De største aksjonærene kan være individuelle investorer, verdipapirfond, hedgefond eller institusjoner. Schedule 13D indikerer at investoren eier (eller har eid) mer enn 5 % av selskapet og har til hensikt (eller hadde til hensikt) å aktivt forfølge en endring i forretningsstrategien. Schedule 13G indikerer en passiv investering på over 5 %.
The share price as of September 11, 2025 is 29,60 / share. Previously, on September 11, 2024, the share price was 31,88 / share. This represents a decline of 7,15% over that period.
Fondssentiment-score
Fondssentiment Score (også kjent som akkumulering av eierskap poengsum) viser hvilke aksjer som er mest kjøpt av fond. Den er resultatet av en sofistikert, kvantitativ flerfaktormodell som identifiserer selskaper med de høyeste nivåene av institusjonell akkumulering. Beregningsmodellen for poeng bruker en kombinasjon av den totale økningen i antall offentliggjorte eiere, endringer i porteføljeallokeringen til disse eierne og andre beregninger. Tallet går fra 0 til 100, der høyere tall indikerer en høyere grad av akkumulering i forhold til sammenlignbare selskaper, der 50 er gjennomsnittet.
Oppdateringsfrekvens: Daglig
Sjekk ut Ownership Explorer, som inneholder en liste over de høyest rangerte selskapene.
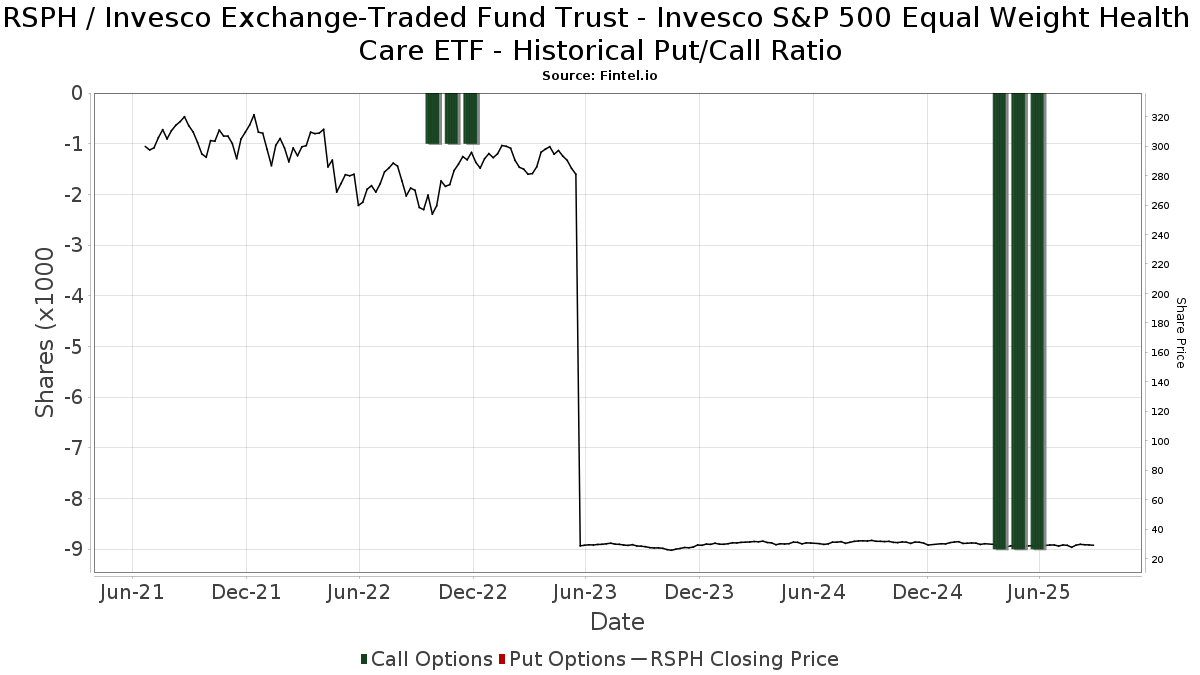
Institusjonell Put/Call-forhold
I tillegg til å rapportere standard aksje- og gjeldsemisjoner må institusjoner med mer enn 100 millioner kroner i forvaltningskapital også oppgi beholdningen av put- og callopsjoner. Siden put-opsjoner generelt indikerer et negativt sentiment, og call-opsjoner indikerer et positivt sentiment, kan vi få et inntrykk av det generelle institusjonelle sentimentet ved å plotte forholdet mellom put- og call-opsjoner. Diagrammet til høyre viser det historiske forholdet mellom put- og call-opsjoner for dette instrumentet.
Ved å bruke Put/Call-forholdet som en indikator på investorsentimentet kan man overvinne en av de viktigste svakhetene ved å bruke totalt institusjonelt eierskap, nemlig at en betydelig andel av forvaltningskapitalen investeres passivt for å følge indekser. Passivt forvaltede fond kjøper vanligvis ikke opsjoner, slik at indikatoren for put/call-forhold i større grad gjenspeiler stemningen i aktivt forvaltede fond.
13F- og NPORT-arkiveringer
Detaljer om 13F-arkiveringer er gratis. Detaljer om NP-arkiveringer krever et premium-medlemskap. Grønne rader indikerer nye posisjoner. Røde rader indikerer lukkede posisjoner. Klikk på lenke ikonet for å se hele transaksjonshistorikken.
Oppgrader
for å låse opp premiedata og eksportere til Excel. ![]() .
.
| Fildato | Kilde | Investor | Type | Gjennomsnittlig pris (estimert) |
Aksjer | Δ Aksjer (%) |
Rapportert verdi ($1000) | Verdi (%) | Portallokering (%) | |
|---|---|---|---|---|---|---|---|---|---|---|
| 2025-08-11 | 13F | HighTower Advisors, LLC | 2 246 103 | −7,13 | 65 541 | −8,91 | ||||
| 2025-07-23 | 13F | Country Club Bank /gfn | 7 500 | 0,00 | 218 | −1,81 | ||||
| 2025-08-14 | 13F | Boston Private Wealth Llc | 0 | −100,00 | 0 | |||||
| 2025-07-14 | 13F | CRA Financial Services, LLC | 17 106 | −8,65 | 499 | −10,41 | ||||
| 2025-08-11 | 13F | Aptus Capital Advisors, LLC | 104 | −38,46 | 3 | −40,00 | ||||
| 2025-09-11 | 13F | Silicon Valley Capital Partners | 101 | 0,00 | 3 | 0,00 | ||||
| 2025-05-15 | 13F | Hrt Financial Lp | 0 | −100,00 | 0 | |||||
| 2025-08-12 | 13F | Fca Corp /tx | 139 979 | 2,51 | 4 085 | 0,54 | ||||
| 2025-07-23 | 13F | Optas, LLC | 30 398 | −3,10 | 887 | −4,93 | ||||
| 2025-08-12 | 13F | Franklin Resources Inc | 900 | 0,00 | 26 | 0,00 | ||||
| 2025-08-12 | 13F | LPL Financial LLC | 450 503 | −2,93 | 13 146 | −4,79 | ||||
| 2025-08-14 | 13F | Comerica Bank | 2 100 | −39,85 | 61 | −40,78 | ||||
| 2025-07-10 | 13F | Exchange Traded Concepts, Llc | 1 001 | 29 | ||||||
| 2025-07-24 | 13F | Blair William & Co/il | 7 000 | 0,00 | 204 | −1,92 | ||||
| 2025-05-15 | 13F | Graham Capital Management, L.P. | 0 | −100,00 | 0 | |||||
| 2025-07-14 | 13F | AdvisorNet Financial, Inc | 3 660 | 0,00 | 107 | −1,85 | ||||
| 2025-08-12 | 13F | Financial Advocates Investment Management | 0 | −100,00 | 0 | −100,00 | ||||
| 2025-08-14 | 13F | Guardian Wealth Management, Inc. | 0 | −100,00 | 0 | |||||
| 2025-08-12 | 13F | Global Retirement Partners, LLC | 163 | 0,62 | 5 | 0,00 | ||||
| 2025-08-12 | 13F | O'shaughnessy Asset Management, Llc | 1 037 | 0,19 | 30 | 0,00 | ||||
| 2025-08-14 | 13F | Ausdal Financial Partners, Inc. | 59 345 | −3,14 | 1 732 | −4,99 | ||||
| 2025-08-12 | 13F | Stelac Advisory Services LLC | 70 061 | −1,49 | 2 045 | −3,31 | ||||
| 2025-07-22 | 13F | Valley National Advisers Inc | 3 020 | 0,00 | 0 | |||||
| 2025-08-14 | 13F | EP Wealth Advisors, Inc. | 6 400 | 15,94 | 187 | 13,41 | ||||
| 2025-08-04 | 13F | Crescent Sterling, Ltd. | 0 | −100,00 | 0 | |||||
| 2025-08-12 | 13F | MAI Capital Management | 329 368 | −1,99 | 9 611 | −3,87 | ||||
| 2025-08-14 | 13F | Wiley Bros.-aintree Capital, Llc | 26 357 | 0,73 | 769 | −0,52 | ||||
| 2025-08-15 | 13F | Equitable Holdings, Inc. | 8 550 | −29,80 | 249 | −31,22 | ||||
| 2025-05-09 | 13F | Comprehensive Financial Planning, Inc./PA | 0 | −100,00 | 0 | |||||
| 2025-08-13 | 13F | Beacon Pointe Advisors, LLC | 30 050 | 0,00 | 877 | −1,90 | ||||
| 2025-07-11 | 13F | SILVER OAK SECURITIES, Inc | 354 | 10 | ||||||
| 2025-07-31 | 13F | Hartford Financial Management Inc. | 62 366 | −3,36 | 1 820 | −5,21 | ||||
| 2025-08-08 | 13F | Hartland & Co., LLC | 17 945 | −38,86 | 524 | −40,09 | ||||
| 2025-08-14 | 13F | Fmr Llc | 17 112 | −21,40 | 499 | −22,87 | ||||
| 2025-08-11 | 13F | Citigroup Inc | 1 936 | 56 | ||||||
| 2025-08-12 | 13F | Walled Lake Planning & Wealth Management, Llc | 407 726 | 5,29 | 11 897 | 3,27 | ||||
| 2025-08-06 | 13F | Legacy Bridge, LLC | 5 210 | 0,00 | 152 | −1,30 | ||||
| 2025-08-07 | 13F | Runnymede Capital Advisors, Inc. | 0 | −100,00 | 0 | |||||
| 2025-07-15 | 13F | North Star Investment Management Corp. | 0 | −100,00 | 0 | |||||
| 2025-04-30 | 13F | Sofos Investments, Inc. | 266 | 322,22 | 8 | 600,00 | ||||
| 2025-08-12 | 13F | Atlas Capital Advisors Llc | 14 567 | 0,01 | 425 | −1,85 | ||||
| 2025-04-29 | 13F | Lee Danner & Bass Inc | 0 | −100,00 | 0 | |||||
| 2025-08-13 | 13F | Gateway Wealth Partners, LLC | 7 529 | 0,03 | 220 | −1,79 | ||||
| 2025-08-18 | 13F | Hollencrest Capital Management | 1 420 | 0,00 | 41 | −2,38 | ||||
| 2025-08-12 | 13F | Proequities, Inc. | 0 | 0 | ||||||
| 2025-07-24 | 13F | IFP Advisors, Inc | 3 250 | 0,00 | 95 | −2,08 | ||||
| 2025-08-05 | 13F | Wakefield Asset Management LLLP | 0 | −100,00 | 0 | |||||
| 2025-07-18 | 13F | Cooper Financial Group | 11 492 | 0,00 | 335 | −1,76 | ||||
| 2025-07-29 | 13F | Empirical Asset Management, LLC | 29 780 | −3,56 | 869 | −5,45 | ||||
| 2025-07-22 | 13F | Yoder Wealth Management, Inc. | 66 595 | 9,83 | 1 943 | 7,76 | ||||
| 2025-08-14 | 13F | Bank Of America Corp /de/ | 401 689 | −11,13 | 11 721 | −12,84 | ||||
| 2025-07-21 | 13F | Kennebec Savings Bank | 0 | −100,00 | 0 | |||||
| 2025-08-18 | 13F/A | National Bank Of Canada /fi/ | 5 295 | 0,00 | 155 | −1,91 | ||||
| 2025-08-13 | 13F | Northwestern Mutual Wealth Management Co | 5 032 | −4,46 | 147 | −6,41 | ||||
| 2025-08-11 | 13F | Principal Securities, Inc. | 13 998 | −2,96 | 408 | −3,32 | ||||
| 2025-08-13 | 13F | Continuum Advisory, LLC | 0 | −100,00 | 0 | |||||
| 2025-08-14 | 13F | Quantinno Capital Management LP | 15 200 | −4,81 | 444 | −6,74 | ||||
| 2025-08-08 | 13F | Cetera Investment Advisers | 110 709 | 12,18 | 3 230 | 10,05 | ||||
| 2025-08-13 | 13F | Cerity Partners LLC | 9 124 | −0,86 | 266 | −2,56 | ||||
| 2025-08-14 | 13F | Federation des caisses Desjardins du Quebec | 295 294 | 7,46 | 8 617 | 5,39 | ||||
| 2025-08-08 | 13F | Avalon Trust Co | 1 000 | 0,00 | 29 | 0,00 | ||||
| 2025-08-15 | 13F | First Heartland Consultants, Inc. | 25 025 | −2,82 | 730 | −4,70 | ||||
| 2025-05-15 | 13F | TFG Advisers LLC | 0 | −100,00 | 0 | |||||
| 2025-04-29 | 13F | Financial Network Wealth Management LLC | 840 | 0 | ||||||
| 2025-07-11 | 13F | Farther Finance Advisors, LLC | 123 776 | 1,71 | 3 612 | 0,98 | ||||
| 2025-08-14 | 13F | Susquehanna International Group, Llp | 20 052 | 50,63 | 585 | 47,73 | ||||
| 2025-07-15 | 13F | McAdam, LLC | 57 520 | −4,06 | 1 678 | −5,89 | ||||
| 2025-07-24 | 13F | Live Oak Investment Partners | 8 241 | 0,00 | 240 | −2,04 | ||||
| 2025-08-13 | 13F | Lido Advisors, LLC | 32 002 | −4,41 | 934 | −6,33 | ||||
| 2025-07-28 | 13F | Pettinga Financial Advisors, LLC | 53 129 | 88,17 | 1 550 | 84,74 | ||||
| 2025-08-12 | 13F | CIBC Private Wealth Group, LLC | 713 | 0,00 | 21 | 5,26 | ||||
| 2025-07-08 | 13F | Nbc Securities, Inc. | 500 | 0,00 | 0 | |||||
| 2025-04-23 | 13F | Sylvest Advisors, LLC | 0 | −100,00 | 0 | |||||
| 2025-08-11 | 13F | Rothschild Investment Llc | 700 | 0,00 | 20 | 0,00 | ||||
| 2025-08-11 | 13F | Pin Oak Investment Advisors Inc | 500 | 0,00 | 0 | |||||
| 2025-08-08 | 13F | Atlantic Trust, LLC | 1 250 | 0,00 | 36 | −2,70 | ||||
| 2025-07-25 | 13F | Envestnet Portfolio Solutions, Inc. | 0 | −100,00 | 0 | |||||
| 2025-08-01 | 13F | Envestnet Asset Management Inc | 41 637 | 6,89 | 1 215 | 4,84 | ||||
| 2025-05-08 | 13F | Empirical Financial Services, LLC d.b.a. Empirical Wealth Management | 0 | −100,00 | 0 | |||||
| 2025-08-12 | 13F | Jpmorgan Chase & Co | 327 886 | 98,99 | 9 568 | 95,17 | ||||
| 2025-08-04 | 13F | Kovack Advisors, Inc. | 17 954 | −2,02 | 524 | −4,04 | ||||
| 2025-07-29 | 13F | Private Trust Co Na | 5 183 | −70,13 | 151 | −70,74 | ||||
| 2025-07-18 | 13F | Truist Financial Corp | 0 | −100,00 | 0 | |||||
| 2025-08-06 | 13F | AE Wealth Management LLC | 977 | 3,83 | 29 | 3,70 | ||||
| 2025-07-21 | 13F | DHJJ Financial Advisors, Ltd. | 14 816 | 0,01 | 432 | −1,82 | ||||
| 2025-07-31 | 13F | Blue Sky Capital Consultants Group, Inc. | 25 725 | −5,36 | 751 | −7,18 | ||||
| 2025-07-10 | 13F | Focus Financial Network, Inc. | 122 087 | 2,15 | 3 562 | 0,20 | ||||
| 2025-08-13 | 13F | Jones Financial Companies Lllp | 43 100 | 25,13 | 1 252 | 22,99 | ||||
| 2025-08-15 | 13F | Kestra Advisory Services, LLC | 13 786 | −9,36 | 402 | −11,06 | ||||
| 2025-08-15 | 13F | CI Private Wealth, LLC | 23 743 | 0,06 | 693 | −1,84 | ||||
| 2025-08-08 | 13F | Avantax Advisory Services, Inc. | 12 508 | 8,93 | 365 | 6,74 | ||||
| 2025-07-15 | 13F | Mather Group, Llc. | 0 | −100,00 | 0 | |||||
| 2025-08-13 | 13F | Measured Wealth Private Client Group, LLC | 0 | −100,00 | 0 | |||||
| 2025-05-14 | 13F | Jane Street Group, Llc | 0 | −100,00 | 0 | |||||
| 2025-05-15 | 13F | Two Sigma Investments, Lp | 0 | −100,00 | 0 | |||||
| 2025-05-15 | 13F | Blue Chip Partners, Inc. | 0 | −100,00 | 0 | −100,00 | ||||
| 2025-08-28 | 13F/A | Lavaca Capital Llc | 1 100 | 0,00 | 32 | 0,00 | ||||
| 2025-08-01 | 13F | Belvedere Trading LLC | Call | 9 100 | 266 | |||||
| 2025-07-30 | 13F | Cornerstone Advisory, LLC | 78 813 | −1,12 | 2 300 | 3,23 | ||||
| 2025-08-19 | 13F | Asset Dedication, LLC | 17 685 | 0,00 | 516 | −1,90 | ||||
| 2025-07-29 | 13F | Koshinski Asset Management, Inc. | 12 705 | 0,01 | 371 | −1,86 | ||||
| 2025-08-12 | 13F | Howe & Rusling Inc | 125 | 0,00 | 4 | 0,00 | ||||
| 2025-08-13 | 13F | Rsm Us Wealth Management Llc | 22 780 | 0,00 | 665 | −1,92 | ||||
| 2025-08-14 | 13F | Great Valley Advisor Group, Inc. | 29 187 | −1,31 | 852 | −3,30 | ||||
| 2025-05-16 | 13F | Laidlaw Wealth Management LLC | 0 | −100,00 | 0 | |||||
| 2025-08-14 | 13F | GWM Advisors LLC | 5 285 | −30,71 | 154 | −31,86 | ||||
| 2025-05-13 | 13F | Shorepoint Capital Partners LLC | 10 200 | 0,00 | 303 | 1,68 | ||||
| 2025-07-29 | 13F | Harbor Asset Planning, Inc. | 19 251 | 562 | ||||||
| 2025-08-05 | 13F | Dunhill Financial, LLC | 34 | 0,00 | 1 | −100,00 | ||||
| 2025-08-07 | 13F | Cahill Financial Advisors Inc | 75 175 | 0,14 | 2 194 | −1,79 | ||||
| 2025-07-10 | 13F | Wealth Enhancement Advisory Services, Llc | 44 831 | −19,46 | 1 310 | −20,89 | ||||
| 2025-07-15 | 13F | Yarbrough Capital, LLC | 0 | −100,00 | 0 | |||||
| 2025-08-11 | 13F | Private Advisor Group, LLC | 28 414 | −61,82 | 829 | −62,56 | ||||
| 2025-08-07 | 13F | Flagship Wealth Advisors, Llc | 150 | 0,00 | 4 | 0,00 | ||||
| 2025-08-14 | 13F | Bnp Paribas Arbitrage, Sa | 2 422 | 0,00 | 71 | −2,78 | ||||
| 2025-08-14 | 13F/A | Rockefeller Capital Management L.P. | 15 198 | −42,56 | 443 | −43,71 | ||||
| 2025-08-05 | 13F | Scarborough Advisors, LLC | 323 | 9 | ||||||
| 2025-07-23 | 13F | Peak Financial Management, Inc. | 68 031 | −7,40 | 1 985 | −9,15 | ||||
| 2025-05-19 | 13F/A | Trinity Financial Advisors LLC | 0 | −100,00 | 0 | −100,00 | ||||
| 2025-07-23 | 13F | Friedenthal Financial | 109 934 | 5,34 | 3 208 | 3,32 | ||||
| 2025-07-21 | 13F | Ameriflex Group, Inc. | 0 | −100,00 | 0 | |||||
| 2025-07-16 | 13F | Fortune Financial Advisors, LLC | 0 | −100,00 | 0 | |||||
| 2025-08-08 | 13F | Creative Planning | 118 098 | 23,77 | 3 446 | 21,42 | ||||
| 2025-08-14 | 13F | Goldman Sachs Group Inc | 39 781 | 110,56 | 1 161 | 106,41 | ||||
| 2025-08-01 | 13F | Zhang Financial LLC | 0 | −100,00 | 0 | |||||
| 2025-08-12 | 13F | Steward Partners Investment Advisory, Llc | 1 650 | −78,29 | 48 | −78,76 | ||||
| 2025-08-07 | 13F/A | Joseph Group Capital Management | 3 269 | 0,28 | 95 | −1,04 | ||||
| 2025-08-14 | 13F | UBS Group AG | 136 569 | 35,81 | 3 985 | 33,23 | ||||
| 2025-08-06 | 13F | Commonwealth Equity Services, Llc | 114 840 | −7,52 | 3 | 0,00 | ||||
| 2025-08-12 | 13F | One Charles Private Wealth Services, LLC | 8 980 | 0,00 | 262 | −1,87 | ||||
| 2025-08-07 | 13F | Resources Investment Advisors, LLC. | 10 568 | −2,13 | 308 | −4,05 | ||||
| 2025-08-07 | 13F | Montag A & Associates Inc | 1 662 | −39,08 | 48 | −40,74 | ||||
| 2025-07-01 | 13F | Harbor Investment Advisory, Llc | 5 300 | 0,00 | 155 | −1,91 | ||||
| 2025-08-14 | 13F | Financial Advisory Service, Inc. | 0 | −100,00 | 0 | |||||
| 2025-07-22 | 13F | Berger Financial Group, Inc | 75 710 | −19,60 | 2 209 | −21,14 | ||||
| 2025-08-15 | 13F | Morgan Stanley | 785 996 | 11,16 | 22 935 | 9,03 | ||||
| 2025-08-12 | 13F | AlphaCore Capital LLC | 1 049 | 486,03 | 31 | 500,00 | ||||
| 2025-08-05 | 13F | Sensible Money, LLC | 21 825 | 0,00 | 637 | −2,00 | ||||
| 2025-08-14 | 13F | Wells Fargo & Company/mn | 217 128 | −16,15 | 6 336 | −17,76 | ||||
| 2025-08-14 | 13F | CoreCap Advisors, LLC | 1 540 | 0,00 | 45 | −2,22 | ||||
| 2025-08-18 | 13F | Pacific Center for Financial Services | 701 | 0,29 | 20 | 0,00 | ||||
| 2025-07-17 | 13F | Wagner Wealth Management, Llc | 8 337 | 0,19 | 243 | −1,62 | ||||
| 2025-08-14 | 13F | Acorn Wealth Advisors, LLC | 39 855 | −37,86 | 1 163 | −39,10 | ||||
| 2025-08-07 | 13F | Parkside Financial Bank & Trust | 4 930 | 0,00 | 144 | −2,05 | ||||
| 2025-04-17 | 13F | Pacific Sun Financial Corp | 0 | −100,00 | 0 | |||||
| 2025-08-04 | 13F | Assetmark, Inc | 1 080 | 0,00 | 32 | −3,12 | ||||
| 2025-07-31 | 13F | Cambridge Investment Research Advisors, Inc. | 44 819 | −5,65 | 1 | 0,00 | ||||
| 2025-07-21 | 13F | Rainey & Randall Investment Management Inc. | 102 175 | −85,69 | 2 981 | −85,97 | ||||
| 2025-04-22 | 13F | Jfs Wealth Advisors, Llc | 0 | −100,00 | 0 | −100,00 | ||||
| 2025-07-14 | 13F | UMA Financial Services, Inc. | 130 | 0,00 | 4 | 0,00 | ||||
| 2025-08-14 | 13F | IHT Wealth Management, LLC | 10 446 | −22,66 | 305 | −24,19 | ||||
| 2025-08-05 | 13F | GPS Wealth Strategies Group, LLC | 720 | 0,00 | 21 | 0,00 | ||||
| 2025-08-07 | 13F | PCG Wealth Advisors, LLC | 0 | −100,00 | 0 | |||||
| 2025-07-16 | 13F | Signaturefd, Llc | 1 087 | 0,00 | 32 | −3,12 | ||||
| 2025-08-14 | 13F | LM Advisors LLC | 34 471 | 0,00 | 1 | 0,00 | ||||
| 2025-08-14 | 13F | Raymond James Financial Inc | 347 520 | −2,23 | 10 141 | −4,10 | ||||
| 2025-08-05 | 13F | Bank Of Montreal /can/ | 176 582 | 0,47 | 5 153 | −1,45 | ||||
| 2025-07-30 | 13F | Bogart Wealth, LLC | 5 727 | 0,16 | 167 | −1,76 | ||||
| 2025-08-14 | 13F | Hilltop Holdings Inc. | 13 350 | −1,29 | 390 | −3,23 | ||||
| 2025-05-06 | 13F | Proficio Capital Partners LLC | 0 | −100,00 | 0 | −100,00 | ||||
| 2025-08-07 | 13F | Allworth Financial LP | 24 001 | 0,16 | 700 | 3,55 | ||||
| 2025-08-11 | 13F | United Capital Financial Advisers, Llc | 8 000 | 0,00 | 233 | −2,10 | ||||
| 2025-07-30 | 13F | Avidian Wealth Solutions, LLC | 15 640 | 0,00 | 456 | −1,94 | ||||
| 2025-07-18 | 13F | Eagle Capital Management, LLC | 0 | −100,00 | 0 | |||||
| 2025-07-22 | 13F/A | Red Mountain Financial, LLC | 32 029 | −12,24 | 935 | −13,92 | ||||
| 2025-08-14 | 13F | Mercer Global Advisors Inc /adv | 53 713 | 308,71 | 1 567 | 301,79 | ||||
| 2025-08-19 | 13F | Advisory Services Network, LLC | 10 854 | 10,17 | 303 | 3,41 | ||||
| 2025-07-17 | 13F | Walker Asset Management, LLC | 41 282 | 2,34 | 1 205 | 0,33 | ||||
| 2025-07-22 | 13F | DAVENPORT & Co LLC | 14 669 | −2,82 | 428 | −4,68 | ||||
| 2025-07-24 | 13F | Us Bancorp \de\ | 920 | 0,00 | 27 | −3,70 | ||||
| 2025-09-04 | 13F/A | Advisor Group Holdings, Inc. | 137 564 | 4,27 | 4 014 | 2,27 | ||||
| 2025-08-11 | 13F | Ironsides Asset Advisors, LLC | 37 628 | −0,99 | 1 098 | −2,92 | ||||
| 2025-08-12 | 13F | Bank OZK | 7 800 | 0,00 | 228 | −2,16 | ||||
| 2025-07-07 | 13F | Global Wealth Strategies & Associates | 0 | −100,00 | 0 | |||||
| 2025-08-14 | 13F | Mariner, LLC | 21 523 | 9,23 | 628 | 7,17 | ||||
| 2025-08-04 | 13F | Joseph P. Lucia & Associates, LLC | 117 495 | −3,65 | 3 429 | −5,49 | ||||
| 2025-08-14 | 13F | Allred Capital Management, LLC | 0 | −100,00 | 0 | |||||
| 2025-07-11 | 13F | Kapstone Financial Advisors LLC | 0 | −100,00 | 0 | |||||
| 2025-07-31 | 13F | Oppenheimer & Co Inc | 34 642 | −4,02 | 1 011 | −5,87 | ||||
| 2025-07-29 | 13F | Socha Financial Group, LLC | 8 020 | −53,45 | 234 | −54,30 | ||||
| 2025-07-30 | 13F | Eqis Capital Management, Inc. | 16 522 | −1,54 | 482 | −3,41 | ||||
| 2025-07-11 | 13F | Seacrest Wealth Management, Llc | 0 | −100,00 | 0 | |||||
| 2025-08-11 | 13F | Cascade Wealth Advisors, Inc | 0 | −100,00 | 0 | |||||
| 2025-07-18 | 13F | SOA Wealth Advisors, LLC. | 4 555 | 0,20 | 133 | −2,22 | ||||
| 2025-08-18 | 13F | Geneos Wealth Management Inc. | 13 269 | −7,16 | 387 | −8,94 | ||||
| 2025-08-01 | 13F | Biltmore Family Office, LLC | 37 200 | 0,00 | 1 085 | −1,90 | ||||
| 2025-08-11 | 13F | HHM Wealth Advisors, LLC | 21 645 | 0,00 | 632 | −1,87 | ||||
| 2025-08-14 | 13F | Seven Mile Advisory | 7 000 | 0,00 | 204 | −1,92 | ||||
| 2025-04-29 | 13F | Hm Payson & Co | 0 | −100,00 | 0 | |||||
| 2025-08-13 | 13F | StoneX Group Inc. | 10 119 | 1,18 | 295 | −0,67 | ||||
| 2025-08-14 | 13F | D. E. Shaw & Co., Inc. | 0 | −100,00 | 0 | |||||
| 2025-08-18 | 13F | Front Row Advisors LLC | 550 | 0,00 | 16 | 0,00 | ||||
| 2025-07-16 | 13F/A | CX Institutional | 534 | −79,35 | 0 | |||||
| 2025-08-06 | 13F | North Capital, Inc. | 1 080 | 0,00 | 32 | −3,12 | ||||
| 2025-08-08 | 13F | Financial Gravity Companies, Inc. | 93 | −65,43 | 3 | −71,43 | ||||
| 2025-08-13 | 13F | Green Harvest Asset Management LLC | 129 776 | −1,50 | 3 787 | −3,39 | ||||
| 2025-07-30 | 13F | LGT Financial Advisors LLC | 0 | −100,00 | 0 | |||||
| 2025-08-14 | 13F | Mml Investors Services, Llc | 7 249 | −0,43 | 0 | |||||
| 2025-08-14 | 13F | Citadel Advisors Llc | 69 916 | 584,04 | 2 040 | 571,05 | ||||
| 2025-07-14 | 13F | U.S. Capital Wealth Advisors, LLC | 40 020 | 0,00 | 1 168 | −1,93 | ||||
| 2025-08-14 | 13F | Ameriprise Financial Inc | 124 805 | −12,04 | 3 642 | −13,74 | ||||
| 2025-07-11 | 13F/A | Umb Bank N A/mo | 29 000 | 0,00 | 846 | −1,86 | ||||
| 2025-08-14 | 13F | Royal Bank Of Canada | 355 421 | 2,52 | 10 371 | 0,56 | ||||
| 2025-07-25 | 13F | Cwm, Llc | 2 210 | −12,30 | 0 | |||||
| 2025-07-08 | 13F | Parallel Advisors, LLC | 190 | 0,00 | 6 | 0,00 | ||||
| 2025-07-29 | 13F | Ballast, Inc. | 117 495 | 3 429 | ||||||
| 2025-07-31 | 13F | Perissos Private Wealth Management, LLC | 12 477 | 0,02 | 364 | −1,89 | ||||
| 2025-07-14 | 13F | Occidental Asset Management, LLC | 6 898 | −6,76 | 201 | −8,64 | ||||
| 2025-08-14 | 13F | Stifel Financial Corp | 14 115 | −5,24 | 412 | −7,22 | ||||
| 2025-07-28 | 13F | Harbour Investments, Inc. | 3 412 | 0,09 | 100 | −1,98 | ||||
| 2025-05-08 | 13F | Natixis Advisors, L.p. | 0 | −100,00 | 0 | |||||
| 2025-08-05 | 13F | Huntington National Bank | 314 | −15,82 | ||||||
| 2025-08-14 | 13F | Coastal Bridge Advisors, LLC | 20 035 | −1,77 | 585 | −3,63 | ||||
| 2025-07-17 | 13F | Janney Montgomery Scott LLC | 26 847 | 0,22 | 1 |