Grunnleggende statistikk
| Institusjonelle eiere | 85 total, 85 long only, 0 short only, 0 long/short - change of −3,33% MRQ |
| Gjennomsnittlig porteføljeallokering | 0.1769 % - change of −15,80% MRQ |
| Institusjonelle aksjer (Long) | 2 424 838 (ex 13D/G) - change of −0,38MM shares −13,45% MRQ |
| Institusjonell verdi (Long) | $ 90 468 USD ($1000) |
Institusjonelt eierskap og aksjonærer
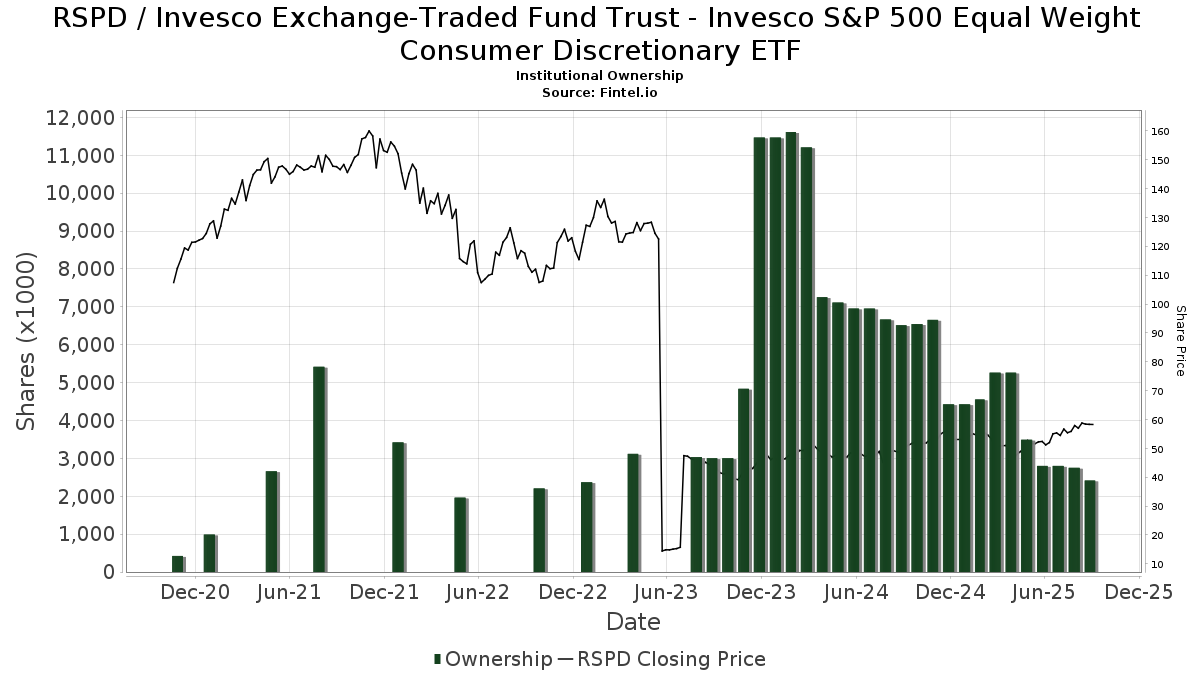
Invesco Exchange-Traded Fund Trust - Invesco S&P 500 Equal Weight Consumer Discretionary ETF (US:RSPD) har 85 institusjonelle eiere og aksjonærer som har sendt inn 13D/G- eller 13F-skjemaer til Securities Exchange Commission (SEC). Disse institusjonene eier til sammen 2,424,838 aksjer. De største aksjonærene inkluderer Harel Insurance Investments & Financial Services Ltd., Raymond James Financial Inc, Strategic Wealth Partners, Ltd., HighTower Advisors, LLC, Legend Financial Advisors, Inc., LPL Financial LLC, Royal Bank Of Canada, Wells Fargo & Company/mn, Park Avenue Securities Llc, and Bank Of America Corp /de/ .
Invesco Exchange-Traded Fund Trust - Invesco S&P 500 Equal Weight Consumer Discretionary ETF (ARCA:RSPD) institusjonell eierstruktur viser nåværende posisjoner i selskapet fordelt på institusjoner og fond, samt de siste endringene i posisjonsstørrelse. De største aksjonærene kan være individuelle investorer, verdipapirfond, hedgefond eller institusjoner. Schedule 13D indikerer at investoren eier (eller har eid) mer enn 5 % av selskapet og har til hensikt (eller hadde til hensikt) å aktivt forfølge en endring i forretningsstrategien. Schedule 13G indikerer en passiv investering på over 5 %.
The share price as of September 10, 2025 is 58,31 / share. Previously, on September 11, 2024, the share price was 48,51 / share. This represents an increase of 20,21% over that period.
Fondssentiment-score
Fondssentiment Score (også kjent som akkumulering av eierskap poengsum) viser hvilke aksjer som er mest kjøpt av fond. Den er resultatet av en sofistikert, kvantitativ flerfaktormodell som identifiserer selskaper med de høyeste nivåene av institusjonell akkumulering. Beregningsmodellen for poeng bruker en kombinasjon av den totale økningen i antall offentliggjorte eiere, endringer i porteføljeallokeringen til disse eierne og andre beregninger. Tallet går fra 0 til 100, der høyere tall indikerer en høyere grad av akkumulering i forhold til sammenlignbare selskaper, der 50 er gjennomsnittet.
Oppdateringsfrekvens: Daglig
Sjekk ut Ownership Explorer, som inneholder en liste over de høyest rangerte selskapene.
Institusjonell Put/Call-forhold
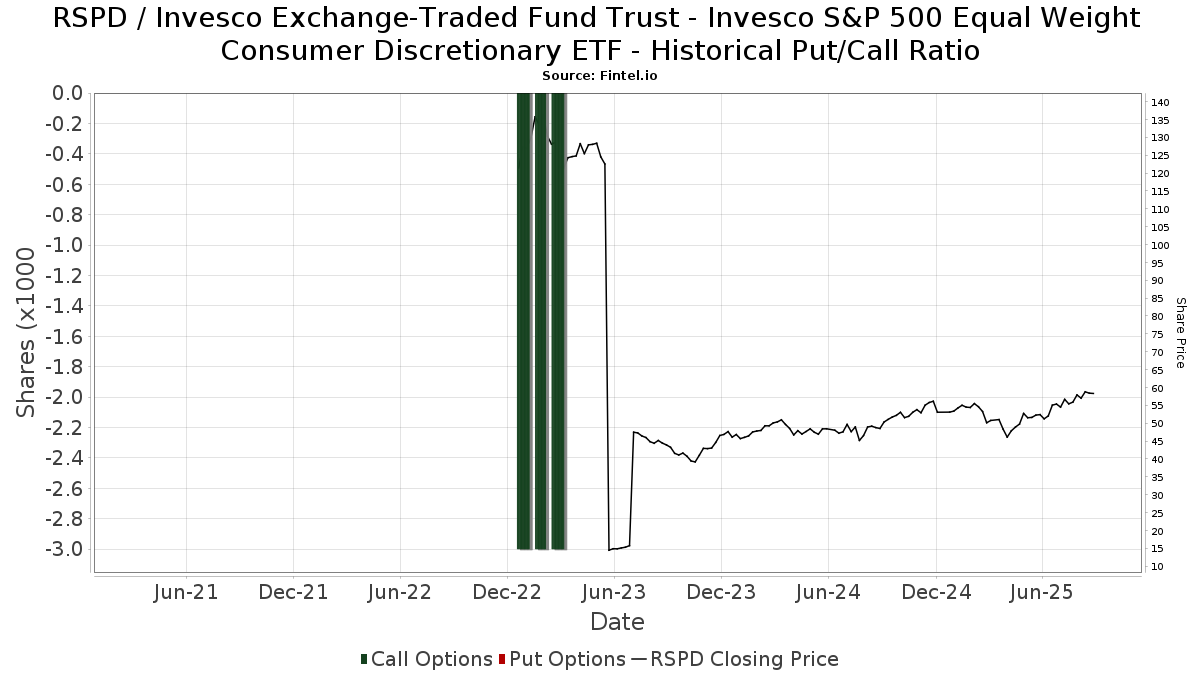
I tillegg til å rapportere standard aksje- og gjeldsemisjoner må institusjoner med mer enn 100 millioner kroner i forvaltningskapital også oppgi beholdningen av put- og callopsjoner. Siden put-opsjoner generelt indikerer et negativt sentiment, og call-opsjoner indikerer et positivt sentiment, kan vi få et inntrykk av det generelle institusjonelle sentimentet ved å plotte forholdet mellom put- og call-opsjoner. Diagrammet til høyre viser det historiske forholdet mellom put- og call-opsjoner for dette instrumentet.
Ved å bruke Put/Call-forholdet som en indikator på investorsentimentet kan man overvinne en av de viktigste svakhetene ved å bruke totalt institusjonelt eierskap, nemlig at en betydelig andel av forvaltningskapitalen investeres passivt for å følge indekser. Passivt forvaltede fond kjøper vanligvis ikke opsjoner, slik at indikatoren for put/call-forhold i større grad gjenspeiler stemningen i aktivt forvaltede fond.
13F- og NPORT-arkiveringer
Detaljer om 13F-arkiveringer er gratis. Detaljer om NP-arkiveringer krever et premium-medlemskap. Grønne rader indikerer nye posisjoner. Røde rader indikerer lukkede posisjoner. Klikk på lenke ikonet for å se hele transaksjonshistorikken.
Oppgrader
for å låse opp premiedata og eksportere til Excel. ![]() .
.
| Fildato | Kilde | Investor | Type | Gjennomsnittlig pris (estimert) |
Aksjer | Δ Aksjer (%) |
Rapportert verdi ($1000) | Verdi (%) | Portallokering (%) | |
|---|---|---|---|---|---|---|---|---|---|---|
| 2025-08-13 | 13F | Scotia Capital Inc. | 51 552 | 21,36 | 2 743 | 29,45 | ||||
| 2025-08-14 | 13F | Great Valley Advisor Group, Inc. | 6 487 | 0,06 | 345 | 6,50 | ||||
| 2025-08-05 | 13F | Harel Insurance Investments & Financial Services Ltd. | 645 873 | 27,31 | 34 | 36,00 | ||||
| 2025-07-29 | 13F | Tradewinds Capital Management, LLC | 3 306 | 0,39 | 176 | 6,71 | ||||
| 2025-08-11 | 13F | Strategic Wealth Partners, Ltd. | 134 724 | 4,73 | 7 169 | 1,01 | ||||
| 2025-08-06 | 13F | Hallmark Capital Management Inc | 0 | −100,00 | 0 | |||||
| 2025-08-11 | 13F | HighTower Advisors, LLC | 129 828 | −1,60 | 6 908 | 4,94 | ||||
| 2025-08-14 | 13F | Bnp Paribas Arbitrage, Sa | 10 000 | 532 | ||||||
| 2025-08-08 | 13F | Financial Gravity Companies, Inc. | 123 | −12,14 | 7 | −14,29 | ||||
| 2025-08-14 | 13F | Comerica Bank | 891 | 0,00 | 47 | 6,82 | ||||
| 2025-08-12 | 13F | LPL Financial LLC | 109 305 | −12,50 | 5 816 | −6,69 | ||||
| 2025-08-26 | NP | LCR - Leuthold Core ETF | 22 137 | 2,55 | 1 178 | 9,29 | ||||
| 2025-05-12 | 13F | Independent Advisor Alliance | 0 | −100,00 | 0 | |||||
| 2025-07-16 | 13F/A | CX Institutional | 100 | −3,85 | 0 | |||||
| 2025-08-06 | 13F | Richard Bernstein Advisors LLC | 826 | −50,89 | 44 | −48,19 | ||||
| 2025-07-28 | 13F | Kiker Wealth Management, LLC | 0 | −100,00 | 0 | |||||
| 2025-08-11 | 13F | Private Advisor Group, LLC | 15 772 | −24,62 | 839 | −19,64 | ||||
| 2025-08-12 | 13F | O'shaughnessy Asset Management, Llc | 109 | −33,13 | 6 | −37,50 | ||||
| 2025-07-31 | 13F | Brian Low Financial Group, Llc | 12 533 | 667 | ||||||
| 2025-05-09 | 13F | Connable Office Inc | 0 | −100,00 | 0 | |||||
| 2025-08-14 | 13F | Goldman Sachs Group Inc | 37 914 | −23,41 | 2 017 | −18,34 | ||||
| 2025-07-23 | 13F | Friedenthal Financial | 26 306 | 2,66 | 1 400 | 9,47 | ||||
| 2025-08-07 | 13F/A | Joseph Group Capital Management | 0 | −100,00 | 0 | |||||
| 2025-08-12 | 13F | Steward Partners Investment Advisory, Llc | 166 | 0,61 | 9 | 0,00 | ||||
| 2025-05-15 | 13F | Glenmede Trust Co Na | 1 350 | 0,00 | 67 | −6,94 | ||||
| 2025-07-08 | 13F | Legacy Private Trust Co. | 31 476 | −10,86 | 1 675 | −4,94 | ||||
| 2025-07-22 | 13F | Valley National Advisers Inc | 245 | 0,00 | 0 | |||||
| 2025-08-06 | 13F | Commonwealth Equity Services, Llc | 4 889 | −5,14 | 0 | |||||
| 2025-08-14 | 13F | UBS Group AG | 36 626 | −23,94 | 1 949 | −18,90 | ||||
| 2025-08-14 | 13F | Susquehanna International Group, Llp | 0 | −100,00 | 0 | |||||
| 2025-08-12 | 13F | TCTC Holdings, LLC | 231 | 0,00 | 12 | 9,09 | ||||
| 2025-08-14 | 13F | Vista Investment Management | 31 698 | −0,25 | 1 687 | 6,37 | ||||
| 2025-08-14 | 13F | CoreCap Advisors, LLC | 6 689 | −97,81 | 356 | −97,67 | ||||
| 2025-08-12 | 13F | Proequities, Inc. | 0 | 0 | ||||||
| 2025-08-08 | 13F | Hartland & Co., LLC | 540 | 0,00 | 29 | 7,69 | ||||
| 2025-08-12 | 13F | AlphaCore Capital LLC | 90 | 0,00 | 5 | 0,00 | ||||
| 2025-07-14 | 13F | ABLE Financial Group, LLC | 0 | −100,00 | 0 | |||||
| 2025-08-15 | 13F | Tower Research Capital LLC (TRC) | 1 900 | −65,35 | 101 | −63,00 | ||||
| 2025-05-15 | 13F | Hilltop Holdings Inc. | 0 | −100,00 | 0 | |||||
| 2025-08-14 | 13F | Bank Of America Corp /de/ | 57 956 | 10,81 | 3 084 | 18,17 | ||||
| 2025-08-14 | 13F | Quantinno Capital Management LP | 6 733 | 358 | ||||||
| 2025-08-14 | 13F | Wells Fargo & Company/mn | 96 472 | −17,77 | 5 133 | −12,32 | ||||
| 2025-07-08 | 13F | Davis Investment Partners, LLC | 28 049 | −13,26 | 1 531 | 0,33 | ||||
| 2025-08-14 | 13F | GWM Advisors LLC | 6 006 | −93,16 | 320 | −92,72 | ||||
| 2025-07-22 | 13F | Yoder Wealth Management, Inc. | 32 451 | 7,80 | 1 727 | 14,91 | ||||
| 2025-08-13 | 13F | Northwestern Mutual Wealth Management Co | 92 | 0,00 | 5 | 0,00 | ||||
| 2025-08-18 | 13F/A | National Bank Of Canada /fi/ | 339 | −59,11 | 18 | −56,10 | ||||
| 2025-07-15 | 13F | MCF Advisors LLC | 141 | 0,00 | 8 | 0,00 | ||||
| 2025-07-11 | 13F | Farther Finance Advisors, LLC | 56 195 | −0,66 | 2 990 | 5,32 | ||||
| 2025-07-29 | 13F | Empirical Asset Management, LLC | 5 116 | −5,43 | 272 | 1,12 | ||||
| 2025-09-04 | 13F/A | Advisor Group Holdings, Inc. | 3 194 | −0,22 | 170 | 6,92 | ||||
| 2025-04-22 | 13F | Cambridge Investment Research Advisors, Inc. | 0 | −100,00 | 0 | |||||
| 2025-04-30 | 13F | Sofos Investments, Inc. | 140 | 366,67 | 7 | 500,00 | ||||
| 2025-08-13 | 13F | Lido Advisors, LLC | 10 302 | −5,23 | 548 | 1,11 | ||||
| 2025-08-14 | 13F | Royal Bank Of Canada | 100 667 | 346,95 | 5 357 | 376,60 | ||||
| 2025-07-16 | 13F | Legend Financial Advisors, Inc. | 128 526 | 0,38 | 6 839 | 7,03 | ||||
| 2025-05-14 | 13F | Flow Traders U.s. Llc | 0 | −100,00 | 0 | |||||
| 2025-08-01 | 13F | Envestnet Asset Management Inc | 6 350 | −62,35 | 338 | −59,93 | ||||
| 2025-04-09 | 13F | Worth Asset Management, LLC | 0 | −100,00 | 0 | −100,00 | ||||
| 2025-04-21 | 13F | Nelson, Van Denburg & Campbell Wealth Management Group, LLC | 0 | −100,00 | 0 | |||||
| 2025-07-14 | 13F | Park Avenue Securities Llc | 68 498 | 4 | ||||||
| 2025-04-28 | 13F | Strategic Financial Concepts, LLC | 0 | −100,00 | 0 | −100,00 | ||||
| 2025-08-12 | 13F | CIBC Private Wealth Group, LLC | 0 | −100,00 | 0 | −100,00 | ||||
| 2025-05-12 | 13F | Waterloo Capital, L.P. | 0 | −100,00 | 0 | |||||
| 2025-08-07 | 13F | Allworth Financial LP | 602 | 0,33 | 32 | 10,34 | ||||
| 2025-08-07 | 13F | Strategy Asset Managers Llc | 0 | −100,00 | 0 | |||||
| 2025-08-14 | 13F | Raymond James Financial Inc | 142 153 | 9,40 | 7 564 | 16,66 | ||||
| 2025-07-24 | 13F | Trust Co Of Toledo Na /oh/ | 17 | 1 | ||||||
| 2025-08-05 | 13F | Bank Of Montreal /can/ | 1 895 | 0,00 | 101 | 6,38 | ||||
| 2025-08-13 | 13F | Leuthold Group, Llc | 23 805 | 2,67 | 1 267 | 9,52 | ||||
| 2025-08-14 | 13F | Smartleaf Asset Management LLC | 0 | −100,00 | 0 | |||||
| 2025-03-21 | 13F | Prostatis Group LLC | 0 | −100,00 | 0 | |||||
| 2025-08-14 | 13F | Fmr Llc | 271 | −0,37 | 14 | 7,69 | ||||
| 2025-08-15 | 13F | Morgan Stanley | 40 514 | −1,27 | 2 156 | 5,28 | ||||
| 2025-08-19 | 13F | Advisory Services Network, LLC | 10 931 | 0,00 | 601 | 10,28 | ||||
| 2025-08-12 | 13F | Global Retirement Partners, LLC | 2 674 | 0,07 | 142 | 0,00 | ||||
| 2025-07-24 | 13F | Us Bancorp \de\ | 507 | −14,93 | 27 | −10,34 | ||||
| 2025-07-29 | 13F | Private Trust Co Na | 3 072 | −26,06 | 163 | −21,26 | ||||
| 2025-08-05 | 13F | Simplex Trading, Llc | 214 | 21 300,00 | 0 | |||||
| 2025-05-13 | 13F | Adams Wealth Management | 0 | −100,00 | 0 | |||||
| 2025-08-12 | 13F | Jpmorgan Chase & Co | 52 165 | −0,05 | 2 776 | 6,57 | ||||
| 2025-08-04 | 13F | Joseph P. Lucia & Associates, LLC | 24 048 | −1,29 | 1 280 | 5,27 | ||||
| 2025-04-25 | NP | SRGAX - Stringer Growth Fund Class A Shares | 8 446 | −19,91 | 459 | −70,60 | ||||
| 2025-08-14 | 13F | Warren Averett Asset Management, LLC | 3 922 | 209 | ||||||
| 2025-07-31 | 13F | Brinker Capital Investments, LLC | 0 | −100,00 | 0 | −100,00 | ||||
| 2025-07-30 | 13F | Eqis Capital Management, Inc. | 8 599 | −2,32 | 458 | 4,10 | ||||
| 2025-07-31 | 13F | Carnegie Capital Asset Management, LLC | 29 352 | −4,38 | 1 562 | 12,55 | ||||
| 2025-04-15 | 13F | Collier Financial | 2 737 | 0,00 | 137 | −6,85 | ||||
| 2025-08-04 | 13F | Pinnacle Associates Ltd | 23 715 | −1,25 | 1 262 | 5,26 | ||||
| 2025-08-13 | 13F | Jones Financial Companies Lllp | 2 915 | 40,82 | 155 | 50,98 | ||||
| 2025-08-15 | 13F | CI Private Wealth, LLC | 5 143 | 0,00 | 274 | 6,64 | ||||
| 2025-04-17 | 13F | Janney Montgomery Scott LLC | 0 | −100,00 | 0 | |||||
| 2025-07-17 | 13F | Walker Asset Management, LLC | 20 083 | −3,68 | 1 069 | 2,69 | ||||
| 2025-08-18 | 13F | Front Row Advisors LLC | 225 | 0,00 | 12 | 0,00 | ||||
| 2025-07-17 | 13F | Sound Income Strategies, LLC | 10 | 0,00 | 1 | |||||
| 2025-08-05 | 13F | Fourth Dimension Wealth, LLC | 105 | 0,00 | 6 | 0,00 | ||||
| 2025-08-14 | 13F | Sunbelt Securities, Inc. | 111 | 6 | ||||||
| 2025-07-08 | 13F | Madison Park Capital Advisors, LLC | 9 267 | −51,15 | 493 | −47,89 | ||||
| 2025-04-25 | 13F | Verity Asset Management, Inc. | 0 | −100,00 | 0 | |||||
| 2025-08-13 | 13F | Green Harvest Asset Management LLC | 9 521 | −8,53 | 507 | −2,50 | ||||
| 2025-08-14 | 13F | Stifel Financial Corp | 4 356 | −7,14 | 232 | −1,28 | ||||
| 2025-08-01 | 13F | James Investment Research Inc | 4 454 | −4,93 | 237 | 1,29 | ||||
| 2025-07-29 | 13F | Ballast, Inc. | 24 048 | 1 280 | ||||||
| 2025-07-07 | 13F | Thurston, Springer, Miller, Herd & Titak, Inc. | 270 | 0,00 | 14 | 7,69 | ||||
| 2025-04-09 | 13F | Nbc Securities, Inc. | 0 | −100,00 | 0 | |||||
| 2025-05-15 | 13F | Blue Chip Partners, Inc. | 0 | −100,00 | 0 | |||||
| 2025-08-14 | 13F | Glenmede Investment Management, LP | 1 350 | 72 | ||||||
| 2025-05-13 | 13F | CacheTech Inc. | 0 | −100,00 | 0 | |||||
| 2025-08-07 | 13F | Winthrop Capital Management, LLC | 5 694 | −89,65 | 0 | −100,00 | ||||
| 2025-08-08 | 13F | Gts Securities Llc | 0 | −100,00 | 0 | |||||
| 2025-08-14 | 13F | Citadel Advisors Llc | 21 132 | −32,88 | 1 124 | −28,45 | ||||
| 2025-08-05 | 13F | Huntington National Bank | 5 | −42,86 | ||||||
| 2025-08-14 | 13F | Ameriprise Financial Inc | 5 602 | −74,41 | 298 | −72,74 |