Grunnleggende statistikk
| Institusjonelle eiere | 144 total, 144 long only, 0 short only, 0 long/short - change of 2,86% MRQ |
| Gjennomsnittlig porteføljeallokering | 0.3730 % - change of 5,45% MRQ |
| Institusjonelle aksjer (Long) | 10 690 937 (ex 13D/G) - change of −0,05MM shares −0,45% MRQ |
| Institusjonell verdi (Long) | $ 709 241 USD ($1000) |
Institusjonelt eierskap og aksjonærer
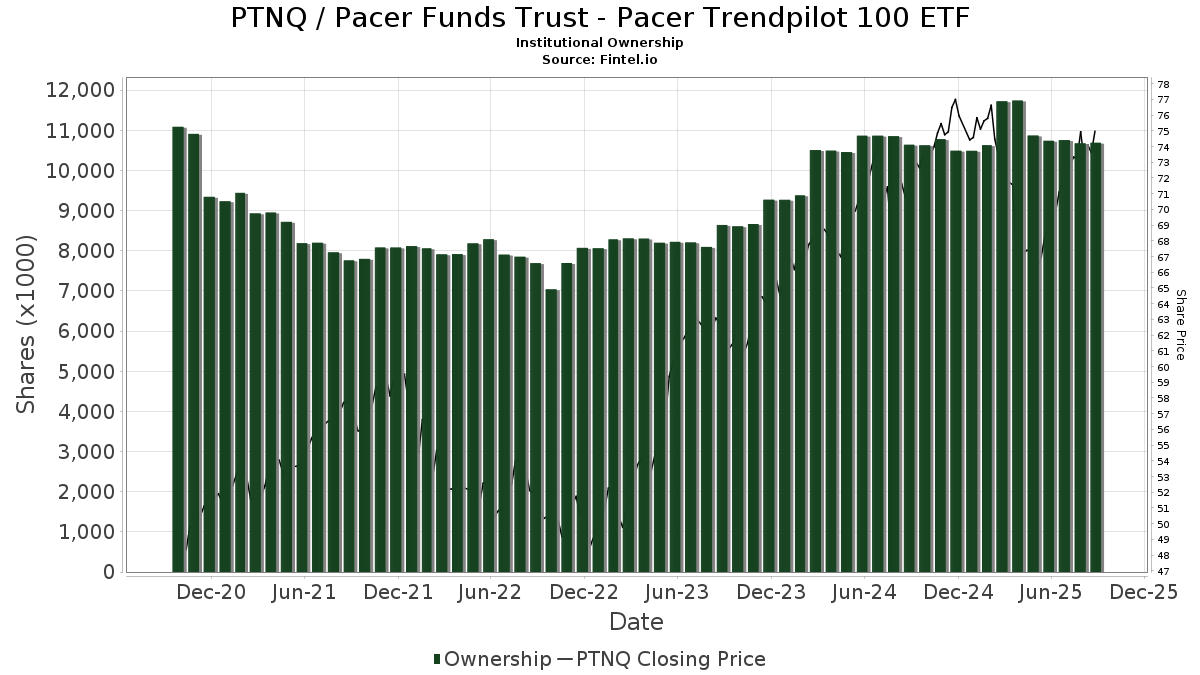
Pacer Funds Trust - Pacer Trendpilot 100 ETF (US:PTNQ) har 144 institusjonelle eiere og aksjonærer som har sendt inn 13D/G- eller 13F-skjemaer til Securities Exchange Commission (SEC). Disse institusjonene eier til sammen 10,690,937 aksjer. De største aksjonærene inkluderer LPL Financial LLC, Morgan Stanley, Bank Of America Corp /de/, Raymond James Financial Inc, Wells Fargo & Company/mn, Cetera Investment Advisers, Cambridge Investment Research Advisors, Inc., Avantax Advisory Services, Inc., UBS Group AG, and ODonnell Financial Services, LLC .
Pacer Funds Trust - Pacer Trendpilot 100 ETF (NasdaqGM:PTNQ) institusjonell eierstruktur viser nåværende posisjoner i selskapet fordelt på institusjoner og fond, samt de siste endringene i posisjonsstørrelse. De største aksjonærene kan være individuelle investorer, verdipapirfond, hedgefond eller institusjoner. Schedule 13D indikerer at investoren eier (eller har eid) mer enn 5 % av selskapet og har til hensikt (eller hadde til hensikt) å aktivt forfølge en endring i forretningsstrategien. Schedule 13G indikerer en passiv investering på over 5 %.
The share price as of September 12, 2025 is 75,76 / share. Previously, on September 13, 2024, the share price was 72,08 / share. This represents an increase of 5,10% over that period.
Fondssentiment-score
Fondssentiment Score (også kjent som akkumulering av eierskap poengsum) viser hvilke aksjer som er mest kjøpt av fond. Den er resultatet av en sofistikert, kvantitativ flerfaktormodell som identifiserer selskaper med de høyeste nivåene av institusjonell akkumulering. Beregningsmodellen for poeng bruker en kombinasjon av den totale økningen i antall offentliggjorte eiere, endringer i porteføljeallokeringen til disse eierne og andre beregninger. Tallet går fra 0 til 100, der høyere tall indikerer en høyere grad av akkumulering i forhold til sammenlignbare selskaper, der 50 er gjennomsnittet.
Oppdateringsfrekvens: Daglig
Sjekk ut Ownership Explorer, som inneholder en liste over de høyest rangerte selskapene.
Institusjonell Put/Call-forhold
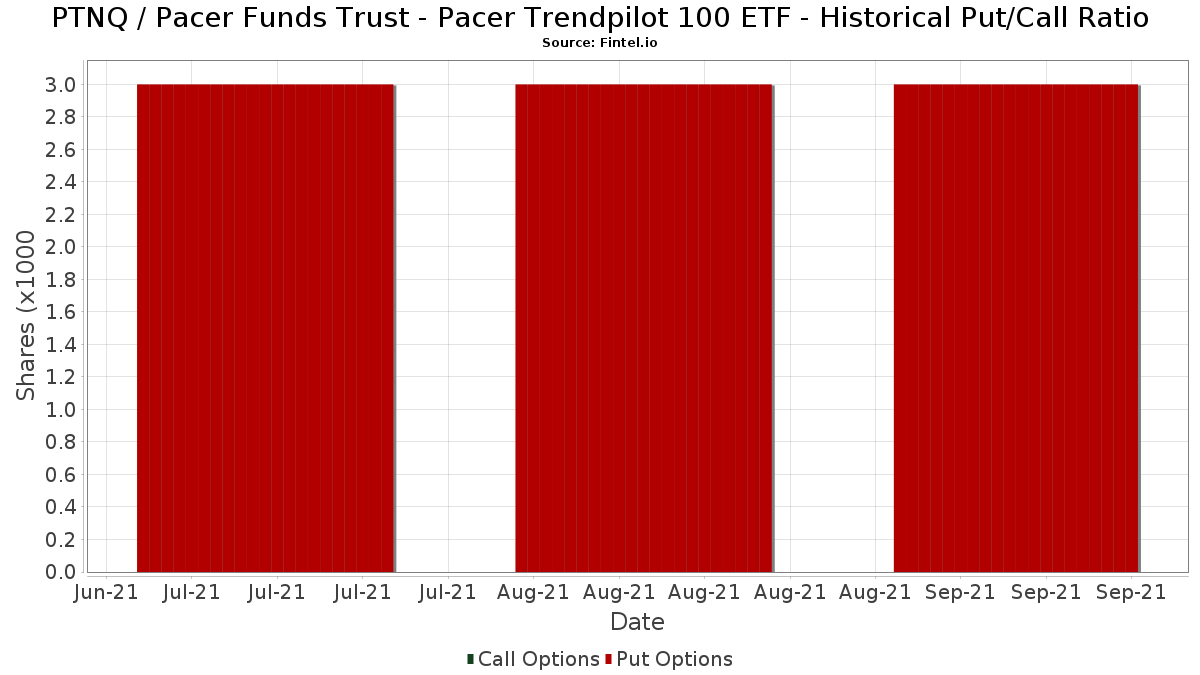
I tillegg til å rapportere standard aksje- og gjeldsemisjoner må institusjoner med mer enn 100 millioner kroner i forvaltningskapital også oppgi beholdningen av put- og callopsjoner. Siden put-opsjoner generelt indikerer et negativt sentiment, og call-opsjoner indikerer et positivt sentiment, kan vi få et inntrykk av det generelle institusjonelle sentimentet ved å plotte forholdet mellom put- og call-opsjoner. Diagrammet til høyre viser det historiske forholdet mellom put- og call-opsjoner for dette instrumentet.
Ved å bruke Put/Call-forholdet som en indikator på investorsentimentet kan man overvinne en av de viktigste svakhetene ved å bruke totalt institusjonelt eierskap, nemlig at en betydelig andel av forvaltningskapitalen investeres passivt for å følge indekser. Passivt forvaltede fond kjøper vanligvis ikke opsjoner, slik at indikatoren for put/call-forhold i større grad gjenspeiler stemningen i aktivt forvaltede fond.
13F- og NPORT-arkiveringer
Detaljer om 13F-arkiveringer er gratis. Detaljer om NP-arkiveringer krever et premium-medlemskap. Grønne rader indikerer nye posisjoner. Røde rader indikerer lukkede posisjoner. Klikk på lenke ikonet for å se hele transaksjonshistorikken.
Oppgrader
for å låse opp premiedata og eksportere til Excel. ![]() .
.
| Fildato | Kilde | Investor | Type | Gjennomsnittlig pris (estimert) |
Aksjer | Δ Aksjer (%) |
Rapportert verdi ($1000) | Verdi (%) | Portallokering (%) | |
|---|---|---|---|---|---|---|---|---|---|---|
| 2025-07-24 | 13F | Us Bancorp \de\ | 0 | −100,00 | 0 | |||||
| 2025-08-11 | 13F | Citigroup Inc | 492 | 0,00 | 35 | 2,94 | ||||
| 2025-08-06 | 13F | Mascagni Wealth Management, Inc. | 4 550 | 16,94 | 325 | 17,39 | ||||
| 2025-07-29 | 13F | Stratos Wealth Partners, LTD. | 19 743 | 0,84 | 1 409 | 1,37 | ||||
| 2025-08-14 | 13F | Bank Of America Corp /de/ | 1 098 718 | −6,05 | 78 415 | −5,58 | ||||
| 2025-08-14 | 13F | IHT Wealth Management, LLC | 2 956 | −11,12 | 211 | −11,02 | ||||
| 2025-07-14 | 13F | Golden State Equity Partners | 8 308 | 593 | ||||||
| 2025-04-21 | 13F | PSI Advisors, LLC | 0 | −100,00 | 0 | −100,00 | ||||
| 2025-04-29 | 13F | Brookstone Capital Management | 0 | −100,00 | 0 | |||||
| 2025-07-17 | 13F | SWS Partners | 3 484 | 0,00 | 249 | 0,40 | ||||
| 2025-07-25 | 13F | Midwest Capital Advisors, LLC | 858 | 0,00 | 61 | 1,67 | ||||
| 2025-07-28 | 13F | Harbour Investments, Inc. | 13 933 | 3,16 | 994 | 3,65 | ||||
| 2025-08-12 | 13F | Change Path, LLC | 18 391 | −17,61 | 1 313 | −17,22 | ||||
| 2025-08-15 | 13F | Kestra Advisory Services, LLC | 54 199 | 11,41 | 3 868 | 11,99 | ||||
| 2025-08-14 | 13F/A | Rockefeller Capital Management L.P. | 90 295 | 0,63 | 6 444 | 1,15 | ||||
| 2025-04-09 | 13F | Milestone Asset Management, Llc | 0 | −100,00 | 0 | |||||
| 2025-06-30 | NP | TRND - Pacer Trendpilot Fund of Funds ETF | 161 335 | 12,61 | 10 872 | 0,83 | ||||
| 2025-07-21 | 13F | New Century Financial Group, LLC | 3 452 | 246 | ||||||
| 2025-08-07 | 13F | PFG Advisors | 18 841 | −2,13 | 1 345 | −1,68 | ||||
| 2025-08-14 | 13F | Comerica Bank | 10 434 | 7,19 | 745 | 7,67 | ||||
| 2025-08-08 | 13F | Avantax Advisory Services, Inc. | 270 924 | 36,17 | 19 336 | 36,86 | ||||
| 2025-07-25 | 13F | Sequoia Financial Advisors, LLC | 5 135 | −0,58 | 366 | 0,00 | ||||
| 2025-08-11 | 13F | Advisor Resource Council | 17 368 | −42,20 | 1 240 | −41,91 | ||||
| 2025-05-16 | 13F/A | Kestra Investment Management, LLC | 0 | −100,00 | 0 | |||||
| 2025-08-14 | 13F | Hilltop Holdings Inc. | 6 828 | 1,46 | 487 | 2,10 | ||||
| 2025-07-16 | 13F | Register Financial Advisors LLC | 871 | 0,00 | 62 | 1,64 | ||||
| 2025-08-08 | 13F | Thoroughbred Financial Services, Llc | 5 046 | −89,89 | 0 | −100,00 | ||||
| 2025-08-12 | 13F | Jacobi Capital Management LLC | 3 040 | 0,00 | 217 | 0,47 | ||||
| 2025-08-14 | 13F | Royal Bank Of Canada | 187 798 | −4,00 | 13 403 | −3,51 | ||||
| 2025-08-12 | 13F | Marshall & Sterling Wealth Advisors Inc. | 0 | −100,00 | 0 | −100,00 | ||||
| 2025-08-11 | 13F | Oder Investment Management, LLC | 11 873 | 1,26 | 847 | 1,80 | ||||
| 2025-07-31 | 13F | Oppenheimer & Co Inc | 14 065 | −10,71 | 1 004 | −10,29 | ||||
| 2025-08-14 | 13F | UBS Group AG | 257 071 | −0,94 | 18 347 | −0,43 | ||||
| 2025-08-14 | 13F | Wells Fargo & Company/mn | 633 628 | −4,39 | 45 222 | −3,91 | ||||
| 2025-04-28 | 13F | Strategic Financial Concepts, LLC | 0 | −100,00 | 0 | −100,00 | ||||
| 2025-07-29 | 13F | Private Trust Co Na | 6 075 | 0,00 | 434 | 0,46 | ||||
| 2025-08-28 | 13F | Stark Wealth Management LLC | 4 350 | 310 | ||||||
| 2025-07-22 | 13F | Legacy Trust | 6 683 | 0,00 | 477 | 0,42 | ||||
| 2025-07-15 | 13F | Burns Matteson Capital Management, LLC | 0 | −100,00 | 0 | |||||
| 2025-08-01 | 13F | Schmidt P J Investment Management Inc | 0 | −100,00 | 0 | |||||
| 2025-07-15 | 13F | EWG Elevate Inc. | 9 933 | 4,15 | 709 | 4,58 | ||||
| 2025-08-14 | 13F | Camarda Financial Advisors, LLC | 7 701 | 14,58 | 550 | 15,09 | ||||
| 2025-07-22 | 13F | Merit Financial Group, LLC | 0 | −100,00 | 0 | |||||
| 2025-08-13 | 13F | Baird Financial Group, Inc. | 3 358 | −2,10 | 240 | −1,65 | ||||
| 2025-08-12 | 13F | Proequities, Inc. | 0 | 0 | ||||||
| 2025-05-15 | 13F/A | Orion Portfolio Solutions, LLC | 11 193 | 4,19 | 795 | −0,13 | ||||
| 2025-07-25 | 13F | Cwm, Llc | 23 568 | 0,00 | 2 | 0,00 | ||||
| 2025-08-12 | 13F | CIBC Private Wealth Group, LLC | 777 | −22,30 | 55 | −17,91 | ||||
| 2025-04-23 | 13F | International Assets Investment Management, Llc | 0 | −100,00 | 0 | |||||
| 2025-08-15 | 13F | First Heartland Consultants, Inc. | 0 | −100,00 | 0 | |||||
| 2025-08-13 | 13F | Trustmark National Bank Trust Department | 7 089 | 0,00 | 506 | 0,40 | ||||
| 2025-08-14 | 13F | Jane Street Group, Llc | 9 421 | 672 | ||||||
| 2025-08-14 | 13F | Arete Wealth Advisors, LLC | 11 833 | 11,26 | 1 | |||||
| 2025-09-04 | 13F/A | Advisor Group Holdings, Inc. | 175 193 | −6,99 | 12 504 | −6,51 | ||||
| 2025-08-04 | 13F | Arkadios Wealth Advisors | 12 834 | 0,63 | 916 | 1,10 | ||||
| 2025-08-14 | 13F | Napa Wealth Management | 26 017 | 1 857 | ||||||
| 2025-04-15 | 13F | Noble Wealth Management PBC | 1 400 | 21,74 | 99 | 16,47 | ||||
| 2025-07-10 | 13F | Financial Management Network Inc | 38 442 | −5,76 | 2 766 | 0,95 | ||||
| 2025-07-17 | 13F | Janney Montgomery Scott LLC | 27 656 | 6,91 | 2 | 0,00 | ||||
| 2025-08-12 | 13F | Insigneo Advisory Services, Llc | 4 519 | −8,09 | 323 | −7,74 | ||||
| 2025-08-12 | 13F | Calton & Associates, Inc. | 9 603 | −79,85 | 685 | −79,76 | ||||
| 2025-05-12 | 13F | Independent Advisor Alliance | 0 | −100,00 | 0 | |||||
| 2025-08-13 | 13F | Proactive Wealth Strategies LLC | 19 802 | −6,69 | 1 | 0,00 | ||||
| 2025-04-17 | 13F | FNY Investment Advisers, LLC | 0 | −100,00 | 0 | |||||
| 2025-07-14 | 13F | GAMMA Investing LLC | 80 | 0,00 | 6 | 0,00 | ||||
| 2025-08-14 | 13F | Susquehanna International Group, Llp | 20 198 | 1 442 | ||||||
| 2025-08-14 | 13F | Mml Investors Services, Llc | 44 892 | −21,13 | 3 | −25,00 | ||||
| 2025-08-11 | 13F | Anfield Capital Management, LLC | 130 | 0,00 | 9 | 0,00 | ||||
| 2025-08-14 | 13F | Mariner, LLC | 7 691 | 2,27 | 549 | 2,62 | ||||
| 2025-08-14 | 13F | Old Mission Capital Llc | 4 338 | 310 | ||||||
| 2025-07-18 | 13F | Truist Financial Corp | 50 074 | −10,81 | 3 574 | −10,36 | ||||
| 2025-08-05 | 13F | GPS Wealth Strategies Group, LLC | 8 580 | 0,00 | 612 | 0,49 | ||||
| 2025-08-14 | 13F | Wiley Bros.-aintree Capital, Llc | 10 717 | −11,20 | 765 | −10,75 | ||||
| 2025-08-14 | 13F | CoreCap Advisors, LLC | 746 | 4,04 | 53 | 6,00 | ||||
| 2025-07-17 | 13F | XML Financial, LLC | 10 724 | −15,57 | 765 | −15,09 | ||||
| 2025-07-21 | 13F | Ameriflex Group, Inc. | 2 588 | −33,64 | 183 | −34,06 | ||||
| 2025-08-05 | 13F | Sigma Planning Corp | 14 590 | −0,27 | 1 041 | 0,29 | ||||
| 2025-08-18 | 13F | Geneos Wealth Management Inc. | 183 469 | 42,46 | 13 094 | 43,18 | ||||
| 2025-07-23 | 13F | Clear Creek Financial Management, LLC | 12 169 | −60,23 | 869 | −60,04 | ||||
| 2025-07-08 | 13F | Nbc Securities, Inc. | 2 165 | 0,00 | 0 | |||||
| 2025-07-30 | 13F | Gimbal Financial | 38 461 | −27,04 | 2 745 | −26,69 | ||||
| 2025-08-14 | 13F | Vienna Asset Management LLC | 68 465 | 28,86 | 4 886 | 29,53 | ||||
| 2025-07-29 | 13F | Stratos Wealth Advisors, LLC | 0 | −100,00 | 0 | |||||
| 2025-08-13 | 13F | MONECO Advisors, LLC | 64 772 | −3,86 | 4 623 | −3,39 | ||||
| 2025-07-24 | 13F | IFP Advisors, Inc | 5 818 | 27,90 | 415 | 28,48 | ||||
| 2025-04-11 | 13F | IAM Advisory, LLC | 0 | −100,00 | 0 | −100,00 | ||||
| 2025-05-13 | 13F | Aptus Capital Advisors, LLC | 0 | −100,00 | 0 | |||||
| 2025-08-08 | 13F | Cetera Investment Advisers | 427 015 | −14,42 | 30 476 | −13,98 | ||||
| 2025-07-22 | 13F | Confluence Wealth Services, Inc. | 8 124 | −0,87 | 580 | 5,27 | ||||
| 2025-07-14 | 13F | MY Wealth Management Inc. | 131 087 | 9 356 | ||||||
| 2025-08-13 | 13F | JBR Co Financial Management Inc | 21 571 | −19,06 | 1 540 | −18,66 | ||||
| 2025-08-14 | 13F | Raymond James Financial Inc | 804 067 | −1,67 | 57 386 | −1,17 | ||||
| 2025-05-15 | 13F | StoneX Group Inc. | 0 | −100,00 | 0 | −100,00 | ||||
| 2025-08-06 | 13F | AE Wealth Management LLC | 953 | 0,00 | 68 | 1,49 | ||||
| 2025-08-13 | 13F | EverSource Wealth Advisors, LLC | 1 672 | 0,00 | 119 | 0,85 | ||||
| 2025-07-29 | 13F | ODonnell Financial Services, LLC | 219 653 | 2,27 | 15 677 | 2,79 | ||||
| 2025-08-12 | 13F | Global Retirement Partners, LLC | 47 | 3 | ||||||
| 2025-08-14 | 13F | EP Wealth Advisors, Inc. | 1 550 | 0,00 | 111 | 0,00 | ||||
| 2025-07-24 | 13F | Cyndeo Wealth Partners, LLC | 3 559 | 254 | ||||||
| 2025-07-31 | 13F | Cambridge Investment Research Advisors, Inc. | 422 624 | −15,71 | 30 | −14,29 | ||||
| 2025-08-14 | 13F | Stifel Financial Corp | 82 344 | 7,87 | 5 877 | 8,41 | ||||
| 2025-07-15 | 13F | Clarus Group, Inc. | 3 818 | 0,00 | 272 | 0,37 | ||||
| 2025-08-12 | 13F | Pacer Advisors, Inc. | 156 854 | 3,22 | 11 195 | 3,74 | ||||
| 2025-07-25 | 13F | Atria Wealth Solutions, Inc. | 107 640 | −16,99 | 7 682 | −16,57 | ||||
| 2025-07-28 | 13F | Axxcess Wealth Management, Llc | 7 555 | −28,83 | 539 | −28,42 | ||||
| 2025-07-21 | 13F | Financial Services Advisory Inc | 22 791 | 0,92 | 1 627 | 1,43 | ||||
| 2025-08-12 | 13F | SRS Capital Advisors, Inc. | 2 754 | 14,80 | 197 | 15,29 | ||||
| 2025-08-11 | 13F | Empirical Finance, LLC | 47 352 | 0,00 | 3 380 | 0,51 | ||||
| 2025-04-23 | 13F | PBMares Wealth Management LLC | 0 | −100,00 | 0 | |||||
| 2025-07-18 | 13F | Trust Co Of Vermont | 925 | 66 | ||||||
| 2025-08-01 | 13F | Brookwood Investment Group LLC | 0 | −100,00 | 0 | |||||
| 2025-08-27 | 13F/A | Brinker Capital Investments, LLC | 12 906 | 15,30 | 921 | 15,99 | ||||
| 2025-08-11 | 13F | HighTower Advisors, LLC | 76 265 | 5 443 | ||||||
| 2025-08-12 | 13F | Jpmorgan Chase & Co | 378 | −55,05 | 27 | −54,24 | ||||
| 2025-08-14 | 13F | Elevatus Welath Management | 0 | −100,00 | 0 | |||||
| 2025-07-23 | 13F | Tyche Wealth Partners LLC | 3 256 | −19,45 | 232 | −18,88 | ||||
| 2025-08-11 | 13F | Private Advisor Group, LLC | 55 026 | 2,94 | 3 927 | 3,48 | ||||
| 2025-08-06 | 13F | Prospera Financial Services Inc | 55 913 | −20,86 | 3 996 | −20,43 | ||||
| 2025-08-13 | 13F | Quadrant Capital Group Llc | 0 | −100,00 | 0 | |||||
| 2025-08-05 | 13F | Sensible Money, LLC | 3 000 | 0,00 | 214 | 0,47 | ||||
| 2025-08-07 | 13F | Kestra Private Wealth Services, Llc | 17 402 | −9,52 | 1 242 | −9,08 | ||||
| 2025-07-07 | 13F | Nova Wealth Management, Inc. | 5 133 | −85,51 | 366 | −85,45 | ||||
| 2025-07-22 | 13F | MBL Wealth, LLC | 47 385 | 3 382 | ||||||
| 2025-08-11 | 13F | Western Wealth Management, LLC | 37 729 | −14,33 | 2 693 | −13,91 | ||||
| 2025-08-12 | 13F | Financial Advocates Investment Management | 3 991 | −2,06 | 285 | −1,73 | ||||
| 2025-08-13 | 13F | Northwestern Mutual Wealth Management Co | 811 | 58 | ||||||
| 2025-08-05 | 13F | Bank Of Montreal /can/ | 600 | 43 | ||||||
| 2025-07-29 | 13F | Stephens Inc /ar/ | 79 800 | −5,70 | 5 695 | −5,23 | ||||
| 2025-08-04 | 13F | Assetmark, Inc | 2 522 | 0,00 | 180 | 0,00 | ||||
| 2025-08-06 | 13F | Commonwealth Equity Services, Llc | 179 441 | −9,17 | 13 | −14,29 | ||||
| 2025-05-14 | 13F | Brown Brothers Harriman & Co | 0 | −100,00 | 0 | |||||
| 2025-08-13 | 13F | Level Four Advisory Services, Llc | 122 128 | 0,87 | 8 716 | 1,38 | ||||
| 2025-07-10 | 13F | Wealth Enhancement Advisory Services, Llc | 13 845 | −71,29 | 996 | −70,91 | ||||
| 2025-08-11 | 13F | CFS Investment Advisory Services, LLC | 7 450 | 1 | ||||||
| 2025-07-07 | 13F | Capital Asset Advisory Services LLC | 7 455 | −29,77 | 527 | −30,70 | ||||
| 2025-08-13 | 13F | Continuum Advisory, LLC | 0 | −100,00 | 0 | |||||
| 2025-08-14 | 13F | Ameriprise Financial Inc | 22 338 | −6,98 | 1 594 | −6,57 | ||||
| 2025-08-15 | 13F | Equitable Holdings, Inc. | 53 917 | −32,58 | 3 848 | −32,23 | ||||
| 2025-08-12 | 13F | LPL Financial LLC | 1 516 605 | 6,61 | 108 240 | 7,15 | ||||
| 2025-08-12 | 13F | J.w. Cole Advisors, Inc. | 18 676 | 0,85 | 1 333 | 1,29 | ||||
| 2025-07-17 | 13F | Tempus Wealth Planning, LLC | 3 166 | −49,63 | 226 | −49,55 | ||||
| 2025-05-06 | 13F | Venturi Wealth Management, LLC | 0 | −100,00 | 0 | |||||
| 2025-08-19 | 13F | National Asset Management, Inc. | 0 | −100,00 | 0 | |||||
| 2025-07-25 | 13F | Lion Street Advisors, LLC | 5 080 | 0,00 | 363 | 0,56 | ||||
| 2025-07-17 | 13F | Beacon Capital Management, LLC | 595 | 0,00 | 42 | 0,00 | ||||
| 2025-08-12 | 13F | Steward Partners Investment Advisory, Llc | 144 276 | 7,02 | 10 297 | 7,56 | ||||
| 2025-08-07 | 13F | Parkside Financial Bank & Trust | 2 465 | 0,00 | 176 | 0,00 | ||||
| 2025-08-14 | 13F | Citadel Advisors Llc | 9 079 | 17,51 | 648 | 18,07 | ||||
| 2025-07-22 | 13F | Unique Wealth, Llc | 3 041 | 0,00 | 217 | 0,93 | ||||
| 2025-08-19 | 13F | Asset Dedication, LLC | 3 000 | 0,00 | 214 | 0,47 | ||||
| 2025-07-02 | 13F | HBW Advisory Services LLC | 3 317 | 237 | ||||||
| 2025-07-11 | 13F | SILVER OAK SECURITIES, Inc | 6 858 | −1,15 | 489 | −0,61 | ||||
| 2025-08-12 | 13F | PKS Advisory Services, LLC | 12 162 | 3,07 | 868 | 3,70 | ||||
| 2025-07-14 | 13F | Southland Equity Partners LLC | 12 368 | 0,24 | 883 | 0,68 | ||||
| 2025-08-14 | 13F | Aft, Forsyth & Sober, LLC | 57 225 | 0,88 | 4 084 | 1,39 | ||||
| 2025-08-01 | 13F | Gwn Securities Inc. | 0 | −100,00 | 0 | |||||
| 2025-07-21 | 13F | Ameritas Advisory Services, LLC | 40 088 | −13,49 | 2 861 | −13,22 | ||||
| 2025-08-01 | 13F | Envestnet Asset Management Inc | 79 069 | −16,24 | 5 643 | −15,81 | ||||
| 2025-08-14 | 13F | Family Office Research LLC | 7 870 | −3,19 | 562 | −2,77 | ||||
| 2025-08-15 | 13F | Morgan Stanley | 1 189 468 | −4,08 | 84 892 | −3,60 | ||||
| 2025-07-22 | 13F | DAVENPORT & Co LLC | 8 344 | 2,14 | 596 | 2,59 | ||||
| 2025-08-08 | 13F | Foundations Investment Advisors, LLC | 4 893 | −61,50 | 349 | −61,31 | ||||
| 2025-08-14 | 13F | GWM Advisors LLC | 149 890 | 76,82 | 10 698 | 77,72 | ||||
| 2025-07-31 | 13F | Stegent Equity Advisors, Inc. | 3 375 | −14,86 | 241 | −14,59 | ||||
| 2025-08-14 | 13F | Kovitz Investment Group Partners, LLC | 3 927 | 0,00 | 280 | 0,72 | ||||
| 2025-08-04 | 13F | Creative Financial Designs Inc /adv | 180 961 | 11,17 | 12 915 | 11,74 | ||||
| 2025-08-04 | 13F | Integrity Alliance, Llc. | 11 062 | −18,47 | 789 | −18,07 | ||||
| 2025-08-14 | 13F | Fmr Llc | 2 970 | −11,34 | 212 | −10,97 | ||||
| 2025-08-07 | 13F | Allworth Financial LP | 1 526 | 0,00 | 109 | 5,88 | ||||
| 2025-07-25 | 13F | Concurrent Investment Advisors, LLC | 28 551 | −4,89 | 2 038 | −4,41 | ||||
| 2025-07-30 | 13F | Strategic Blueprint, LLC | 6 182 | 27,97 | 441 | 28,57 | ||||
| 2025-07-30 | 13F/A | Old Point Trust & Financial Services N A | 452 | 0,00 | 32 | 0,00 |