Grunnleggende statistikk
| Institusjonelle eiere | 185 total, 185 long only, 0 short only, 0 long/short - change of −3,14% MRQ |
| Gjennomsnittlig porteføljeallokering | 0.2854 % - change of −28,08% MRQ |
| Institusjonelle aksjer (Long) | 27 474 087 (ex 13D/G) - change of −3,53MM shares −11,39% MRQ |
| Institusjonell verdi (Long) | $ 428 405 USD ($1000) |
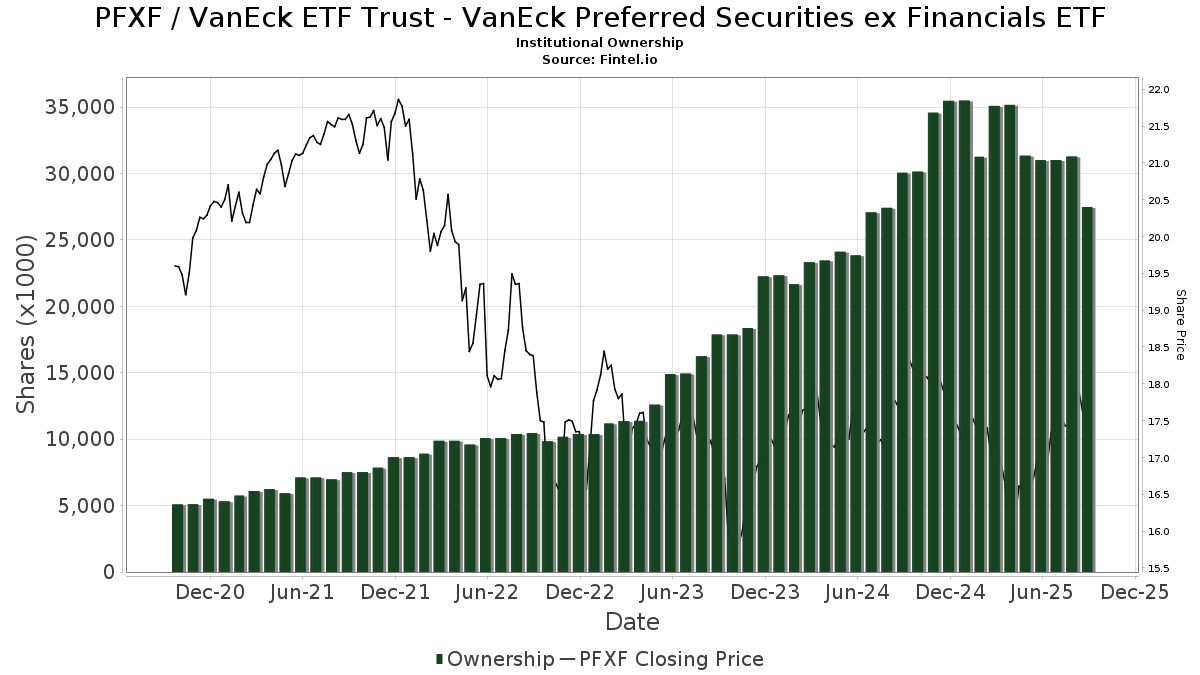
Institusjonelt eierskap og aksjonærer
VanEck ETF Trust - VanEck Preferred Securities ex Financials ETF (US:PFXF) har 185 institusjonelle eiere og aksjonærer som har sendt inn 13D/G- eller 13F-skjemaer til Securities Exchange Commission (SEC). Disse institusjonene eier til sammen 27,474,087 aksjer. De største aksjonærene inkluderer Bank Of America Corp /de/, Morgan Stanley, LPL Financial LLC, Raymond James Financial Inc, Wells Fargo & Company/mn, State of Wisconsin - Board of Commissioners of Public Lands, Mml Investors Services, Llc, Tanager Wealth Management LLP, Envestnet Asset Management Inc, and Good Steward Wealth Advisors,LLC .
VanEck ETF Trust - VanEck Preferred Securities ex Financials ETF (ARCA:PFXF) institusjonell eierstruktur viser nåværende posisjoner i selskapet fordelt på institusjoner og fond, samt de siste endringene i posisjonsstørrelse. De største aksjonærene kan være individuelle investorer, verdipapirfond, hedgefond eller institusjoner. Schedule 13D indikerer at investoren eier (eller har eid) mer enn 5 % av selskapet og har til hensikt (eller hadde til hensikt) å aktivt forfølge en endring i forretningsstrategien. Schedule 13G indikerer en passiv investering på over 5 %.
The share price as of September 10, 2025 is 17,87 / share. Previously, on September 11, 2024, the share price was 17,99 / share. This represents a decline of 0,67% over that period.
Fondssentiment-score
Fondssentiment Score (også kjent som akkumulering av eierskap poengsum) viser hvilke aksjer som er mest kjøpt av fond. Den er resultatet av en sofistikert, kvantitativ flerfaktormodell som identifiserer selskaper med de høyeste nivåene av institusjonell akkumulering. Beregningsmodellen for poeng bruker en kombinasjon av den totale økningen i antall offentliggjorte eiere, endringer i porteføljeallokeringen til disse eierne og andre beregninger. Tallet går fra 0 til 100, der høyere tall indikerer en høyere grad av akkumulering i forhold til sammenlignbare selskaper, der 50 er gjennomsnittet.
Oppdateringsfrekvens: Daglig
Sjekk ut Ownership Explorer, som inneholder en liste over de høyest rangerte selskapene.
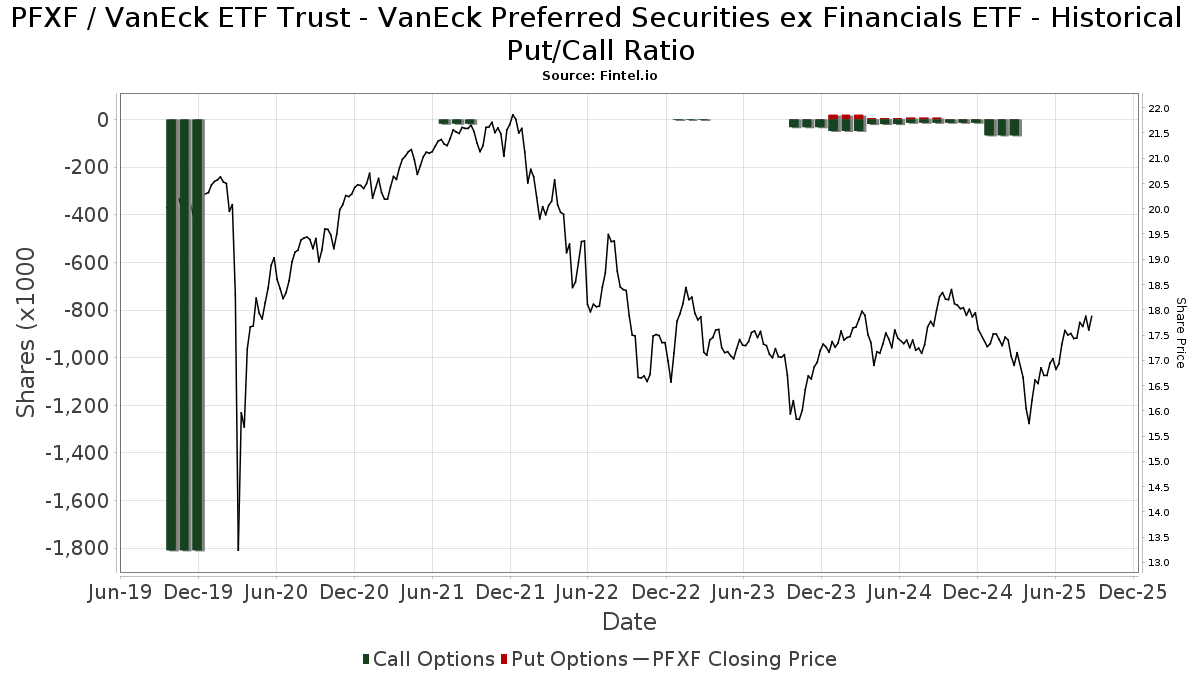
Institusjonell Put/Call-forhold
I tillegg til å rapportere standard aksje- og gjeldsemisjoner må institusjoner med mer enn 100 millioner kroner i forvaltningskapital også oppgi beholdningen av put- og callopsjoner. Siden put-opsjoner generelt indikerer et negativt sentiment, og call-opsjoner indikerer et positivt sentiment, kan vi få et inntrykk av det generelle institusjonelle sentimentet ved å plotte forholdet mellom put- og call-opsjoner. Diagrammet til høyre viser det historiske forholdet mellom put- og call-opsjoner for dette instrumentet.
Ved å bruke Put/Call-forholdet som en indikator på investorsentimentet kan man overvinne en av de viktigste svakhetene ved å bruke totalt institusjonelt eierskap, nemlig at en betydelig andel av forvaltningskapitalen investeres passivt for å følge indekser. Passivt forvaltede fond kjøper vanligvis ikke opsjoner, slik at indikatoren for put/call-forhold i større grad gjenspeiler stemningen i aktivt forvaltede fond.
13F- og NPORT-arkiveringer
Detaljer om 13F-arkiveringer er gratis. Detaljer om NP-arkiveringer krever et premium-medlemskap. Grønne rader indikerer nye posisjoner. Røde rader indikerer lukkede posisjoner. Klikk på lenke ikonet for å se hele transaksjonshistorikken.
Oppgrader
for å låse opp premiedata og eksportere til Excel. ![]() .
.
| Fildato | Kilde | Investor | Type | Gjennomsnittlig pris (estimert) |
Aksjer | Δ Aksjer (%) |
Rapportert verdi ($1000) | Verdi (%) | Portallokering (%) | |
|---|---|---|---|---|---|---|---|---|---|---|
| 2025-08-14 | 13F/A | Rockefeller Capital Management L.P. | 67 940 | 11,37 | 1 163 | 13,80 | ||||
| 2025-08-19 | 13F | National Asset Management, Inc. | 0 | −100,00 | 0 | |||||
| 2025-08-12 | 13F | Bokf, Na | 6 313 | 0,00 | 108 | 2,86 | ||||
| 2025-07-29 | 13F | Creekside Partners | 13 429 | 0,00 | 230 | 1,78 | ||||
| 2025-08-13 | 13F | Jones Financial Companies Lllp | 186 484 | 15,85 | 3 194 | 17,51 | ||||
| 2025-07-25 | 13F | Richardson Financial Services Inc. | 325 | 0,00 | 6 | 0,00 | ||||
| 2025-08-12 | 13F | Steward Partners Investment Advisory, Llc | 278 173 | 0,34 | 4 762 | 2,50 | ||||
| 2025-07-21 | 13F | Future Financial Wealth Managment LLC | 11 415 | −69,36 | 195 | −68,75 | ||||
| 2025-08-07 | 13F | Resources Investment Advisors, LLC. | 20 612 | −22,63 | 353 | −21,08 | ||||
| 2025-08-13 | 13F | Cresset Asset Management, LLC | 25 580 | −10,50 | 438 | −8,77 | ||||
| 2025-08-08 | 13F | Wealth Alliance | 40 669 | 0,16 | 696 | 2,35 | ||||
| 2025-08-11 | 13F | Howard Wealth Management, Llc | 88 948 | −5,38 | 1 523 | −3,37 | ||||
| 2025-07-09 | 13F | Massmutual Trust Co Fsb/adv | 22 830 | 0,86 | 391 | 2,90 | ||||
| 2025-04-24 | 13F | Decker Retirement Planning Inc. | 0 | −100,00 | 0 | |||||
| 2025-07-28 | 13F | Harbour Investments, Inc. | 28 028 | −1,29 | 480 | 0,84 | ||||
| 2025-07-09 | 13F | Procyon Private Wealth Partners, LLC | 21 992 | −6,42 | 377 | −4,33 | ||||
| 2025-07-15 | 13F | Patriot Investment Management Inc. | 17 800 | −16,12 | 305 | −14,37 | ||||
| 2025-08-11 | 13F | State of Wisconsin - Board of Commissioners of Public Lands | 1 525 220 | 0,00 | 26 112 | 2,15 | ||||
| 2025-08-13 | 13F | Renaissance Technologies Llc | 65 500 | 322,58 | 1 121 | 332,82 | ||||
| 2025-07-29 | 13F | Ballast, Inc. | 101 408 | 1 736 | ||||||
| 2025-07-22 | 13F | Wealthcare Advisory Partners LLC | 214 581 | 10,81 | 3 674 | 13,19 | ||||
| 2025-08-14 | 13F | Sunbelt Securities, Inc. | 14 919 | −0,21 | 257 | 2,80 | ||||
| 2025-07-18 | 13F | Tanager Wealth Management LLP | 1 142 036 | −4,93 | 19 552 | −2,89 | ||||
| 2025-08-14 | 13F | Mml Investors Services, Llc | 1 187 758 | 4,92 | 20 | 11,11 | ||||
| 2025-05-05 | 13F | Financial Advisory Service, Inc. | 0 | −100,00 | 0 | |||||
| 2025-08-14 | 13F | Harwood Advisory Group, LLC | 3 589 | 64,78 | 61 | 64,86 | ||||
| 2025-08-26 | 13F/A | Thrivent Financial For Lutherans | 0 | −100,00 | 0 | |||||
| 2025-08-18 | 13F | Geneos Wealth Management Inc. | 71 696 | 13,07 | 1 227 | 15,54 | ||||
| 2025-07-11 | 13F | Mallini Complete Financial Planning LLC | 0 | −100,00 | 0 | |||||
| 2025-08-14 | 13F | Wiley Bros.-aintree Capital, Llc | 34 552 | 23,18 | 592 | 24,95 | ||||
| 2025-08-06 | 13F | Aspect Partners, LLC | 300 | 0,00 | 5 | 0,00 | ||||
| 2025-07-29 | 13F | Stratos Wealth Partners, LTD. | 27 634 | −50,49 | 473 | −49,41 | ||||
| 2025-07-21 | 13F | Mirae Asset Global Investments Co., Ltd. | 0 | −100,00 | 0 | |||||
| 2025-08-14 | 13F | Wells Fargo & Company/mn | 1 563 405 | −8,13 | 26 765 | −6,16 | ||||
| 2025-07-24 | 13F | Accredited Investor Services, Llc | 33 580 | 0,00 | 575 | 2,14 | ||||
| 2025-08-14 | 13F | Susquehanna International Group, Llp | 0 | −100,00 | 0 | |||||
| 2025-08-14 | 13F | Raymond James Financial Inc | 1 703 998 | −21,85 | 29 172 | −20,17 | ||||
| 2025-07-22 | 13F | Valley National Advisers Inc | 0 | −100,00 | 0 | |||||
| 2025-07-21 | 13F | DHJJ Financial Advisors, Ltd. | 2 815 | 48 | ||||||
| 2025-08-12 | 13F | Proequities, Inc. | 0 | 0 | ||||||
| 2025-05-14 | 13F | Van Hulzen Asset Management, LLC | 0 | −100,00 | 0 | −100,00 | ||||
| 2025-07-14 | 13F | Sowell Financial Services LLC | 45 955 | −1,24 | 787 | 0,90 | ||||
| 2025-08-14 | 13F | GWM Advisors LLC | 48 239 | 5,04 | 826 | 7,28 | ||||
| 2025-07-30 | 13F | Roman Butler Fullerton & Co | 25 614 | 2,60 | 448 | 13,71 | ||||
| 2025-08-14 | 13F | Prelude Capital Management, Llc | 0 | −100,00 | 0 | |||||
| 2025-04-17 | 13F | Rs Crum Inc. | 0 | −100,00 | 0 | |||||
| 2025-08-13 | 13F | Orleans Capital Management Corp/la | 12 750 | 0,00 | 218 | 2,35 | ||||
| 2025-05-08 | 13F | Arkadios Wealth Advisors | 0 | −100,00 | 0 | |||||
| 2025-07-16 | 13F | Register Financial Advisors LLC | 9 538 | 0,00 | 163 | 2,52 | ||||
| 2025-07-30 | 13F | D.a. Davidson & Co. | 74 166 | −0,54 | 1 270 | 1,60 | ||||
| 2025-05-13 | 13F | Bank Of Montreal /can/ | 0 | −100,00 | 0 | |||||
| 2025-08-14 | 13F | Citadel Advisors Llc | Put | 0 | −100,00 | 0 | ||||
| 2025-07-11 | 13F | Farther Finance Advisors, LLC | 40 180 | 67,91 | 688 | 73,05 | ||||
| 2025-08-14 | 13F | Citadel Advisors Llc | Call | 0 | −100,00 | 0 | ||||
| 2025-08-07 | 13F | Allworth Financial LP | 1 694 | 29 | ||||||
| 2025-08-11 | 13F | Citigroup Inc | 9 302 | 12,41 | 159 | 15,22 | ||||
| 2025-08-04 | 13F | Assetmark, Inc | 0 | −100,00 | 0 | |||||
| 2025-07-22 | 13F | Measured Risk Portfolios, Inc. | 136 059 | 1,52 | 2 329 | 3,70 | ||||
| 2025-07-24 | 13F | MSH Capital Advisors LLC | 84 519 | 5,32 | 1 447 | 7,59 | ||||
| 2025-07-22 | 13F | Powell Investment Advisors, LLC | 53 244 | −8,44 | 912 | −6,47 | ||||
| 2025-08-08 | 13F | Hartland & Co., LLC | 170 | 1,80 | 3 | 0,00 | ||||
| 2025-07-08 | 13F | Nbc Securities, Inc. | 2 935 | 0,00 | 0 | |||||
| 2025-08-06 | 13F | Texas Yale Capital Corp. | 0 | −100,00 | 0 | |||||
| 2025-07-17 | 13F | Janney Montgomery Scott LLC | 27 990 | 0,24 | 0 | |||||
| 2025-08-05 | 13F | Castlekeep Investment Advisors Llc | 134 183 | 0,00 | 2 297 | 2,18 | ||||
| 2025-07-10 | 13F | Wealth Enhancement Advisory Services, Llc | 131 939 | −12,08 | 2 297 | −8,63 | ||||
| 2025-08-01 | 13F | Envestnet Asset Management Inc | 500 354 | −13,64 | 8 566 | −11,78 | ||||
| 2025-04-21 | 13F | Cadent Capital Advisors, LLC | 0 | −100,00 | 0 | |||||
| 2025-07-29 | 13F | Liberty Square Wealth Partners Llc | 13 014 | 0,00 | 223 | 1,83 | ||||
| 2025-08-14 | 13F | Bluefin Capital Management, Llc | 15 107 | −31,21 | 259 | −29,89 | ||||
| 2025-07-24 | 13F | Etesian Wealth Advisors, Inc. | 54 977 | −3,11 | 941 | −1,05 | ||||
| 2025-08-14 | 13F | Ameriprise Financial Inc | 437 222 | −50,05 | 7 484 | −48,98 | ||||
| 2025-07-30 | 13F | Avidian Wealth Solutions, LLC | 83 335 | 7,23 | 1 427 | 9,52 | ||||
| 2025-08-14 | 13F | Royal Bank Of Canada | 324 683 | −18,36 | 5 558 | −16,60 | ||||
| 2025-08-14 | 13F | Balanced Rock Investment Advisor | 25 412 | 9,28 | 435 | 11,83 | ||||
| 2025-07-15 | 13F | Hofer & Associates. Inc | 15 075 | −1,64 | 258 | 0,78 | ||||
| 2025-08-11 | 13F | Inspire Advisors, LLC | 61 010 | 0,85 | 1 044 | 3,06 | ||||
| 2025-07-25 | 13F | Cwm, Llc | 4 061 | 1,52 | 0 | |||||
| 2025-07-30 | 13F | Capstone Triton Financial Group, LLC | 24 237 | 235 | ||||||
| 2025-08-05 | 13F | GPS Wealth Strategies Group, LLC | 1 900 | 0,00 | 33 | 3,23 | ||||
| 2025-08-15 | 13F | Morgan Stanley | 2 576 916 | −3,32 | 44 117 | −1,24 | ||||
| 2025-07-17 | 13F | Wolff Wiese Magana Llc | 735 | 0,00 | 13 | 0,00 | ||||
| 2025-07-24 | 13F | IFP Advisors, Inc | 15 291 | 25,19 | 262 | 27,94 | ||||
| 2025-08-08 | 13F | Foundations Investment Advisors, LLC | 13 473 | 231 | ||||||
| 2025-07-10 | 13F | Three Seasons Wealth, LLC | 0 | −100,00 | 0 | |||||
| 2025-08-13 | 13F | Cerity Partners LLC | 12 300 | −1,60 | 211 | 0,48 | ||||
| 2025-07-16 | 13F | Crowley Wealth Management, Inc. | 550 | 0,00 | 9 | 0,00 | ||||
| 2025-05-08 | 13F | Private Advisory Group LLC | 0 | −100,00 | 0 | −100,00 | ||||
| 2025-07-23 | 13F | Tcfg Wealth Management, Llc | 20 210 | 1,81 | 346 | 4,22 | ||||
| 2025-07-14 | 13F | Bank & Trust Co | 25 264 | 0,00 | 433 | 2,13 | ||||
| 2025-07-15 | 13F | Evanson Asset Management, LLC | 55 679 | 953 | ||||||
| 2025-07-23 | 13F | Godsey & Gibb Associates | 2 318 | 0,00 | 40 | 2,63 | ||||
| 2025-07-24 | 13F | Mainstay Capital Management Llc /adv | 26 796 | 73,65 | 459 | 77,52 | ||||
| 2025-08-06 | 13F | Commonwealth Equity Services, Llc | 488 783 | 1,81 | 8 | 0,00 | ||||
| 2025-08-14 | 13F | Van Eck Associates Corp | 241 | 0,00 | 0 | |||||
| 2025-08-14 | 13F | Tandem Financial, LLC | 43 323 | 0,00 | 742 | 2,07 | ||||
| 2025-07-14 | 13F | AdvisorNet Financial, Inc | 267 | 5 | ||||||
| 2025-07-25 | 13F | Apollon Wealth Management, LLC | 49 914 | −8,90 | 855 | −6,97 | ||||
| 2025-08-07 | 13F | Samalin Investment Counsel, LLC | 25 703 | 70,80 | 440 | 74,60 | ||||
| 2025-07-30 | 13F | Bogart Wealth, LLC | 529 | 0,00 | 9 | 12,50 | ||||
| 2025-08-14 | 13F | Staley Capital Advisers Inc | 10 000 | 0,00 | 171 | 2,40 | ||||
| 2025-07-29 | 13F | AssuredPartners Investment Advisors, LLC | 27 282 | −75,86 | 467 | −75,33 | ||||
| 2025-07-10 | 13F | Marshall Financial Group LLC | 54 308 | −8,43 | 941 | −5,24 | ||||
| 2025-08-15 | 13F | Captrust Financial Advisors | 40 195 | 688 | ||||||
| 2025-08-14 | 13F | Mpwm Advisory Solutions, Llc | 45 769 | 56,51 | 784 | 59,80 | ||||
| 2025-04-21 | 13F | Nelson, Van Denburg & Campbell Wealth Management Group, LLC | 0 | −100,00 | 0 | |||||
| 2025-08-12 | 13F | Fortis Capital Management LLC | 144 914 | −20,75 | 2 481 | −19,06 | ||||
| 2025-07-24 | 13F | Capital Advisors, Ltd. LLC | 1 505 | 0 | ||||||
| 2025-08-13 | 13F | Lido Advisors, LLC | 0 | −100,00 | 0 | |||||
| 2025-07-28 | 13F | Mission Hills Financial Advisory, LLC | 10 655 | 182 | ||||||
| 2025-05-09 | 13F | Manchester Capital Management LLC | 0 | −100,00 | 0 | |||||
| 2025-08-14 | 13F | Apriem Advisors | 22 700 | 0,00 | 389 | 2,11 | ||||
| 2025-08-07 | 13F | Mayport, Llc | 0 | −100,00 | 0 | |||||
| 2025-08-14 | 13F | Dearborn Partners Llc | 0 | −100,00 | 0 | |||||
| 2025-08-28 | NP | SIRAX - Sierra Tactical All Asset Fund Class A | 139 300 | 2 385 | ||||||
| 2025-07-16 | 13F | Beaumont Financial Advisors, LLC | 26 859 | 0,06 | 460 | 2,23 | ||||
| 2025-08-11 | 13F | HighTower Advisors, LLC | 36 565 | 0,77 | 626 | 2,80 | ||||
| 2025-08-13 | 13F | Northwestern Mutual Wealth Management Co | 178 117 | −31,99 | 3 049 | −30,53 | ||||
| 2025-07-17 | 13F | Delta Capital Management Llc | 37 450 | 0,00 | 1 | |||||
| 2025-07-25 | 13F | Atria Wealth Solutions, Inc. | 107 167 | 10,46 | 1 849 | 13,78 | ||||
| 2025-07-25 | 13F | Concurrent Investment Advisors, LLC | 318 686 | −0,12 | 5 456 | 2,02 | ||||
| 2025-08-13 | 13F | Level Four Advisory Services, Llc | 386 093 | −1,96 | 6 610 | 0,14 | ||||
| 2025-07-29 | 13F | Fundamentun, Llc | 47 845 | 819 | ||||||
| 2025-07-16 | 13F | Perigon Wealth Management, LLC | 16 605 | 1,93 | 284 | 4,03 | ||||
| 2025-08-07 | 13F | Meridian Financial Partners LLC | 34 180 | 8,03 | 1 | |||||
| 2025-08-12 | 13F | Jpmorgan Chase & Co | 204 | 204,48 | 3 | 200,00 | ||||
| 2025-08-14 | 13F | Stifel Financial Corp | 222 639 | −40,03 | 3 812 | −38,75 | ||||
| 2025-08-04 | 13F | Pensionmark Financial Group, Llc | 17 338 | 297 | ||||||
| 2025-08-12 | 13F | MAI Capital Management | 8 090 | 0,00 | 139 | 2,22 | ||||
| 2025-05-15 | 13F | Wolverine Trading, Llc | 0 | −100,00 | 0 | |||||
| 2025-08-08 | 13F | Capital Investment Advisory Services, LLC | 3 619 | 0,00 | 62 | 1,67 | ||||
| 2025-08-04 | 13F | Spire Wealth Management | 2 | 0 | ||||||
| 2025-08-05 | 13F | Key FInancial Inc | 0 | −100,00 | 0 | |||||
| 2025-08-08 | 13F | Cetera Investment Advisers | 82 927 | −0,37 | 1 420 | 1,79 | ||||
| 2025-08-05 | 13F | Gould Asset Management Llc /ca/ | 13 315 | −2,92 | 228 | −0,87 | ||||
| 2025-08-14 | 13F | UBS Group AG | 200 365 | −16,22 | 3 430 | −14,42 | ||||
| 2025-07-16 | 13F | West Branch Capital LLC | 645 | −22,57 | 11 | −15,38 | ||||
| 2025-07-11 | 13F | Brendel Financial Advisors LLC | 145 841 | 2,89 | 2 | 0,00 | ||||
| 2025-08-07 | 13F | Midland Wealth Advisors Llc | 0 | −100,00 | 0 | |||||
| 2025-05-16 | 13F | Coppell Advisory Solutions LLC | 0 | −100,00 | 0 | |||||
| 2025-08-14 | 13F | Citadel Advisors Llc | 21 580 | −29,34 | 369 | −27,79 | ||||
| 2025-04-30 | 13F | POM Investment Strategies, LLC | 0 | −100,00 | 0 | |||||
| 2025-08-13 | 13F | Guggenheim Capital Llc | 88 661 | 6,51 | 1 518 | 8,75 | ||||
| 2025-05-16 | 13F | Coordinated Financial Services, Inc./CO | 0 | −100,00 | 0 | |||||
| 2025-07-10 | 13F | Global Financial Private Client, LLC | 0 | −100,00 | 0 | |||||
| 2025-07-29 | 13F | Private Trust Co Na | 15 551 | 0,00 | 266 | 2,31 | ||||
| 2025-08-14 | 13F | Hrt Financial Lp | 38 031 | 157,70 | 1 | |||||
| 2025-08-14 | 13F | Bank Of America Corp /de/ | 3 028 917 | −11,38 | 51 855 | −9,48 | ||||
| 2025-07-21 | 13F | Ameriflex Group, Inc. | 0 | −100,00 | 0 | |||||
| 2025-07-21 | 13F | Ameritas Advisory Services, LLC | 505 | 9 | ||||||
| 2025-04-25 | 13F | Wall Street Financial Group, Inc. | 13 999 | 1,89 | 235 | −1,27 | ||||
| 2025-07-15 | 13F | Sheets Smith Wealth Management | 79 178 | −3,00 | 1 356 | −0,95 | ||||
| 2025-07-22 | 13F | Plimoth Trust Co Llc | 35 379 | 0,71 | 606 | 2,89 | ||||
| 2025-08-12 | 13F | AlphaCore Capital LLC | 5 513 | 1,94 | 94 | 4,44 | ||||
| 2025-08-21 | 13F | Pathway Financial Advisers, LLC | 27 935 | −5,78 | 478 | −3,63 | ||||
| 2025-08-12 | 13F | SRS Capital Advisors, Inc. | 3 706 | 85,30 | 63 | 90,91 | ||||
| 2025-07-16 | 13F | Northern Oak Wealth Management Inc | 16 018 | 0,00 | 274 | 2,24 | ||||
| 2025-07-31 | 13F | Sumitomo Mitsui Trust Holdings, Inc. | 136 426 | −28,48 | 2 336 | −26,94 | ||||
| 2025-07-14 | 13F | Park Avenue Securities Llc | 311 261 | 5 | ||||||
| 2025-04-28 | 13F | Strategic Financial Concepts, LLC | 0 | −100,00 | 0 | −100,00 | ||||
| 2025-05-05 | 13F | Horizon Investment Services, LLC | 0 | −100,00 | 0 | |||||
| 2025-07-17 | 13F | Beacon Capital Management, LLC | 117 | 0,00 | 2 | 100,00 | ||||
| 2025-08-11 | 13F | Resurgent Financial Advisors LLC | 0 | −100,00 | 0 | |||||
| 2025-04-23 | 13F | Mascagni Wealth Management, Inc. | 0 | −100,00 | 0 | −100,00 | ||||
| 2025-09-04 | 13F/A | Advisor Group Holdings, Inc. | 276 619 | 3,08 | 4 736 | 5,29 | ||||
| 2025-07-18 | 13F | Truist Financial Corp | 168 524 | −1,17 | 2 885 | 0,94 | ||||
| 2025-08-08 | 13F | Emerald Investment Partners, Llc | 5 087 | −0,10 | 87 | 2,35 | ||||
| 2025-07-21 | 13F | Ntv Asset Management Llc | 123 136 | 19,28 | 2 108 | 21,85 | ||||
| 2025-08-06 | 13F | AE Wealth Management LLC | 0 | −100,00 | 0 | |||||
| 2025-05-14 | 13F | Flow Traders U.s. Llc | 0 | −100,00 | 0 | |||||
| 2025-07-08 | 13F | Parallel Advisors, LLC | 903 | 0,00 | 15 | 0,00 | ||||
| 2025-08-01 | 13F | Advisory Alpha, LLC | 18 261 | −0,82 | 313 | 1,30 | ||||
| 2025-08-14 | 13F | Jane Street Group, Llc | 0 | −100,00 | 0 | |||||
| 2025-08-15 | 13F | Equitable Holdings, Inc. | 104 963 | 18,42 | 1 797 | 20,94 | ||||
| 2025-07-15 | 13F | Fifth Third Bancorp | 0 | −100,00 | 0 | |||||
| 2025-08-12 | 13F | Franklin Resources Inc | 60 | 1 | ||||||
| 2025-08-12 | 13F | LPL Financial LLC | 2 394 463 | −2,49 | 40 993 | −0,40 | ||||
| 2025-08-04 | 13F | Atria Investments Llc | 75 737 | 29,31 | 1 297 | 32,11 | ||||
| 2025-08-11 | 13F | Core Wealth Partners LLC | 22 480 | 0,00 | 385 | 2,13 | ||||
| 2025-08-12 | 13F | Global Retirement Partners, LLC | 5 797 | 99 | ||||||
| 2025-08-05 | 13F | Sigma Planning Corp | 103 540 | 120,93 | 1 773 | 125,73 | ||||
| 2025-08-04 | 13F | Kovack Advisors, Inc. | 13 094 | 0,00 | 224 | 2,28 | ||||
| 2025-08-04 | 13F | Silver Coast Investments LLC | 288 427 | 1,40 | 4 938 | 3,57 | ||||
| 2025-07-18 | 13F | Bartlett & Co. Wealth Management Llc | 22 131 | −6,15 | 379 | −4,30 | ||||
| 2025-08-04 | 13F | MeadowBrook Investment Advisors LLC | 7 040 | −0,85 | 121 | 1,69 | ||||
| 2025-08-14 | 13F | Redwood Financial Network Corp | 46 102 | −28,74 | 789 | −27,21 | ||||
| 2025-08-11 | 13F | Private Advisor Group, LLC | 180 918 | 3,60 | 3 097 | 5,84 | ||||
| 2025-08-11 | 13F | Delta Asset Management Llc/tn | 105 | 0,00 | 2 | 0,00 | ||||
| 2025-08-14 | 13F | Van Den Berg Management I, Inc | 0 | −100,00 | 0 | |||||
| 2025-08-14 | 13F | L2 Asset Management, LLC | 267 021 | 1,31 | 4 571 | 3,49 | ||||
| 2025-04-23 | 13F | Creative Financial Designs Inc /adv | 0 | −100,00 | 0 | −100,00 | ||||
| 2025-07-10 | 13F | Sovran Advisors, LLC | 16 518 | 0,00 | 287 | 9,13 | ||||
| 2025-08-13 | 13F | Quadrature Capital Ltd | 130 881 | 2 239 | ||||||
| 2025-08-15 | 13F | Kestra Advisory Services, LLC | 161 774 | −1,17 | 2 770 | 0,95 | ||||
| 2025-07-07 | 13F | Good Steward Wealth Advisors,LLC | 498 682 | 128,07 | 8 537 | 133,00 | ||||
| 2025-07-17 | 13F | Sound Income Strategies, LLC | 303 103 | −2,62 | 5 189 | −0,52 | ||||
| 2025-07-18 | 13F | O'ROURKE & COMPANY, Inc | 10 791 | −13,21 | 185 | −11,54 | ||||
| 2025-07-24 | 13F | Blair William & Co/il | 2 000 | 0,00 | 34 | 3,03 | ||||
| 2025-08-04 | 13F | Pinnacle Associates Ltd | 18 560 | 13,67 | 318 | 16,12 | ||||
| 2025-08-27 | NP | Mason Capital Fund Trust - Fundamentals First ETF | 2 808 | 0,00 | 48 | 2,13 | ||||
| 2025-07-31 | 13F | Cambridge Investment Research Advisors, Inc. | 163 622 | 0,08 | 3 | 0,00 | ||||
| 2025-08-12 | 13F | Howe & Rusling Inc | 393 | 7 | ||||||
| 2025-07-30 | 13F | Mid-American Wealth Advisory Group, Inc. | 769 | 13 | ||||||
| 2025-08-07 | 13F | Montag A & Associates Inc | 0 | −100,00 | 0 | |||||
| 2025-08-14 | 13F | Mariner, LLC | 112 775 | 43,13 | 1 931 | 46,21 | ||||
| 2025-08-14 | 13F | First Wilshire Securities Management Inc | 10 645 | −4,90 | 182 | −2,67 | ||||
| 2025-08-01 | 13F | Signature Wealth Management Group | 78 984 | 1,78 | 1 352 | 4,00 | ||||
| 2025-08-08 | 13F | Creative Planning | 89 642 | 521,56 | 1 535 | 536,51 | ||||
| 2025-07-29 | 13F | Carmel Capital Partners, LLC | 494 913 | 7,73 | 8 473 | 10,04 | ||||
| 2025-08-14 | 13F | Federation des caisses Desjardins du Quebec | 250 | 0,00 | 4 | 0,00 | ||||
| 2025-07-22 | 13F | Tandem Investment Partners LLC | 19 690 | 0,38 | 337 | 2,74 | ||||
| 2025-08-12 | 13F | Insigneo Advisory Services, Llc | 46 410 | 7,81 | 795 | 10,12 | ||||
| 2025-07-31 | 13F | Burke & Herbert Bank & Trust Co | 10 720 | 0,00 | 184 | 2,23 | ||||
| 2025-08-13 | 13F | EverSource Wealth Advisors, LLC | 559 | 0,00 | 10 | 0,00 | ||||
| 2025-08-05 | 13F | Simplex Trading, Llc | 1 597 | 97,16 | 0 | |||||
| 2025-05-06 | 13F | Avantax Advisory Services, Inc. | 0 | −100,00 | 0 | |||||
| 2025-07-07 | 13F | Investors Research Corp | 233 586 | 11,98 | 3 999 | 14,36 | ||||
| 2025-08-04 | 13F | Joseph P. Lucia & Associates, LLC | 101 408 | −1,49 | 1 736 | 0,64 | ||||
| 2025-07-29 | 13F | Chicago Partners Investment Group LLC | 106 784 | 0,73 | 1 872 | 6,73 | ||||
| 2025-08-11 | 13F | Comprehensive Wealth Management, LLC | 0 | −100,00 | 0 | |||||
| 2025-08-14 | 13F | Ausdal Financial Partners, Inc. | 33 164 | −64,78 | 568 | −64,07 | ||||
| 2025-08-08 | 13F | Pnc Financial Services Group, Inc. | 460 | 8 | ||||||
| 2025-08-14 | 13F | Qube Research & Technologies Ltd | 4 111 | 56,91 | 70 | 62,79 | ||||
| 2025-07-23 | 13F | Guild Investment Management, Inc. | 41 180 | −3,51 | 705 | −1,40 | ||||
| 2025-08-14 | 13F | Comerica Bank | 17 490 | 2,51 | 299 | 4,91 | ||||
| 2025-08-01 | 13F | Vision Financial Markets Llc | 324 | 1,89 | 6 | 0,00 | ||||
| 2025-08-06 | 13F | Prospera Financial Services Inc | 0 | −100,00 | 0 | |||||
| 2025-08-14 | 13F | Ariadne Wealth Management, LP | 28 750 | 0,00 | 510 | 6,47 | ||||
| 2025-08-14 | 13F | Acorn Wealth Advisors, LLC | 14 453 | −4,75 | 247 | −2,76 | ||||
| 2025-07-23 | 13F | Sax Wealth Advisors, Llc | 86 107 | −55,82 | 1 474 | −54,87 | ||||
| 2025-08-12 | 13F | Prudential Plc | 6 800 | 0,00 | 116 | 2,65 | ||||
| 2025-08-15 | 13F | Tower Research Capital LLC (TRC) | 0 | −100,00 | 0 | |||||
| 2025-08-14 | 13F | Fmr Llc | 500 | 1 900,00 | 9 | |||||
| 2025-07-22 | 13F | Accel Wealth Management | 13 834 | 0,05 | 237 | 2,16 |