Grunnleggende statistikk
| Institusjonelle eiere | 129 total, 128 long only, 1 short only, 0 long/short - change of 0,78% MRQ |
| Gjennomsnittlig porteføljeallokering | 0.0772 % - change of 5,02% MRQ |
| Institusjonelle aksjer (Long) | 18 873 953 (ex 13D/G) - change of 0,37MM shares 2,02% MRQ |
| Institusjonell verdi (Long) | $ 353 529 USD ($1000) |
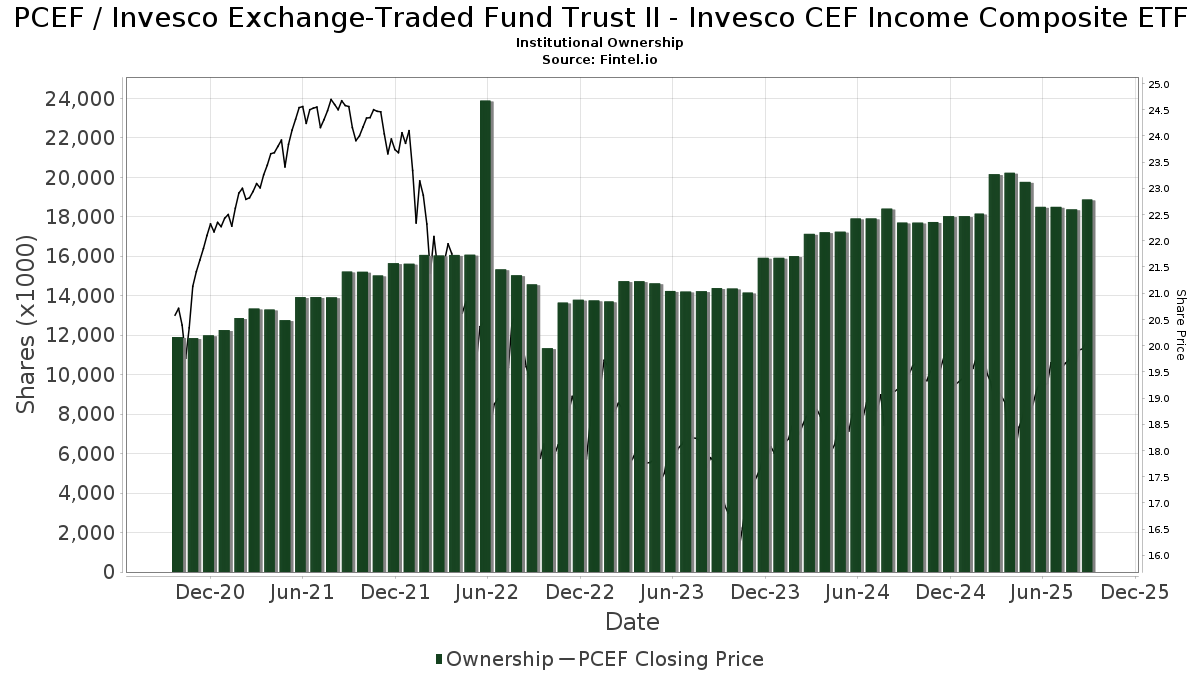
Institusjonelt eierskap og aksjonærer
Invesco Exchange-Traded Fund Trust II - Invesco CEF Income Composite ETF (US:PCEF) har 129 institusjonelle eiere og aksjonærer som har sendt inn 13D/G- eller 13F-skjemaer til Securities Exchange Commission (SEC). Disse institusjonene eier til sammen 18,880,453 aksjer. De største aksjonærene inkluderer Envestnet Asset Management Inc, Morgan Stanley, Wells Fargo & Company/mn, Royal Bank Of Canada, Raymond James Financial Inc, LPL Financial LLC, Bank Of America Corp /de/, Larson Financial Group LLC, Cetera Investment Advisers, and Ameriprise Financial Inc .
Invesco Exchange-Traded Fund Trust II - Invesco CEF Income Composite ETF (ARCA:PCEF) institusjonell eierstruktur viser nåværende posisjoner i selskapet fordelt på institusjoner og fond, samt de siste endringene i posisjonsstørrelse. De største aksjonærene kan være individuelle investorer, verdipapirfond, hedgefond eller institusjoner. Schedule 13D indikerer at investoren eier (eller har eid) mer enn 5 % av selskapet og har til hensikt (eller hadde til hensikt) å aktivt forfølge en endring i forretningsstrategien. Schedule 13G indikerer en passiv investering på over 5 %.
The share price as of September 11, 2025 is 20,16 / share. Previously, on September 12, 2024, the share price was 19,36 / share. This represents an increase of 4,13% over that period.
Fondssentiment-score
Fondssentiment Score (også kjent som akkumulering av eierskap poengsum) viser hvilke aksjer som er mest kjøpt av fond. Den er resultatet av en sofistikert, kvantitativ flerfaktormodell som identifiserer selskaper med de høyeste nivåene av institusjonell akkumulering. Beregningsmodellen for poeng bruker en kombinasjon av den totale økningen i antall offentliggjorte eiere, endringer i porteføljeallokeringen til disse eierne og andre beregninger. Tallet går fra 0 til 100, der høyere tall indikerer en høyere grad av akkumulering i forhold til sammenlignbare selskaper, der 50 er gjennomsnittet.
Oppdateringsfrekvens: Daglig
Sjekk ut Ownership Explorer, som inneholder en liste over de høyest rangerte selskapene.
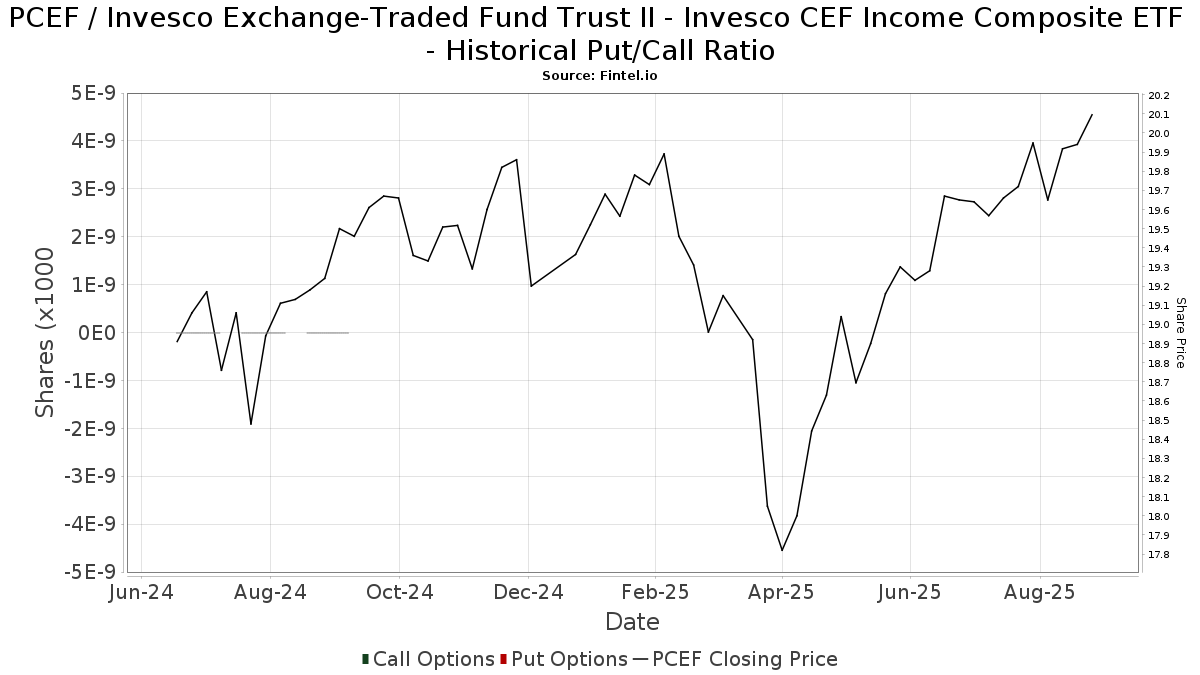
Institusjonell Put/Call-forhold
I tillegg til å rapportere standard aksje- og gjeldsemisjoner må institusjoner med mer enn 100 millioner kroner i forvaltningskapital også oppgi beholdningen av put- og callopsjoner. Siden put-opsjoner generelt indikerer et negativt sentiment, og call-opsjoner indikerer et positivt sentiment, kan vi få et inntrykk av det generelle institusjonelle sentimentet ved å plotte forholdet mellom put- og call-opsjoner. Diagrammet til høyre viser det historiske forholdet mellom put- og call-opsjoner for dette instrumentet.
Ved å bruke Put/Call-forholdet som en indikator på investorsentimentet kan man overvinne en av de viktigste svakhetene ved å bruke totalt institusjonelt eierskap, nemlig at en betydelig andel av forvaltningskapitalen investeres passivt for å følge indekser. Passivt forvaltede fond kjøper vanligvis ikke opsjoner, slik at indikatoren for put/call-forhold i større grad gjenspeiler stemningen i aktivt forvaltede fond.
13F- og NPORT-arkiveringer
Detaljer om 13F-arkiveringer er gratis. Detaljer om NP-arkiveringer krever et premium-medlemskap. Grønne rader indikerer nye posisjoner. Røde rader indikerer lukkede posisjoner. Klikk på lenke ikonet for å se hele transaksjonshistorikken.
Oppgrader
for å låse opp premiedata og eksportere til Excel. ![]() .
.
| Fildato | Kilde | Investor | Type | Gjennomsnittlig pris (estimert) |
Aksjer | Δ Aksjer (%) |
Rapportert verdi ($1000) | Verdi (%) | Portallokering (%) | |
|---|---|---|---|---|---|---|---|---|---|---|
| 2025-08-14 | 13F | Gotham Asset Management, LLC | 19 418 | 22,03 | 379 | 26,76 | ||||
| 2025-08-12 | 13F | Steward Partners Investment Advisory, Llc | 4 281 | −0,19 | 84 | 3,75 | ||||
| 2025-08-12 | 13F | Boxwood Ventures, Inc. | 14 893 | 2,10 | 291 | 6,20 | ||||
| 2025-08-14 | 13F | Qube Research & Technologies Ltd | 57 | 0,00 | 1 | 0,00 | ||||
| 2025-07-17 | 13F | Janney Montgomery Scott LLC | 25 842 | −9,07 | 1 | |||||
| 2025-08-14 | 13F | Sunbelt Securities, Inc. | 801 | −2,08 | 15 | 0,00 | ||||
| 2025-07-08 | 13F | Heartwood Wealth Advisors LLC | 35 000 | 0,00 | 684 | 3,64 | ||||
| 2025-04-22 | 13F | Merkkuri Wealth Advisors LLC | 0 | −100,00 | 0 | |||||
| 2025-07-30 | 13F | Cullen/frost Bankers, Inc. | 0 | −100,00 | 0 | |||||
| 2025-05-15 | 13F/A | Orion Portfolio Solutions, LLC | 50 024 | −10,77 | 943 | −12,29 | ||||
| 2025-08-26 | 13F/A | Thrivent Financial For Lutherans | 0 | −100,00 | 0 | |||||
| 2025-05-09 | 13F | Blair William & Co/il | 0 | −100,00 | 0 | −100,00 | ||||
| 2025-07-18 | 13F | Truist Financial Corp | 74 536 | −14,71 | 1 434 | −12,93 | ||||
| 2025-08-04 | 13F | Adell Harriman & Carpenter Inc | 124 300 | 4,63 | 2 429 | 8,44 | ||||
| 2025-08-06 | 13F | Prospera Financial Services Inc | 12 711 | 0,88 | 248 | 4,64 | ||||
| 2025-07-23 | 13F | Sax Wealth Advisors, Llc | 12 500 | 0,00 | 244 | 3,83 | ||||
| 2025-08-14 | 13F | Wealth Preservation Advisors, LLC | 500 | 0,00 | 10 | 0,00 | ||||
| 2025-08-14 | 13F | Mml Investors Services, Llc | 91 654 | −7,58 | 2 | 0,00 | ||||
| 2025-08-14 | 13F | Warren Averett Asset Management, LLC | 13 073 | −3,67 | 255 | 0,00 | ||||
| 2025-08-15 | 13F | Morgan Stanley | 2 172 900 | 1,30 | 42 458 | 5,00 | ||||
| 2025-09-09 | 13F | NWF Advisory Services Inc. | 25 000 | 4,17 | 488 | 7,96 | ||||
| 2025-08-13 | 13F | EverSource Wealth Advisors, LLC | 0 | −100,00 | 0 | |||||
| 2025-07-31 | 13F | Glass Jacobson Investment Advisors llc | 135 | 0,00 | 3 | 0,00 | ||||
| 2025-07-08 | 13F | Zrc Wealth Management, Llc | 1 311 | 0,00 | 26 | 4,17 | ||||
| 2025-08-01 | 13F | Gwn Securities Inc. | 0 | −100,00 | 0 | |||||
| 2025-08-19 | 13F | Newbridge Financial Services Group, Inc. | 7 449 | −24,94 | 146 | −22,46 | ||||
| 2025-08-08 | 13F | Emerald Investment Partners, Llc | 62 100 | 6,99 | 1 213 | 10,88 | ||||
| 2025-08-14 | 13F | UBS Group AG | 298 828 | −2,14 | 5 839 | 1,44 | ||||
| 2025-07-22 | 13F | Merit Financial Group, LLC | 131 883 | 55,57 | 2 577 | 61,30 | ||||
| 2025-07-28 | 13F | Harbour Investments, Inc. | 6 574 | −5,19 | 128 | −1,54 | ||||
| 2025-08-04 | 13F | Wolverine Asset Management Llc | 0 | −100,00 | 0 | |||||
| 2025-07-14 | 13F | Sowell Financial Services LLC | 28 634 | 0,46 | 560 | 4,10 | ||||
| 2025-08-04 | 13F | Assetmark, Inc | 54 | 1 | ||||||
| 2025-07-14 | 13F | Buska Wealth Management, LLC | 19 886 | 3,38 | 389 | 7,18 | ||||
| 2025-08-08 | 13F | Larson Financial Group LLC | 572 383 | 886,63 | 11 184 | 923,24 | ||||
| 2025-08-08 | 13F | Capital Investment Advisory Services, LLC | 4 673 | 2,10 | 91 | 5,81 | ||||
| 2025-04-23 | 13F | Bessemer Group Inc | 0 | −100,00 | 0 | |||||
| 2025-05-29 | NP | BTSAX - BTS Managed Income Fund Class A Shares | 15 669 | −0,67 | 295 | −2,32 | ||||
| 2025-07-11 | 13F | Farther Finance Advisors, LLC | 6 544 | 129,29 | 128 | 139,62 | ||||
| 2025-08-15 | 13F | WFA of San Diego, LLC | 2 300 | −9,80 | 45 | −12,00 | ||||
| 2025-07-10 | 13F | Wealth Enhancement Advisory Services, Llc | 469 408 | 6,94 | 9 261 | 11,93 | ||||
| 2025-07-21 | 13F | Ameritas Advisory Services, LLC | 4 687 | 92 | ||||||
| 2025-08-12 | 13F | Ameritas Investment Partners, Inc. | 1 | 0 | ||||||
| 2025-08-12 | 13F | LPL Financial LLC | 1 101 222 | 14,88 | 21 518 | 19,08 | ||||
| 2025-08-14 | 13F | GWM Advisors LLC | 38 836 | 3,23 | 759 | 6,91 | ||||
| 2025-05-14 | 13F | Oarsman Capital, Inc. | 0 | −100,00 | 0 | −100,00 | ||||
| 2025-08-05 | 13F | Atlas Private Wealth Advisors | 0 | −100,00 | 0 | |||||
| 2025-07-17 | 13F | Wagner Wealth Management, Llc | 3 116 | 0,00 | 61 | 3,45 | ||||
| 2025-07-21 | 13F | Future Financial Wealth Managment LLC | 55 349 | 1,85 | 1 082 | 5,57 | ||||
| 2025-05-14 | 13F | Jane Street Group, Llc | 0 | −100,00 | 0 | |||||
| 2025-08-14 | 13F | Money Concepts Capital Corp | 10 739 | 210 | ||||||
| 2025-05-12 | 13F | Independent Advisor Alliance | 0 | −100,00 | 0 | |||||
| 2025-08-12 | 13F | Cornerstone Wealth Management, LLC | 63 722 | 1 245 | ||||||
| 2025-07-29 | 13F | Mezzasalma Advisors, LLC | 0 | −100,00 | 0 | |||||
| 2025-09-04 | 13F/A | Advisor Group Holdings, Inc. | 185 311 | 7,18 | 3 622 | 11,11 | ||||
| 2025-08-06 | 13F | AE Wealth Management LLC | 1 096 | −63,21 | 21 | −62,50 | ||||
| 2025-08-04 | 13F | Spire Wealth Management | 250 | 0,00 | 5 | 0,00 | ||||
| 2025-08-11 | 13F | Pinnacle Wealth Planning Services, Inc. | 17 190 | 0,00 | 336 | 3,40 | ||||
| 2025-08-11 | 13F | Sykon Capital Llc | 96 215 | −21,11 | 1 880 | −18,23 | ||||
| 2025-04-24 | 13F/A | Golden State Wealth Management, LLC | 0 | −100,00 | 0 | −100,00 | ||||
| 2025-07-21 | 13F | Hudson Valley Investment Advisors Inc /adv | 15 704 | 0,00 | 307 | 3,38 | ||||
| 2025-07-31 | 13F | Oppenheimer & Co Inc | 78 614 | 25,46 | 1 536 | 30,06 | ||||
| 2025-08-13 | 13F | Summit Financial, LLC | 61 860 | 204,16 | 1 209 | 215,40 | ||||
| 2025-08-14 | 13F | Susquehanna International Group, Llp | 0 | −100,00 | 0 | |||||
| 2025-05-08 | 13F | Menard Financial Group LLC | 0 | −100,00 | 0 | |||||
| 2025-08-07 | 13F | 1620 Investment Advisors, Inc. | 435 | 0,00 | 8 | 0,00 | ||||
| 2025-07-25 | 13F | Atria Wealth Solutions, Inc. | 15 263 | −72,01 | 298 | −70,98 | ||||
| 2025-08-14 | 13F | Garden State Investment Advisory Services LLC | 18 941 | 0,00 | 370 | 3,64 | ||||
| 2025-08-07 | 13F | Allworth Financial LP | 40 | 0,00 | 1 | |||||
| 2025-08-08 | 13F | Hartland & Co., LLC | 15 232 | 298 | ||||||
| 2025-07-24 | 13F | IFP Advisors, Inc | 1 620 | 0,00 | 32 | 3,33 | ||||
| 2025-08-07 | 13F | Resources Investment Advisors, LLC. | 13 157 | 2,10 | 257 | 6,20 | ||||
| 2025-08-14 | 13F | Raymond James Financial Inc | 1 152 972 | 13,55 | 22 529 | 17,71 | ||||
| 2025-07-25 | 13F | Endowment Wealth Management, Inc. | 21 888 | 10,05 | 428 | 14,17 | ||||
| 2025-05-29 | NP | ACEFX - Absolute Strategies Fund Institutional Shares | Short | −6 500 | −123 | |||||
| 2025-08-08 | 13F | Beck Bode, LLC | 29 559 | −31,03 | 578 | −28,50 | ||||
| 2025-08-14 | 13F | Bnp Paribas Arbitrage, Sa | 1 396 | −43,55 | 27 | −41,30 | ||||
| 2025-07-08 | 13F | Parallel Advisors, LLC | 321 | 6 | ||||||
| 2025-07-10 | 13F | Atticus Wealth Management, Llc | 4 784 | 0,00 | 93 | 3,33 | ||||
| 2025-08-12 | 13F | Jpmorgan Chase & Co | 0 | −100,00 | 0 | −100,00 | ||||
| 2025-08-14 | 13F/A | Rockefeller Capital Management L.P. | 103 038 | 0,55 | 2 013 | 4,25 | ||||
| 2025-08-01 | 13F | Envestnet Asset Management Inc | 2 851 970 | 8,26 | 55 720 | 12,21 | ||||
| 2025-04-25 | 13F | Tradewinds Capital Management, LLC | 0 | −100,00 | 0 | |||||
| 2025-08-13 | 13F | Level Four Advisory Services, Llc | 10 777 | 4,99 | 211 | 8,81 | ||||
| 2025-07-08 | 13F | Nbc Securities, Inc. | 4 853 | 101,96 | 0 | |||||
| 2025-07-29 | 13F | Chicago Partners Investment Group LLC | 27 137 | −8,60 | 531 | −3,98 | ||||
| 2025-07-14 | 13F | Toth Financial Advisory Corp | 146 | 0,00 | 3 | 0,00 | ||||
| 2025-08-13 | 13F | Jones Financial Companies Lllp | 614 | 12 | ||||||
| 2025-08-01 | 13F | Pasadena Private Wealth, LLC | 0 | −100,00 | 0 | |||||
| 2025-07-29 | 13F | Salomon & Ludwin, LLC | 773 | 0,00 | 15 | 7,14 | ||||
| 2025-08-14 | 13F | CoreCap Advisors, LLC | 7 414 | −0,01 | 145 | 3,60 | ||||
| 2025-08-14 | 13F | Ameriprise Financial Inc | 495 423 | −25,11 | 9 680 | −22,52 | ||||
| 2025-08-15 | 13F | Kestra Advisory Services, LLC | 35 459 | 1,40 | 693 | 5,01 | ||||
| 2025-05-09 | 13F | Pathway Financial Advisers, LLC | 0 | −100,00 | 0 | |||||
| 2025-08-08 | 13F | Avantax Advisory Services, Inc. | 37 727 | −15,01 | 737 | −11,84 | ||||
| 2025-08-14 | 13F | Stifel Financial Corp | 49 382 | −1,92 | 965 | 1,58 | ||||
| 2025-08-14 | 13F | Mariner, LLC | 94 176 | −1,75 | 1 840 | 1,94 | ||||
| 2025-07-25 | 13F | Envestnet Portfolio Solutions, Inc. | 11 180 | −55,41 | 218 | −53,81 | ||||
| 2025-08-14 | 13F | Quartz Partners, LLC | 13 834 | 0,00 | 270 | 3,85 | ||||
| 2025-08-08 | 13F | Compass Financial Services Inc | 14 221 | −29,96 | 278 | −27,49 | ||||
| 2025-07-30 | 13F | BG Investment Services, Inc. | 15 726 | 307 | ||||||
| 2025-07-29 | 13F | Stephens Inc /ar/ | 104 870 | 5,70 | 2 049 | 9,57 | ||||
| 2025-08-07 | 13F | Readystate Asset Management Lp | 15 047 | 294 | ||||||
| 2025-07-25 | 13F | Cwm, Llc | 3 046 | −29,91 | 0 | |||||
| 2025-07-18 | 13F | Marino, Stram & Associates Llc | 46 515 | 0,00 | 909 | 3,65 | ||||
| 2025-07-31 | 13F | Cambridge Investment Research Advisors, Inc. | 202 780 | −13,32 | 4 | −25,00 | ||||
| 2025-08-08 | 13F | Pnc Financial Services Group, Inc. | 11 635 | −1,27 | 227 | 2,25 | ||||
| 2025-08-11 | 13F | Hexagon Capital Partners LLC | 12 299 | 0,00 | 240 | 3,90 | ||||
| 2025-08-13 | 13F | Beacon Pointe Advisors, LLC | 12 189 | −16,01 | 238 | −12,82 | ||||
| 2025-08-11 | 13F | Citigroup Inc | 256 | 0,00 | 5 | 25,00 | ||||
| 2025-07-17 | 13F | Sound Income Strategies, LLC | 60 | 0,00 | 1 | 0,00 | ||||
| 2025-08-05 | 13F | GPS Wealth Strategies Group, LLC | 6 305 | −24,58 | 123 | −21,66 | ||||
| 2025-05-02 | 13F | Apollon Wealth Management, LLC | 0 | −100,00 | 0 | −100,00 | ||||
| 2025-07-14 | 13F | GAMMA Investing LLC | 75 127 | −65,89 | 1 468 | −64,66 | ||||
| 2025-08-05 | 13F | Key FInancial Inc | 6 | 0,00 | 0 | |||||
| 2025-08-13 | 13F | Argyle Capital Partners, LLC | 23 364 | 0,00 | 457 | 3,64 | ||||
| 2025-08-11 | 13F | Principal Securities, Inc. | 149 | 0,00 | 3 | 0,00 | ||||
| 2025-07-07 | 13F | Investors Research Corp | 213 | 0,00 | 4 | 0,00 | ||||
| 2025-08-14 | 13F | Comerica Bank | 21 427 | 1,60 | 419 | 5,29 | ||||
| 2025-07-17 | 13F | Vermillion Wealth Management, Inc. | 1 333 | −0,82 | 26 | 4,00 | ||||
| 2025-08-08 | 13F | Creative Planning | 60 205 | −14,32 | 1 176 | −11,18 | ||||
| 2025-07-07 | 13F | Thurston, Springer, Miller, Herd & Titak, Inc. | 2 613 | 0,00 | 51 | 4,08 | ||||
| 2025-08-15 | 13F | Equitable Holdings, Inc. | 10 431 | −10,03 | 204 | −6,88 | ||||
| 2025-07-24 | 13F | Us Bancorp \de\ | 2 700 | 0,00 | 53 | 4,00 | ||||
| 2025-08-06 | 13F | Commonwealth Equity Services, Llc | 452 065 | −1,76 | 9 | 0,00 | ||||
| 2025-08-27 | 13F/A | Brinker Capital Investments, LLC | 46 084 | −7,88 | 900 | −4,46 | ||||
| 2025-08-08 | 13F | Crossmark Global Holdings, Inc. | 0 | −100,00 | 0 | |||||
| 2025-08-13 | 13F | Johnson Financial Group, Inc. | 462 | 0,00 | 9 | 12,50 | ||||
| 2025-08-13 | 13F | Baird Financial Group, Inc. | 443 295 | 3,86 | 8 662 | 7,66 | ||||
| 2025-08-14 | 13F | Fmr Llc | 2 684 | −63,36 | 52 | −62,32 | ||||
| 2025-08-11 | 13F | Anfield Capital Management, LLC | 7 323 | 0,00 | 143 | 3,62 | ||||
| 2025-08-07 | 13F | Panoramic Investment Advisors, Llc | 51 203 | 0,57 | 1 001 | 4,28 | ||||
| 2025-08-08 | 13F | Intrua Financial, LLC | 470 852 | 237,91 | 9 200 | 250,34 | ||||
| 2025-08-12 | 13F | PSI Advisors, LLC | 0 | −100,00 | 0 | |||||
| 2025-08-14 | 13F | Royal Bank Of Canada | 1 837 577 | −14,03 | 35 906 | −10,88 | ||||
| 2025-08-13 | 13F | Northwestern Mutual Wealth Management Co | 0 | −100,00 | 0 | |||||
| 2025-07-21 | 13F | TFG Advisers LLC | 14 998 | 4,68 | 293 | 8,52 | ||||
| 2025-08-21 | 13F | Aveo Capital Partners, LLC | 0 | −100,00 | 0 | |||||
| 2025-07-29 | 13F | Dumont & Blake Investment Advisors Llc | 137 517 | −0,12 | 2 687 | 3,55 | ||||
| 2025-08-14 | 13F | Bank Of America Corp /de/ | 941 215 | 0,81 | 18 391 | 4,50 | ||||
| 2025-08-11 | 13F | HighTower Advisors, LLC | 103 247 | −12,48 | 2 017 | −9,27 | ||||
| 2025-07-30 | 13F | BTS Asset Management, Inc. | 0 | −100,00 | 0 | |||||
| 2025-08-12 | 13F | Proequities, Inc. | 0 | 0 | ||||||
| 2025-08-08 | 13F | Cetera Investment Advisers | 498 833 | 19,32 | 9 747 | 23,69 | ||||
| 2025-07-31 | 13F | Moser Wealth Advisors, LLC | 1 000 | 0,00 | 20 | 5,56 | ||||
| 2025-08-11 | 13F | VSM Wealth Advisory, LLC | 4 543 | 1,43 | 89 | 4,76 | ||||
| 2025-08-14 | 13F | Wells Fargo & Company/mn | 1 994 801 | −10,33 | 38 978 | −7,05 | ||||
| 2025-08-11 | 13F | Private Advisor Group, LLC | 25 818 | −1,64 | 504 | 2,02 | ||||
| 2025-07-08 | 13F | Goldstone Financial Group, LLC | 53 404 | −1,69 | 1 054 | 2,93 | ||||
| 2025-07-24 | 13F | Von Berge Wealth Management Group, LLC | 12 035 | 1,69 | 235 | 8,84 | ||||
| 2025-08-12 | 13F | Global Retirement Partners, LLC | 44 | 4,76 | 1 | |||||
| 2025-08-18 | 13F | Geneos Wealth Management Inc. | 48 941 | 20,26 | 956 | 24,64 | ||||
| 2025-07-09 | 13F | Massmutual Trust Co Fsb/adv | 244 | 5 | ||||||
| 2025-08-06 | 13F | Aspect Partners, LLC | 590 | 12 | ||||||
| 2025-08-12 | 13F | Gladstone Institutional Advisory LLC | 20 512 | −2,81 | 401 | 0,76 | ||||
| 2025-08-14 | 13F | Glen Eagle Advisors, LLC | 3 405 | 0,00 | 67 | 3,13 |