Grunnleggende statistikk
| Institusjonelle eiere | 172 total, 172 long only, 0 short only, 0 long/short - change of 16,11% MRQ |
| Gjennomsnittlig porteføljeallokering | 0.6971 % - change of −15,47% MRQ |
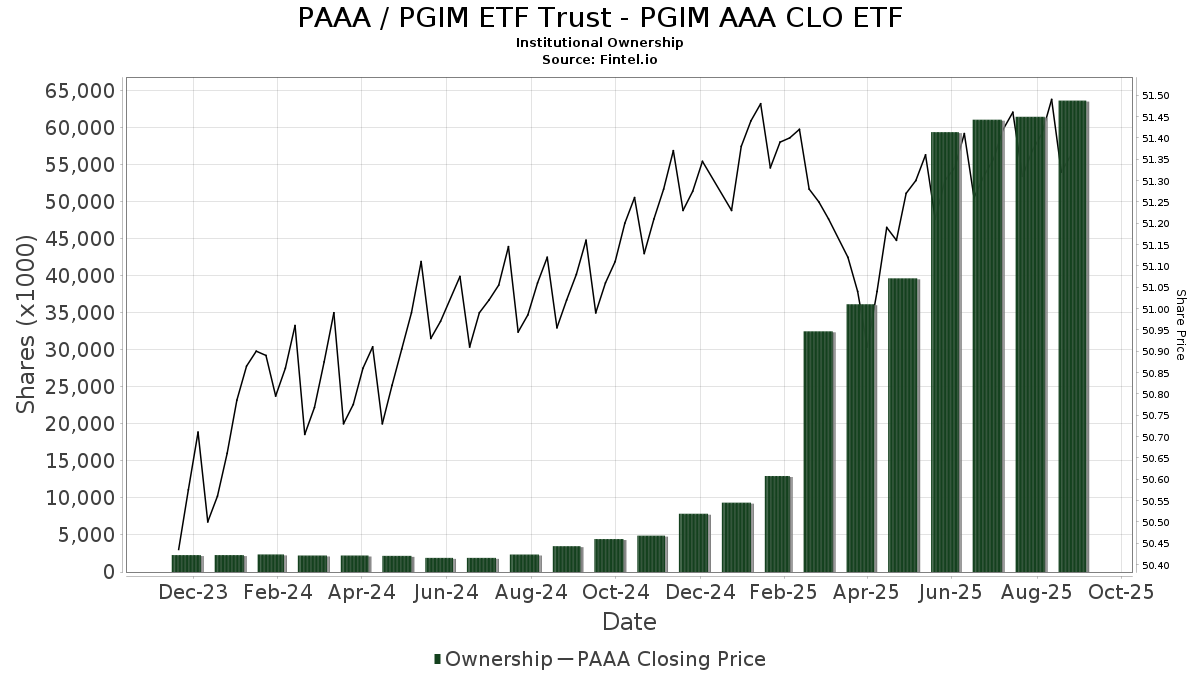
| Institusjonelle aksjer (Long) | 63 617 390 (ex 13D/G) - change of 4,26MM shares 7,17% MRQ |
| Institusjonell verdi (Long) | $ 3 227 027 USD ($1000) |
Institusjonelt eierskap og aksjonærer
PGIM ETF Trust - PGIM AAA CLO ETF (US:PAAA) har 172 institusjonelle eiere og aksjonærer som har sendt inn 13D/G- eller 13F-skjemaer til Securities Exchange Commission (SEC). Disse institusjonene eier til sammen 63,617,390 aksjer. De største aksjonærene inkluderer Prudential Financial Inc, Bank Of America Corp /de/, Morgan Stanley, LPL Financial LLC, JDYRX - PGIM HIGH YIELD FUND Class R, TAIBX - PGIM CORE BOND FUND Class Z, PULS - PGIM Ultra Short Bond ETF, PADAX - PGIM Absolute Return Bond Fund Class A, PDBAX - PGIM TOTAL RETURN BOND FUND Class A, and SDMAX - PGIM Short Duration Multi-Sector Bond Fund Class A .
PGIM ETF Trust - PGIM AAA CLO ETF (ARCA:PAAA) institusjonell eierstruktur viser nåværende posisjoner i selskapet fordelt på institusjoner og fond, samt de siste endringene i posisjonsstørrelse. De største aksjonærene kan være individuelle investorer, verdipapirfond, hedgefond eller institusjoner. Schedule 13D indikerer at investoren eier (eller har eid) mer enn 5 % av selskapet og har til hensikt (eller hadde til hensikt) å aktivt forfølge en endring i forretningsstrategien. Schedule 13G indikerer en passiv investering på over 5 %.
The share price as of September 12, 2025 is 51,38 / share. Previously, on September 13, 2024, the share price was 51,08 / share. This represents an increase of 0,59% over that period.
Fondssentiment-score
Fondssentiment Score (også kjent som akkumulering av eierskap poengsum) viser hvilke aksjer som er mest kjøpt av fond. Den er resultatet av en sofistikert, kvantitativ flerfaktormodell som identifiserer selskaper med de høyeste nivåene av institusjonell akkumulering. Beregningsmodellen for poeng bruker en kombinasjon av den totale økningen i antall offentliggjorte eiere, endringer i porteføljeallokeringen til disse eierne og andre beregninger. Tallet går fra 0 til 100, der høyere tall indikerer en høyere grad av akkumulering i forhold til sammenlignbare selskaper, der 50 er gjennomsnittet.
Oppdateringsfrekvens: Daglig
Sjekk ut Ownership Explorer, som inneholder en liste over de høyest rangerte selskapene.
Institusjonell Put/Call-forhold
I tillegg til å rapportere standard aksje- og gjeldsemisjoner må institusjoner med mer enn 100 millioner kroner i forvaltningskapital også oppgi beholdningen av put- og callopsjoner. Siden put-opsjoner generelt indikerer et negativt sentiment, og call-opsjoner indikerer et positivt sentiment, kan vi få et inntrykk av det generelle institusjonelle sentimentet ved å plotte forholdet mellom put- og call-opsjoner. Diagrammet til høyre viser det historiske forholdet mellom put- og call-opsjoner for dette instrumentet.
Ved å bruke Put/Call-forholdet som en indikator på investorsentimentet kan man overvinne en av de viktigste svakhetene ved å bruke totalt institusjonelt eierskap, nemlig at en betydelig andel av forvaltningskapitalen investeres passivt for å følge indekser. Passivt forvaltede fond kjøper vanligvis ikke opsjoner, slik at indikatoren for put/call-forhold i større grad gjenspeiler stemningen i aktivt forvaltede fond.
13F- og NPORT-arkiveringer
Detaljer om 13F-arkiveringer er gratis. Detaljer om NP-arkiveringer krever et premium-medlemskap. Grønne rader indikerer nye posisjoner. Røde rader indikerer lukkede posisjoner. Klikk på lenke ikonet for å se hele transaksjonshistorikken.
Oppgrader
for å låse opp premiedata og eksportere til Excel. ![]() .
.
| Fildato | Kilde | Investor | Type | Gjennomsnittlig pris (estimert) |
Aksjer | Δ Aksjer (%) |
Rapportert verdi ($1000) | Verdi (%) | Portallokering (%) | |
|---|---|---|---|---|---|---|---|---|---|---|
| 2025-08-27 | NP | SCFZX - PGIM Securitized Credit Fund Class Z | 725 000 | −35,56 | 37 301 | −35,38 | ||||
| 2025-08-13 | 13F | Raab & Moskowitz Asset Management LLC | 20 131 | 21,87 | 1 036 | 22,20 | ||||
| 2025-07-28 | 13F | Toews Corp /adv | 146 527 | 7 539 | ||||||
| 2025-08-13 | 13F | Mount Yale Investment Advisors, LLC | 3 997 | 206 | ||||||
| 2025-08-14 | 13F | Old Mission Capital Llc | 0 | −100,00 | 0 | |||||
| 2025-07-29 | NP | PSDM - PGIM Short Duration Multi-Sector Bond ETF | 75 000 | 4,46 | 3 855 | 4,36 | ||||
| 2025-08-08 | 13F | Pnc Financial Services Group, Inc. | 689 582 | 632,30 | 35 479 | 634,40 | ||||
| 2025-07-28 | 13F | J.Safra Asset Management Corp | 897 | 46 | ||||||
| 2025-08-14 | 13F/A | Rockefeller Capital Management L.P. | 784 825 | −3,22 | 40 379 | −2,96 | ||||
| 2025-08-14 | 13F | Great Valley Advisor Group, Inc. | 20 961 | 147,56 | 1 078 | 148,39 | ||||
| 2025-07-29 | NP | PULS - PGIM Ultra Short Bond ETF | 1 797 750 | 18,31 | 92 404 | 18,20 | ||||
| 2025-07-24 | 13F | MSH Capital Advisors LLC | 5 563 | −22,26 | 286 | −22,07 | ||||
| 2025-07-25 | 13F | Concurrent Investment Advisors, LLC | 80 313 | −79,71 | 4 132 | −79,65 | ||||
| 2025-08-14 | 13F | Raymond James Financial Inc | 843 900 | 30,90 | 43 419 | 31,26 | ||||
| 2025-05-08 | 13F | One Charles Private Wealth Services, LLC | 0 | −100,00 | 0 | −100,00 | ||||
| 2025-08-13 | 13F | EverSource Wealth Advisors, LLC | 294 821 | 19,90 | 15 169 | 20,23 | ||||
| 2025-08-14 | 13F | Mml Investors Services, Llc | 83 263 | 78,13 | 4 | 100,00 | ||||
| 2025-08-15 | 13F | Morgan Stanley | 3 128 135 | 15,02 | 160 943 | 15,33 | ||||
| 2025-08-14 | 13F | Wiley Bros.-aintree Capital, Llc | 3 908 | 241 | ||||||
| 2025-06-25 | NP | GTRAX - PGIM Global Total Return Fund Class A | 143 700 | 0,00 | 7 356 | −0,63 | ||||
| 2025-07-23 | 13F | Mraz, Amerine & Associates, Inc. | 27 178 | 271,03 | 1 398 | 272,80 | ||||
| 2025-08-12 | 13F | Proequities, Inc. | 0 | 0 | ||||||
| 2025-08-05 | 13F | Carolinas Wealth Consulting Llc | 0 | −100,00 | 0 | −100,00 | ||||
| 2025-08-11 | 13F | Principal Securities, Inc. | 1 069 | 55 | ||||||
| 2025-08-15 | 13F | Equitable Holdings, Inc. | 37 984 | 72,26 | 1 954 | 72,77 | ||||
| 2025-07-31 | 13F | Nilsine Partners, LLC | 157 036 | 13,18 | 8 080 | 13,49 | ||||
| 2025-08-06 | 13F | Middleton & Co Inc/ma | 84 010 | 2,25 | 4 322 | 2,54 | ||||
| 2025-08-12 | 13F | Financial Advocates Investment Management | 13 393 | −20,54 | 689 | −20,25 | ||||
| 2025-08-14 | 13F | Sunbelt Securities, Inc. | 0 | −100,00 | 0 | |||||
| 2025-07-29 | NP | PSH - PGIM Short Duration HIgh Yield ETF | 32 128 | 0,00 | 1 651 | −0,06 | ||||
| 2025-08-14 | 13F | Integrated Wealth Concepts LLC | 5 780 | 6,11 | 297 | 6,45 | ||||
| 2025-08-12 | 13F | BlueStem Wealth Partners, LLC | 0 | −100,00 | 0 | |||||
| 2025-08-12 | 13F | Prudential Financial Inc | 20 667 923 | 2,34 | 1 063 365 | 2,62 | ||||
| 2025-07-22 | 13F | Merit Financial Group, LLC | 42 857 | 66,58 | 2 205 | 66,97 | ||||
| 2025-08-13 | 13F | Saiph Capital, LLC | 4 863 | −25,74 | 250 | −25,60 | ||||
| 2025-08-13 | 13F | Basso Capital Management, L.p. | 90 000 | 4 630 | ||||||
| 2025-03-27 | NP | PAJBX - PGIM ESG Total Return Bond Fund Class R6 | 24 346 | 0,00 | 1 254 | 0,48 | ||||
| 2025-08-13 | 13F | Rsm Us Wealth Management Llc | 0 | −100,00 | 0 | |||||
| 2025-08-14 | 13F | Mpwm Advisory Solutions, Llc | 9 723 | 72,64 | 500 | 73,61 | ||||
| 2025-08-14 | 13F | Wells Fargo & Company/mn | 836 062 | 56,12 | 43 015 | 56,55 | ||||
| 2025-08-06 | 13F | New Millennium Group LLC | 0 | 0 | ||||||
| 2025-08-13 | 13F | Virtus Fixed Income Advisers, LLC | 22 155 | 1 140 | ||||||
| 2025-08-13 | 13F | Legacy Capital Wealth Partners, LLC | 7 095 | 0,00 | 365 | 0,27 | ||||
| 2025-07-16 | 13F | Register Financial Advisors LLC | 1 500 | 77 | ||||||
| 2025-07-16 | 13F | Essex Financial Services, Inc. | 78 736 | 75,63 | 4 051 | 76,09 | ||||
| 2025-07-29 | NP | PHYL - PGIM Active High Yield Bond ETF | 260 526 | 4,87 | 13 391 | 4,77 | ||||
| 2025-07-17 | 13F | Janney Montgomery Scott LLC | 53 336 | 71,60 | 3 | 100,00 | ||||
| 2025-08-01 | 13F | Pasadena Private Wealth, LLC | 19 407 | 998 | ||||||
| 2025-07-24 | 13F | IFP Advisors, Inc | 196 676 | −20,26 | 10 119 | −20,05 | ||||
| 2025-08-14 | 13F | UBS Group AG | 680 975 | 3,23 | 35 036 | 3,52 | ||||
| 2025-09-04 | 13F/A | Advisor Group Holdings, Inc. | 309 724 | −9,17 | 15 936 | −8,93 | ||||
| 2025-07-29 | NP | PAB - PGIM Active Aggregate Bond ETF | 63 525 | 6,19 | 3 265 | 6,11 | ||||
| 2025-08-13 | 13F | Virtus Investment Advisers, Inc. | 0 | −100,00 | 0 | |||||
| 2025-07-09 | 13F | Breakwater Capital Group | 13 537 | 696 | ||||||
| 2025-08-05 | 13F | Atlas Wealth LLC | 111 315 | 9,31 | 5 704 | 9,15 | ||||
| 2025-08-11 | 13F | Alteri Wealth LLC | 7 861 | 23,72 | 404 | 23,93 | ||||
| 2025-06-26 | NP | PHEAX - PGIM Global Total Return (USD Hedged) Fund Class A | 40 859 | 0,00 | 2 092 | −0,67 | ||||
| 2025-08-07 | 13F | Winch Advisory Services, LLC | 7 | 0 | ||||||
| 2025-08-15 | 13F | Asset Allocation Strategies LLC | 26 897 | 0,88 | 1 384 | 1,10 | ||||
| 2025-08-05 | 13F | Bridgewater Advisors Inc. | 4 498 | 231 | ||||||
| 2025-08-13 | 13F | Baird Financial Group, Inc. | 18 797 | 967 | ||||||
| 2025-07-11 | 13F | Farther Finance Advisors, LLC | 1 428 | 81,22 | 73 | 82,50 | ||||
| 2025-07-25 | 13F | We Are One Seven, LLC | 81 391 | 4,76 | 4 188 | 5,04 | ||||
| 2025-07-31 | 13F | Cambridge Investment Research Advisors, Inc. | 171 349 | 18,86 | 9 | 14,29 | ||||
| 2025-08-15 | 13F | Prevail Innovative Wealth Advisors, Llc | 31 365 | 1 614 | ||||||
| 2025-08-14 | 13F | Main Street Financial Solutions, LLC | 44 483 | −15,95 | 2 289 | −15,73 | ||||
| 2025-08-13 | 13F | Renaissance Technologies Llc | 857 693 | −22,68 | 44 128 | −22,47 | ||||
| 2025-07-23 | 13F | Country Club Bank /gfn | 158 582 | −0,25 | 8 159 | 0,12 | ||||
| 2025-08-27 | 13F/A | Brinker Capital Investments, LLC | 26 804 | 1 379 | ||||||
| 2025-07-25 | 13F | Priebe Wealth Holdings LLC | 15 610 | −32,12 | 803 | −31,89 | ||||
| 2025-08-01 | 13F | Brookwood Investment Group LLC | 0 | −100,00 | 0 | |||||
| 2025-08-15 | 13F/A | Symphony Financial, Ltd. Co. | 6 578 | 337 | ||||||
| 2025-08-13 | 13F | Vertex Planning Partners, LLC | 0 | −100,00 | 0 | |||||
| 2025-08-06 | 13F | Paladin Advisory Group, LLC | 467 | 0,00 | 24 | 4,35 | ||||
| 2025-08-12 | 13F | AlphaCore Capital LLC | 100 | 5 | ||||||
| 2025-08-14 | 13F | GWM Advisors LLC | 20 568 | 230,46 | 1 058 | 231,66 | ||||
| 2025-07-17 | 13F | KWB Wealth | 51 770 | 28,09 | 2 656 | 28,37 | ||||
| 2025-07-29 | NP | HYSAX - PGIM Short Duration High Yield Income Fund Class A | 925 000 | 0,00 | 47 545 | −0,10 | ||||
| 2025-07-10 | 13F | Community Trust & Investment Co | 194 741 | −0,79 | 10 019 | −0,52 | ||||
| 2025-08-13 | 13F | Quadrature Capital Ltd | 113 883 | 561,73 | 5 861 | 563,65 | ||||
| 2025-07-10 | 13F | Wealth Enhancement Advisory Services, Llc | 322 421 | 22,18 | 16 537 | 22,13 | ||||
| 2025-07-03 | 13F | Collective Family Office Llc | 25 728 | 60,25 | 1 324 | 60,75 | ||||
| 2025-07-18 | 13F | Cooper Financial Group | 9 001 | 2,27 | 463 | 2,66 | ||||
| 2025-08-06 | 13F | Able Wealth Management LLC | 8 232 | 424 | ||||||
| 2025-08-01 | 13F | Envestnet Asset Management Inc | 276 625 | −7,72 | 14 232 | −7,47 | ||||
| 2025-08-05 | 13F | Westside Investment Management, Inc. | 10 175 | 524 | ||||||
| 2025-08-07 | 13F | Kestra Private Wealth Services, Llc | 497 745 | 89,57 | 25 609 | 90,08 | ||||
| 2025-08-15 | 13F | Kestra Advisory Services, LLC | 55 528 | 19,97 | 2 857 | 20,30 | ||||
| 2025-08-14 | 13F | Comerica Bank | 6 815 | 86,56 | 351 | 87,17 | ||||
| 2025-07-21 | 13F | Andina Capital Management, LLC | 30 056 | 7,62 | 1 546 | 7,96 | ||||
| 2025-08-13 | 13F | Level Four Advisory Services, Llc | 107 286 | 5 520 | ||||||
| 2025-07-10 | 13F | Worth Asset Management, LLC | 20 377 | −2,16 | 1 048 | −1,87 | ||||
| 2025-08-08 | 13F | Cooper Capital Advisors LLC | 157 730 | −2,28 | 8 115 | −2,02 | ||||
| 2025-08-12 | 13F | Running Point Capital Advisors, LLC | 26 457 | 70,57 | 1 361 | 71,19 | ||||
| 2025-07-14 | 13F | Lakeshore Financial Planning, Inc. | 19 702 | 0,00 | 1 014 | 0,30 | ||||
| 2025-07-24 | 13F | Aurora Private Wealth, Inc. | 3 917 | 0 | ||||||
| 2025-07-22 | 13F | DAVENPORT & Co LLC | 13 771 | 92,60 | 709 | 93,44 | ||||
| 2025-08-12 | 13F | Steward Partners Investment Advisory, Llc | 189 436 | 236,04 | 9 747 | 237,00 | ||||
| 2025-08-08 | 13F | Cornerstone Advisors Asset Management, Inc | 18 906 | 1,35 | 973 | 1,57 | ||||
| 2025-08-12 | 13F | Inscription Capital, LLC | 183 522 | 9 442 | ||||||
| 2025-05-16 | 13F | Laidlaw Wealth Management LLC | 0 | −100,00 | 0 | |||||
| 2025-07-14 | 13F | U.S. Capital Wealth Advisors, LLC | 163 744 | 2,66 | 8 425 | 2,95 | ||||
| 2025-08-13 | 13F | Fiduciary Group LLC | 256 521 | 0,65 | 13 198 | 0,93 | ||||
| 2025-07-31 | 13F | Hartford Financial Management Inc. | 184 454 | 5,96 | 9 490 | 6,25 | ||||
| 2025-07-30 | 13F | D.a. Davidson & Co. | 19 750 | 0,00 | 1 016 | 0,30 | ||||
| 2025-07-21 | 13F | Ameritas Advisory Services, LLC | 185 436 | −63,25 | 9 541 | −63,15 | ||||
| 2025-08-06 | 13F | Commonwealth Equity Services, Llc | 538 487 | 57,47 | 28 | 58,82 | ||||
| 2025-08-13 | 13F | Denver Wealth Management, Inc. | 33 499 | 1 724 | ||||||
| 2025-08-12 | 13F | Jpmorgan Chase & Co | 733 258 | −38,79 | 37 726 | −38,63 | ||||
| 2025-07-15 | 13F | Sheets Smith Wealth Management | 10 789 | 26,29 | 555 | 26,71 | ||||
| 2025-07-24 | 13F | Ronald Blue Trust, Inc. | 6 046 | 91,51 | 311 | 93,17 | ||||
| 2025-07-28 | 13F | WealthPLAN Partners, LLC | 178 769 | 141,13 | 9 198 | 141,77 | ||||
| 2025-08-05 | 13F | Optivise Advisory Services LLC | 13 301 | 5,20 | 684 | 5,56 | ||||
| 2025-08-11 | 13F | Advisor Resource Council | 15 205 | 25,23 | 782 | 28,83 | ||||
| 2025-08-12 | 13F | Laurel Wealth Advisors LLC | 0 | −100,00 | 0 | |||||
| 2025-07-28 | 13F | Triton Wealth Management, PLLC | 86 855 | 1 776,32 | 4 467 | 1 792,37 | ||||
| 2025-07-29 | 13F | Private Trust Co Na | 6 446 | 28,92 | 332 | 29,30 | ||||
| 2025-07-31 | 13F | Oppenheimer & Co Inc | 19 801 | 26,91 | 1 019 | 27,25 | ||||
| 2025-08-07 | 13F | Nwam Llc | 11 223 | 15,39 | 578 | 15,63 | ||||
| 2025-08-04 | 13F | Atria Investments Llc | 33 339 | −62,02 | 1 715 | −61,92 | ||||
| 2025-04-29 | 13F | Hm Payson & Co | 29 359 | 0,00 | 1 506 | 0,20 | ||||
| 2025-08-08 | 13F | Kingsview Wealth Management, LLC | 96 658 | −22,37 | 4 973 | −22,15 | ||||
| 2025-07-23 | 13F | Prime Capital Investment Advisors, LLC | 24 500 | 9,13 | 1 261 | 9,47 | ||||
| 2025-06-25 | NP | PGIM Short Duration High Yield Opportunities Fund | 307 811 | 0,00 | 15 757 | −0,64 | ||||
| 2025-07-28 | 13F | Harbour Investments, Inc. | 19 503 | −9,14 | 1 003 | −8,90 | ||||
| 2025-07-29 | NP | JDYRX - PGIM HIGH YIELD FUND Class R | 1 867 500 | 22,90 | 95 990 | 22,78 | ||||
| 2025-08-14 | 13F | Pine Harbor Wealth Management, LLC | 538 354 | 9,72 | 27 698 | 10,02 | ||||
| 2025-08-12 | 13F | Accordant Advisory Group Inc | 0 | −100,00 | 0 | |||||
| 2025-07-18 | 13F | Truist Financial Corp | 155 613 | 2,45 | 8 006 | 2,73 | ||||
| 2025-08-06 | 13F | Golden State Wealth Management, LLC | 10 917 | 13,09 | 562 | 13,33 | ||||
| 2025-08-27 | NP | PIBAX - PGIM BALANCED FUND Class A | 203 465 | 0,00 | 10 468 | 0,28 | ||||
| 2025-07-10 | 13F | Secure Asset Management, LLC | 5 393 | 277 | ||||||
| 2025-08-07 | 13F | Americana Partners, LLC | 13 800 | 0,00 | 710 | 0,28 | ||||
| 2025-08-11 | 13F | Addison Capital Co | 17 009 | 20,67 | 875 | 21,02 | ||||
| 2025-08-14 | 13F | Royal Bank Of Canada | 165 508 | 195,27 | 8 515 | 196,07 | ||||
| 2025-07-10 | 13F | Signal Advisors Wealth, LLC | 106 608 | 894,11 | 5 485 | 897,09 | ||||
| 2025-08-12 | 13F | Calton & Associates, Inc. | 8 334 | 429 | ||||||
| 2025-07-14 | 13F | AdvisorNet Financial, Inc | 21 925 | 1 128 | ||||||
| 2025-07-07 | 13F | Trust Co Of Oklahoma | 6 985 | 0,00 | 359 | 0,28 | ||||
| 2025-08-12 | 13F | Integrated Advisors Network LLC | 7 376 | 379 | ||||||
| 2025-07-29 | NP | PTRB - PGIM Total Return Bond ETF | 416 656 | 4,44 | 21 416 | 4,35 | ||||
| 2025-07-29 | 13F | Stratos Wealth Partners, LTD. | 28 223 | 5,46 | 1 452 | 5,75 | ||||
| 2025-08-13 | 13F | Townsquare Capital Llc | 0 | −100,00 | 0 | |||||
| 2025-07-30 | 13F | Bogart Wealth, LLC | 290 | 15 | ||||||
| 2025-06-25 | NP | Prudential Short Duration High Yield Fund, Inc. | 303 020 | 0,00 | 15 512 | −0,64 | ||||
| 2025-08-14 | 13F | Citadel Advisors Llc | 278 138 | 14 310 | ||||||
| 2025-06-25 | NP | PDBAX - PGIM TOTAL RETURN BOND FUND Class A | 1 740 083 | 36,35 | 89 075 | 35,47 | ||||
| 2025-08-08 | 13F | Avantax Advisory Services, Inc. | 217 716 | 5,70 | 11 201 | 5,98 | ||||
| 2025-08-14 | 13F | Fiduciary Trust Co | 6 000 | 0,00 | 309 | 0,33 | ||||
| 2025-07-22 | 13F | Mascoma Wealth Management LLC | 488 | 0,00 | 25 | 0,00 | ||||
| 2025-08-12 | 13F | LPL Financial LLC | 2 894 780 | 11,90 | 148 936 | 12,21 | ||||
| 2025-08-14 | 13F | Stifel Financial Corp | 70 018 | 44,83 | 3 602 | 45,24 | ||||
| 2025-07-07 | 13F | Insight Wealth Strategies, LLC | 18 406 | −11,48 | 943 | −11,54 | ||||
| 2025-07-15 | 13F | Norden Group Llc | 1 284 302 | −22,43 | 66 077 | −22,22 | ||||
| 2025-08-11 | 13F | Private Advisor Group, LLC | 58 015 | 21,84 | 2 985 | 22,14 | ||||
| 2025-06-25 | NP | SDMAX - PGIM Short Duration Multi-Sector Bond Fund Class A | 1 495 772 | 15,62 | 76 569 | 14,87 | ||||
| 2025-07-09 | 13F | Fiduciary Alliance LLC | 15 673 | 806 | ||||||
| 2025-08-08 | 13F | Tanglewood Legacy Advisors, LLC | 203 754 | −9,54 | 10 483 | −9,29 | ||||
| 2025-07-25 | NP | PMSAX - Global Multi-Strategy Fund Class A | 35 525 | 1 826 | ||||||
| 2025-08-26 | NP | PSFRX - Virtus Newfleet Senior Floating Rate Fund Class A | 22 155 | 12,21 | 1 140 | 12,44 | ||||
| 2025-08-06 | 13F | Prospera Financial Services Inc | 56 457 | −9,24 | 2 905 | −8,99 | ||||
| 2025-08-14 | 13F | Potentia Wealth | 0 | −100,00 | 0 | |||||
| 2025-07-11 | 13F | Pinnacle Bancorp, Inc. | 212 | 11 | ||||||
| 2025-07-29 | 13F | Koshinski Asset Management, Inc. | 41 887 | 2,48 | 2 155 | 2,77 | ||||
| 2025-08-14 | 13F | Gotham Asset Management, LLC | 16 728 | 2,25 | 861 | 2,50 | ||||
| 2025-08-01 | 13F | Liberty Wealth Management Llc | 0 | −100,00 | 0 | −100,00 | ||||
| 2025-08-13 | 13F | Great Diamond Partners, LLC | 36 346 | 1 870 | ||||||
| 2025-08-14 | 13F | Bank Of America Corp /de/ | 5 219 399 | 21,80 | 268 538 | 22,13 | ||||
| 2025-08-14 | 13F | Objective Capital Management, LLC | 0 | −100,00 | 0 | |||||
| 2025-03-27 | NP | PGIJX - PGIM ESG Short Duration Multi-Sector Bond Fund C | 16 988 | 0,00 | 875 | 0,46 | ||||
| 2025-08-12 | 13F | J.w. Cole Advisors, Inc. | 27 864 | 103,86 | 1 434 | 104,42 | ||||
| 2025-08-08 | 13F | Creative Planning | 4 234 | 218 | ||||||
| 2025-05-14 | 13F | Jane Street Group, Llc | 0 | −100,00 | 0 | |||||
| 2025-08-08 | 13F | Principal Financial Group Inc | 35 525 | 32,80 | 1 828 | 33,16 | ||||
| 2025-06-26 | NP | TAIBX - PGIM CORE BOND FUND Class Z | 1 800 878 | 39,20 | 92 187 | 38,31 | ||||
| 2025-07-18 | 13F | Parsons Capital Management Inc/ri | 8 067 | 0,00 | 415 | 0,48 | ||||
| 2025-08-05 | 13F | Everest Management Corp. | 11 622 | −6,69 | 598 | −6,57 | ||||
| 2025-07-15 | 13F | Regatta Capital Group, Llc | 5 459 | 281 | ||||||
| 2025-08-04 | 13F | Flagship Harbor Advisors, Llc | 99 772 | −67,61 | 5 133 | −67,52 | ||||
| 2025-07-22 | 13F | Foguth Wealth Management, LLC. | 108 014 | 907,22 | 5 557 | 910,36 | ||||
| 2025-08-13 | 13F | Jones Financial Companies Lllp | 1 423 466 | 43,00 | 73 237 | 43,53 | ||||
| 2025-08-11 | 13F | Independent Advisor Alliance | 8 500 | 437 | ||||||
| 2025-05-14 | 13F | Flow Traders U.s. Llc | 0 | −100,00 | 0 | |||||
| 2025-07-03 | 13F | TrueWealth Advisors, LLC | 5 100 | −3,41 | 262 | −2,96 | ||||
| 2025-07-25 | 13F | Atria Wealth Solutions, Inc. | 9 254 | −33,74 | 476 | −33,52 | ||||
| 2025-08-04 | 13F | Integrity Alliance, Llc. | 9 240 | 475 | ||||||
| 2025-07-24 | 13F | Riverchase Wealth Management, Llc | 6 778 | 38,72 | 349 | 39,20 | ||||
| 2025-08-04 | 13F | WNY Asset Management, LLC | 7 521 | 387 | ||||||
| 2025-08-11 | 13F | HighTower Advisors, LLC | 147 081 | 21,58 | 7 567 | 21,93 | ||||
| 2025-08-14 | 13F | Acorn Wealth Advisors, LLC | 0 | −100,00 | 0 | |||||
| 2025-05-14 | 13F | Straightline Group Llc | 0 | −100,00 | 0 | |||||
| 2025-06-26 | NP | PADAX - PGIM Absolute Return Bond Fund Class A | 1 797 750 | 38,96 | 92 027 | 38,07 | ||||
| 2025-08-12 | 13F | MAI Capital Management | 10 400 | 1,24 | 535 | 1,52 | ||||
| 2025-07-29 | NP | PGVAX - PGIM GOVERNMENT INCOME FUND Class A | 25 000 | 1 285 |