Grunnleggende statistikk
| Institusjonelle eiere | 348 total, 345 long only, 0 short only, 3 long/short - change of 11,54% MRQ |
| Gjennomsnittlig porteføljeallokering | 0.0586 % - change of −1,90% MRQ |
| Institusjonelle aksjer (Long) | 194 684 001 (ex 13D/G) - change of 30,90MM shares 18,86% MRQ |
| Institusjonell verdi (Long) | $ 955 826 USD ($1000) |
Institusjonelt eierskap og aksjonærer
Mizuho Financial Group, Inc. - Depositary Receipt (Common Stock) (US:MFG) har 348 institusjonelle eiere og aksjonærer som har sendt inn 13D/G- eller 13F-skjemaer til Securities Exchange Commission (SEC). Disse institusjonene eier til sammen 194,684,001 aksjer. De største aksjonærene inkluderer Morgan Stanley, Fmr Llc, Lazard Asset Management Llc, Goldman Sachs Group Inc, Bank Of America Corp /de/, BlackRock, Inc., Northern Trust Corp, CIBC Private Wealth Group, LLC, Natixis Advisors, L.p., and Millennium Management Llc .
Mizuho Financial Group, Inc. - Depositary Receipt (Common Stock) (NYSE:MFG) institusjonell eierstruktur viser nåværende posisjoner i selskapet fordelt på institusjoner og fond, samt de siste endringene i posisjonsstørrelse. De største aksjonærene kan være individuelle investorer, verdipapirfond, hedgefond eller institusjoner. Schedule 13D indikerer at investoren eier (eller har eid) mer enn 5 % av selskapet og har til hensikt (eller hadde til hensikt) å aktivt forfølge en endring i forretningsstrategien. Schedule 13G indikerer en passiv investering på over 5 %.
The share price as of September 10, 2025 is 6,71 / share. Previously, on September 11, 2024, the share price was 4,00 / share. This represents an increase of 67,75% over that period.

Fondssentiment-score
Fondssentiment Score (også kjent som akkumulering av eierskap poengsum) viser hvilke aksjer som er mest kjøpt av fond. Den er resultatet av en sofistikert, kvantitativ flerfaktormodell som identifiserer selskaper med de høyeste nivåene av institusjonell akkumulering. Beregningsmodellen for poeng bruker en kombinasjon av den totale økningen i antall offentliggjorte eiere, endringer i porteføljeallokeringen til disse eierne og andre beregninger. Tallet går fra 0 til 100, der høyere tall indikerer en høyere grad av akkumulering i forhold til sammenlignbare selskaper, der 50 er gjennomsnittet.
Oppdateringsfrekvens: Daglig
Sjekk ut Ownership Explorer, som inneholder en liste over de høyest rangerte selskapene.
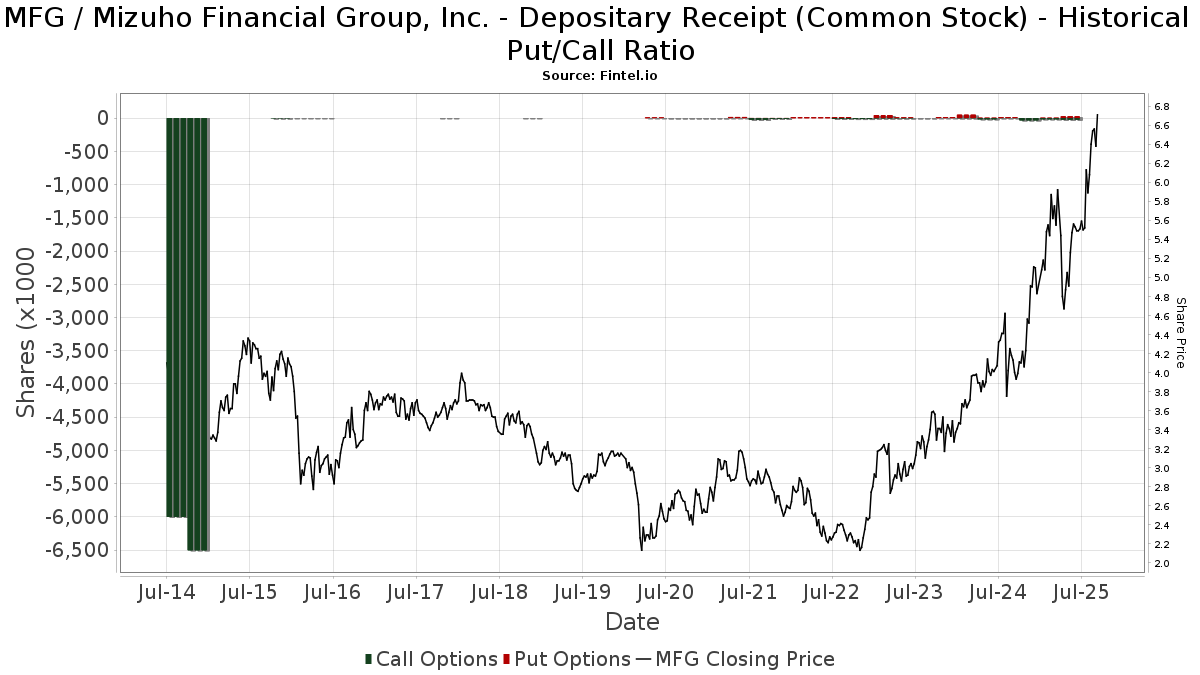
Institusjonell Put/Call-forhold
I tillegg til å rapportere standard aksje- og gjeldsemisjoner må institusjoner med mer enn 100 millioner kroner i forvaltningskapital også oppgi beholdningen av put- og callopsjoner. Siden put-opsjoner generelt indikerer et negativt sentiment, og call-opsjoner indikerer et positivt sentiment, kan vi få et inntrykk av det generelle institusjonelle sentimentet ved å plotte forholdet mellom put- og call-opsjoner. Diagrammet til høyre viser det historiske forholdet mellom put- og call-opsjoner for dette instrumentet.
Ved å bruke Put/Call-forholdet som en indikator på investorsentimentet kan man overvinne en av de viktigste svakhetene ved å bruke totalt institusjonelt eierskap, nemlig at en betydelig andel av forvaltningskapitalen investeres passivt for å følge indekser. Passivt forvaltede fond kjøper vanligvis ikke opsjoner, slik at indikatoren for put/call-forhold i større grad gjenspeiler stemningen i aktivt forvaltede fond.
13F- og NPORT-arkiveringer
Detaljer om 13F-arkiveringer er gratis. Detaljer om NP-arkiveringer krever et premium-medlemskap. Grønne rader indikerer nye posisjoner. Røde rader indikerer lukkede posisjoner. Klikk på lenke ikonet for å se hele transaksjonshistorikken.
Oppgrader
for å låse opp premiedata og eksportere til Excel. ![]() .
.
| Fildato | Kilde | Investor | Type | Gjennomsnittlig pris (estimert) |
Aksjer | Δ Aksjer (%) |
Rapportert verdi ($1000) | Verdi (%) | Portallokering (%) | |
|---|---|---|---|---|---|---|---|---|---|---|
| 2025-07-17 | 13F | Western Financial Corp/CA | 13 788 | 77 | ||||||
| 2025-07-22 | 13F | Marks Group Wealth Management, Inc | 21 681 | −17,68 | 121 | −17,24 | ||||
| 2025-08-04 | 13F | Center for Financial Planning, Inc. | 0 | −100,00 | 0 | |||||
| 2025-08-07 | 13F | Sierra Ocean, Llc | 10 634 | 0,00 | 59 | 1,72 | ||||
| 2025-07-24 | 13F | PDS Planning, Inc | 73 798 | 4,86 | 410 | 5,94 | ||||
| 2025-08-14 | 13F | Kovitz Investment Group Partners, LLC | 18 172 | 4,42 | 101 | 6,32 | ||||
| 2025-08-14 | 13F | Snowden Capital Advisors LLC | 29 032 | −15,85 | 161 | −15,26 | ||||
| 2025-08-14 | 13F | Voloridge Investment Management, Llc | 735 703 | 4 091 | ||||||
| 2025-08-13 | 13F | Jones Financial Companies Lllp | 7 446 | 106,15 | 41 | 105,00 | ||||
| 2025-07-15 | 13F | Ballentine Partners, LLC | 143 695 | 8,46 | 799 | 9,47 | ||||
| 2025-07-16 | 13F | Five Oceans Advisors | 49 492 | −4,05 | 275 | −3,17 | ||||
| 2025-08-08 | 13F | Larson Financial Group LLC | 1 258 | 243,72 | 7 | 200,00 | ||||
| 2025-08-06 | 13F | Savant Capital, LLC | 55 064 | 62,83 | 306 | 64,52 | ||||
| 2025-08-27 | 13F/A | Brinker Capital Investments, LLC | 464 073 | −16,29 | 2 580 | −15,52 | ||||
| 2025-08-05 | 13F | Bank Of Montreal /can/ | 261 262 | −4,92 | 1 453 | −4,10 | ||||
| 2025-08-14 | 13F | Ameriprise Financial Inc | 138 728 | −2,59 | 771 | −1,66 | ||||
| 2025-08-13 | 13F | Guggenheim Capital Llc | 39 441 | −3,33 | 219 | −2,23 | ||||
| 2025-08-14 | 13F | Jane Street Group, Llc | 68 834 | 383 | ||||||
| 2025-08-14 | 13F | Group One Trading, L.p. | 0 | −100,00 | 0 | −100,00 | ||||
| 2025-08-13 | 13F | Lido Advisors, LLC | 30 622 | 12,01 | 170 | 13,33 | ||||
| 2025-08-05 | 13F | Huntington National Bank | 30 896 | −7,03 | 172 | −6,56 | ||||
| 2025-07-10 | 13F | Wealth Enhancement Advisory Services, Llc | 75 565 | −10,41 | 425 | −8,41 | ||||
| 2025-07-17 | 13F | BayBridge Capital Group, LLC | 48 068 | 5,94 | 267 | 6,80 | ||||
| 2025-08-13 | 13F | Marshall Wace, Llp | 545 845 | 3 035 | ||||||
| 2025-07-31 | 13F | BIP Alliance, LLC | 10 309 | −0,25 | 57 | 1,79 | ||||
| 2025-07-25 | 13F | Allspring Global Investments Holdings, LLC | 105 610 | 3,83 | 590 | 7,29 | ||||
| 2025-07-30 | 13F | Whittier Trust Co | 1 240 | 7 | ||||||
| 2025-08-14 | 13F | Lazard Asset Management Llc | 18 777 631 | −16,05 | 104 | −15,45 | ||||
| 2025-08-12 | 13F | MAI Capital Management | 11 331 | 385,89 | 63 | 425,00 | ||||
| 2025-05-09 | 13F | R Squared Ltd | 0 | −100,00 | 0 | |||||
| 2025-05-01 | 13F | Schechter Investment Advisors, LLC | 188 056 | −6,45 | 1 036 | 5,50 | ||||
| 2025-07-16 | 13F/A | CX Institutional | 320 | 0,00 | 0 | |||||
| 2025-07-25 | 13F | We Are One Seven, LLC | 20 427 | 4,38 | 114 | 5,61 | ||||
| 2025-08-14 | 13F | Tudor Investment Corp Et Al | 333 564 | −9,91 | 1 855 | −9,12 | ||||
| 2025-08-12 | 13F | AlphaCore Capital LLC | 44 058 | 245 | ||||||
| 2025-08-12 | 13F | Coldstream Capital Management Inc | 52 454 | 6,53 | 292 | 7,38 | ||||
| 2025-08-14 | 13F | Stifel Financial Corp | 287 445 | 60,23 | 1 598 | 61,74 | ||||
| 2025-07-28 | 13F | Harbour Investments, Inc. | 1 484 | 0,00 | 8 | 0,00 | ||||
| 2025-08-13 | 13F | M&t Bank Corp | 350 051 | −6,07 | 1 946 | −5,21 | ||||
| 2025-08-07 | 13F | Guardian Capital Lp | 56 403 | 0,00 | 314 | 0,97 | ||||
| 2025-08-22 | NP | MLMIX - Global Core Portfolio Class I | 105 495 | 101,79 | 587 | 103,47 | ||||
| 2025-08-11 | 13F | Rothschild Investment Llc | 6 171 | 2,97 | 34 | 3,03 | ||||
| 2025-07-23 | 13F | Canopy Partners, LLC | 11 870 | 0,00 | 66 | 0,00 | ||||
| 2025-08-13 | 13F | Invesco Ltd. | 25 971 | −5,13 | 144 | −4,00 | ||||
| 2025-07-25 | 13F | Cwm, Llc | 23 391 | −2,40 | 0 | |||||
| 2025-08-13 | 13F | Sanibel Captiva Trust Company, Inc. | 10 604 | 0,00 | 59 | 0,00 | ||||
| 2025-08-12 | 13F | Aviso Financial Inc. | 112 685 | −9,80 | 627 | −9,01 | ||||
| 2025-08-07 | 13F | Addison Advisors LLC | 50 279 | 2,46 | 280 | 3,33 | ||||
| 2025-08-12 | 13F | CIBC Private Wealth Group, LLC | 7 420 346 | 421 990,22 | 41 257 | 589 285,71 | ||||
| 2025-07-24 | 13F | Us Bancorp \de\ | 763 985 | −1,84 | 4 248 | −0,96 | ||||
| 2025-08-14 | 13F | Colony Group, LLC | 84 168 | 61,97 | 468 | 63,29 | ||||
| 2025-08-11 | 13F | Dorsey & Whitney Trust CO LLC | 82 409 | 3,71 | 458 | 4,81 | ||||
| 2025-07-22 | 13F | Valeo Financial Advisors, LLC | 44 386 | 2,81 | 247 | 3,80 | ||||
| 2025-04-23 | 13F | Mascagni Wealth Management, Inc. | 0 | −100,00 | 0 | |||||
| 2025-05-13 | 13F | Qtron Investments LLC | 0 | −100,00 | 0 | |||||
| 2025-07-28 | 13F | Private Wealth Asset Management, LLC | 316 | 0,00 | 2 | 0,00 | ||||
| 2025-05-15 | 13F | Engineers Gate Manager LP | 0 | −100,00 | 0 | |||||
| 2025-07-28 | 13F | Axxcess Wealth Management, Llc | 21 407 | −20,68 | 119 | −19,59 | ||||
| 2025-05-15 | 13F | Two Sigma Securities, Llc | 0 | −100,00 | 0 | −100,00 | ||||
| 2025-08-13 | 13F | West Family Investments, Inc. | 76 793 | 42,54 | 427 | 43,92 | ||||
| 2025-08-14 | 13F | Mercer Global Advisors Inc /adv | 213 534 | 18,53 | 1 187 | 19,66 | ||||
| 2025-07-18 | 13F | Ewa, Llc | 36 752 | −0,02 | 204 | 0,99 | ||||
| 2025-08-14 | 13F | Goldman Sachs Group Inc | 14 446 178 | −0,43 | 80 321 | 0,47 | ||||
| 2025-04-18 | NP | AVIV - Avantis International Large Cap Value ETF This fund is a listed as child fund of American Century Companies Inc and if that institution has disclosed ownership in this security, then these positions will not be double counted when calculating total shares and total value | 276 032 | 0,00 | 1 557 | 10,98 | ||||
| 2025-08-14 | 13F | EP Wealth Advisors, Inc. | 12 261 | 68 | ||||||
| 2025-08-14 | 13F | Riggs Asset Managment Co. Inc. | 1 238 | 7 | ||||||
| 2025-07-18 | 13F | Truist Financial Corp | 16 286 | 0,52 | 91 | 1,12 | ||||
| 2025-08-07 | 13F | Legacy Financial Advisors, Inc. | 0 | −100,00 | 0 | |||||
| 2025-08-12 | 13F | Clear Street Markets Llc | 45 371 | 252 | ||||||
| 2025-07-09 | 13F | Sapient Capital Llc | 0 | −100,00 | 0 | |||||
| 2025-08-05 | 13F | GPS Wealth Strategies Group, LLC | 50 | 108,33 | 0 | |||||
| 2025-08-13 | 13F | EverSource Wealth Advisors, LLC | 30 518 | 141,67 | 170 | 144,93 | ||||
| 2025-07-08 | 13F | Rise Advisors, LLC | 1 | 0,00 | 0 | |||||
| 2025-08-13 | 13F | Quadrature Capital Ltd | 106 623 | 592 | ||||||
| 2025-08-14 | 13F | Principia Wealth Advisory, LLC | 240 | 1 | ||||||
| 2025-07-31 | 13F | Buckingham Strategic Partners | 34 054 | 12,67 | 189 | 13,86 | ||||
| 2025-08-14 | 13F | Millennium Management Llc | 3 360 929 | 387,67 | 18 687 | 392,13 | ||||
| 2025-08-14 | 13F | Schonfeld Strategic Advisors LLC | 28 812 | 160 | ||||||
| 2025-08-14 | 13F | Glenmede Investment Management, LP | 65 793 | 366 | ||||||
| 2025-07-15 | 13F | Financial Management Professionals, Inc. | 1 891 | 11 | ||||||
| 2025-08-13 | 13F | Hsbc Holdings Plc | 19 745 | −6,89 | 110 | −6,03 | ||||
| 2025-07-30 | 13F | Forum Financial Management, LP | 353 511 | −2,91 | 1 966 | −2,04 | ||||
| 2025-07-21 | 13F | Empirical Financial Services, LLC d.b.a. Empirical Wealth Management | 28 853 | 59,69 | 160 | 61,62 | ||||
| 2025-08-14 | 13F | CIBC World Markets Inc. | 165 436 | 27,05 | 920 | 28,17 | ||||
| 2025-07-15 | 13F | Fifth Third Bancorp | 5 674 | 35,06 | 32 | 34,78 | ||||
| 2025-08-14 | 13F | Principal Street Partners, LLC | 51 616 | 106,56 | 287 | 108,76 | ||||
| 2025-08-12 | 13F | New Republic Capital, LLC | 13 959 | −15,39 | 78 | −14,44 | ||||
| 2025-05-05 | 13F | Lindbrook Capital, Llc | 25 180 | 14,45 | 139 | 28,97 | ||||
| 2025-08-07 | 13F | Acadian Asset Management Llc | 7 208 | −47,24 | 0 | |||||
| 2025-07-16 | 13F | Traveka Wealth, LLC | 13 832 | 3,06 | 77 | 4,11 | ||||
| 2025-08-21 | NP | LAZARD RETIREMENT SERIES INC - Lazard Retirement Global Dynamic Multi-Asset Portfolio Investor Shares | 58 588 | −15,01 | 326 | −14,25 | ||||
| 2025-07-28 | NP | AVSD - Avantis Responsible International Equity ETF | 77 566 | 0,00 | 431 | −1,37 | ||||
| 2025-08-14 | 13F | Wetherby Asset Management Inc | 213 671 | 3,07 | 1 188 | 17,28 | ||||
| 2025-08-13 | 13F | Cheviot Value Management, LLC | 418 | 0,00 | 3 | 0,00 | ||||
| 2025-07-10 | 13F | Trust Point Inc. | 22 215 | 0,96 | 124 | 1,65 | ||||
| 2025-04-29 | 13F | Chilton Capital Management Llc | 0 | −100,00 | 0 | |||||
| 2025-08-07 | 13F | Vise Technologies, Inc. | 237 678 | 57,41 | 1 321 | 79,00 | ||||
| 2025-08-13 | 13F | Renaissance Technologies Llc | 2 291 703 | 14,49 | 12 742 | 15,52 | ||||
| 2025-08-07 | 13F | Parkside Financial Bank & Trust | 2 786 | −19,36 | 15 | −21,05 | ||||
| 2025-08-14 | 13F | Wells Fargo & Company/mn | 2 365 338 | −18,09 | 13 151 | −17,35 | ||||
| 2025-07-11 | 13F | Farther Finance Advisors, LLC | 25 091 | 20,01 | 140 | 23,01 | ||||
| 2025-08-12 | 13F | American Century Companies Inc | 2 859 999 | 0,51 | 15 902 | 1,43 | ||||
| 2025-05-15 | 13F | Glenmede Trust Co Na | 73 457 | −6,80 | 405 | 4,94 | ||||
| 2025-08-14 | 13F | Caisse De Depot Et Placement Du Quebec | 1 660 800 | 9 234 | ||||||
| 2025-07-29 | 13F | Werba Rubin Papier Wealth Management | 34 150 | −4,49 | 190 | −4,06 | ||||
| 2025-08-04 | 13F | Atria Investments Llc | 67 721 | −15,11 | 377 | −14,35 | ||||
| 2025-08-12 | 13F | Dimensional Fund Advisors Lp | 568 631 | −0,99 | 3 162 | −0,09 | ||||
| 2025-07-17 | 13F | CogentBlue Wealth Advisors, LLC | 16 146 | 6,08 | 90 | 7,23 | ||||
| 2025-08-04 | 13F | Syverson Strege & Co | 48 761 | 271 | ||||||
| 2025-08-14 | 13F | Bank Of America Corp /de/ | 12 386 087 | −16,96 | 68 867 | −16,21 | ||||
| 2025-07-16 | 13F | Kathmere Capital Management, LLC | 20 125 | −4,78 | 112 | −4,31 | ||||
| 2025-07-31 | 13F | Prudent Man Advisors, LLC | 20 870 | 2,29 | 116 | 3,57 | ||||
| 2025-07-24 | 13F | IFP Advisors, Inc | 2 324 | −20,98 | 13 | −25,00 | ||||
| 2025-08-04 | 13F | Haven Private, LLC | 14 214 | 79 | ||||||
| 2025-04-17 | 13F | Janney Montgomery Scott LLC | 0 | −100,00 | 0 | |||||
| 2025-08-13 | 13F | Capital Analysts, Inc. | 2 952 | −14,41 | 0 | |||||
| 2025-08-05 | 13F | NewSquare Capital LLC | 4 319 | 433,21 | 24 | 500,00 | ||||
| 2025-05-12 | 13F | Benjamin Edwards Inc | 0 | −100,00 | 0 | |||||
| 2025-07-16 | 13F | Signaturefd, Llc | 246 141 | −1,93 | 1 369 | −1,01 | ||||
| 2025-08-11 | 13F | Principal Securities, Inc. | 9 755 | 26,52 | 54 | 45,95 | ||||
| 2025-07-22 | 13F | Visionary Horizons, LLC | 12 785 | 0,00 | 71 | 1,43 | ||||
| 2025-08-14 | 13F | Icon Wealth Advisors, LLC | 19 423 | 0,00 | 108 | 0,00 | ||||
| 2025-08-12 | 13F | Soundwatch Capital LLC | 1 147 | 617 | ||||||
| 2025-08-04 | 13F | Keybank National Association/oh | 25 726 | 5,11 | 143 | 6,72 | ||||
| 2025-07-22 | 13F | Gsa Capital Partners Llp | 12 139 | 0 | ||||||
| 2025-07-22 | 13F | Merit Financial Group, LLC | 35 768 | −7,04 | 199 | −6,60 | ||||
| 2025-08-14 | 13F | Old Mission Capital Llc | 0 | −100,00 | 0 | |||||
| 2025-07-17 | 13F | ERn Financial, LLC | 11 265 | −29,17 | 63 | −28,74 | ||||
| 2025-08-04 | 13F | Hantz Financial Services, Inc. | 11 719 | 1 859,70 | 0 | |||||
| 2025-08-12 | 13F | Putnam Fl Investment Management Co | 26 294 | 26,50 | 146 | 28,07 | ||||
| 2025-08-11 | 13F | Pinnacle Wealth Planning Services, Inc. | 50 328 | 33,25 | 280 | 34,13 | ||||
| 2025-07-31 | 13F | Sage Mountain Advisors LLC | 28 874 | −1,04 | 161 | 0,00 | ||||
| 2025-05-09 | 13F | Abc Arbitrage Sa | 0 | −100,00 | 0 | |||||
| 2025-07-30 | 13F | Ethic Inc. | 327 253 | 0,70 | 1 820 | 2,94 | ||||
| 2025-08-19 | 13F | Cape Investment Advisory, Inc. | 1 292 | 38,03 | 7 | 40,00 | ||||
| 2025-08-14 | 13F | Integrated Wealth Concepts LLC | 15 292 | −75,86 | 85 | −75,57 | ||||
| 2025-08-14 | 13F | Sei Investments Co | 96 731 | −1,24 | 538 | −0,37 | ||||
| 2025-07-09 | 13F | Bruce G. Allen Investments, LLC | 6 755 | −26,92 | 38 | −26,00 | ||||
| 2025-08-01 | 13F | Envestnet Asset Management Inc | 1 561 074 | −2,60 | 8 680 | −1,72 | ||||
| 2025-08-14 | 13F | Vident Advisory, LLC | 334 461 | 123,64 | 1 860 | 125,61 | ||||
| 2025-07-31 | 13F | Brighton Jones Llc | 17 629 | 60,79 | 98 | 63,33 | ||||
| 2025-08-12 | 13F | Charles Schwab Investment Management Inc | 1 260 054 | 12,37 | 7 006 | 13,39 | ||||
| 2025-08-14 | 13F | Verition Fund Management LLC | 63 609 | −25,74 | 354 | −25,05 | ||||
| 2025-08-13 | 13F | Quadrant Capital Group Llc | 428 572 | −1,93 | 2 383 | −1,04 | ||||
| 2025-08-13 | 13F | Shelton Capital Management | 38 900 | 216 | ||||||
| 2025-07-28 | NP | AVDE - Avantis International Equity ETF This fund is a listed as child fund of American Century Companies Inc and if that institution has disclosed ownership in this security, then these positions will not be double counted when calculating total shares and total value | 2 514 701 | 11,34 | 13 982 | 9,77 | ||||
| 2025-07-30 | 13F | Bogart Wealth, LLC | 38 | 0,00 | 0 | |||||
| 2025-07-17 | 13F | Sage Rhino Capital Llc | 44 832 | −0,33 | 249 | 0,81 | ||||
| 2025-08-14 | 13F | Seven Mile Advisory | 16 116 | −13,24 | 90 | −12,75 | ||||
| 2025-08-12 | 13F | Manchester Capital Management LLC | 3 744 | 12,06 | 21 | 11,11 | ||||
| 2025-08-15 | 13F | Morgan Stanley | 41 485 209 | 67,96 | 230 658 | 69,49 | ||||
| 2025-07-30 | 13F | Legacy Wealth Asset Management, LLC | 237 588 | 72,19 | 1 321 | 73,68 | ||||
| 2025-07-16 | 13F | West Branch Capital LLC | 0 | −100,00 | 0 | |||||
| 2025-07-08 | 13F | Parallel Advisors, LLC | 59 328 | 2,67 | 330 | 3,46 | ||||
| 2025-08-06 | 13F | Commonwealth Equity Services, Llc | 12 225 | 0 | ||||||
| 2025-07-17 | 13F | Greenleaf Trust | 58 370 | −4,25 | 325 | −3,28 | ||||
| 2025-08-14 | 13F | Mml Investors Services, Llc | 180 556 | 25,38 | 1 | |||||
| 2025-08-08 | 13F | Crossmark Global Holdings, Inc. | 735 218 | −0,01 | 4 088 | 0,89 | ||||
| 2025-07-09 | 13F | Aaron Wealth Advisors LLC | 106 291 | −0,47 | 591 | 0,34 | ||||
| 2025-07-14 | 13F | UMA Financial Services, Inc. | 635 | 29,59 | 4 | 50,00 | ||||
| 2025-08-14 | 13F | Ieq Capital, Llc | 117 329 | 0,53 | 652 | 1,40 | ||||
| 2025-08-26 | NP | GLBIX - Leuthold Global Fund Institutional Class | 21 538 | 0,00 | 120 | 0,85 | ||||
| 2025-08-12 | 13F | Steward Partners Investment Advisory, Llc | 1 275 | 0,00 | 7 | 0,00 | ||||
| 2025-08-13 | 13F | Townsquare Capital Llc | 0 | −100,00 | 0 | |||||
| 2025-08-18 | 13F | Geneos Wealth Management Inc. | 1 658 | −2,18 | 9 | 0,00 | ||||
| 2025-08-14 | 13F | Warren Averett Asset Management, LLC | 13 081 | −16,75 | 73 | −16,28 | ||||
| 2025-07-28 | NP | AVDEX - Avantis International Equity Fund Institutional Class This fund is a listed as child fund of American Century Companies Inc and if that institution has disclosed ownership in this security, then these positions will not be double counted when calculating total shares and total value | 151 792 | 2,45 | 844 | 0,96 | ||||
| 2025-08-12 | 13F | XTX Topco Ltd | 177 225 | 985 | ||||||
| 2025-08-15 | 13F | Kestra Advisory Services, LLC | 12 276 | 7,89 | 68 | 9,68 | ||||
| 2025-07-17 | 13F | Halbert Hargrove Global Advisors, Llc | 0 | −100,00 | 0 | |||||
| 2025-08-18 | 13F | Wolverine Trading, Llc | 10 508 | 58 | ||||||
| 2025-05-13 | 13F | Hartland & Co., LLC | 0 | −100,00 | 0 | |||||
| 2025-08-14 | 13F | Aqr Capital Management Llc | 735 650 | 87,19 | 4 090 | 88,91 | ||||
| 2025-08-14 | 13F | GWM Advisors LLC | 62 | 0 | ||||||
| 2025-08-15 | 13F | Tower Research Capital LLC (TRC) | 1 480 | 168,12 | 8 | 166,67 | ||||
| 2025-08-05 | 13F | Bank of New York Mellon Corp | 783 025 | −8,00 | 4 354 | −7,17 | ||||
| 2025-04-29 | 13F | Callan Capital, LLC | 214 117 | 13,10 | 1 180 | 27,46 | ||||
| 2025-07-08 | 13F | Nbc Securities, Inc. | 650 | −55,57 | 0 | |||||
| 2025-08-12 | 13F | Aigen Investment Management, Lp | 13 805 | 77 | ||||||
| 2025-08-13 | 13F | Rsm Us Wealth Management Llc | 101 673 | 0,59 | 565 | 1,62 | ||||
| 2025-08-25 | 13F/A | Neuberger Berman Group LLC | 121 233 | −3,87 | 674 | −2,88 | ||||
| 2025-08-13 | 13F | Natixis Advisors, L.p. | 3 514 388 | 4,50 | 20 | 5,56 | ||||
| 2025-08-06 | 13F | Vestmark Advisory Solutions, Inc. | 26 081 | 145 | ||||||
| 2025-07-14 | 13F | GAMMA Investing LLC | 66 791 | −1,14 | 371 | −0,27 | ||||
| 2025-08-01 | 13F | Bessemer Group Inc | 5 700 | 0,00 | 0 | |||||
| 2025-08-12 | 13F | Wood Tarver Financial Group, LLC | 137 | 0,00 | 0 | |||||
| 2025-08-13 | 13F | Te Ahumairangi Investment Management Ltd | 50 000 | 0 | ||||||
| 2025-08-13 | 13F | First Trust Advisors Lp | 417 167 | −4,58 | 2 319 | −3,70 | ||||
| 2025-08-13 | 13F | GeoWealth Management, LLC | 12 704 | 15,59 | 71 | 16,67 | ||||
| 2025-08-14 | 13F | Smartleaf Asset Management LLC | 99 306 | 1,51 | 552 | −0,54 | ||||
| 2025-08-14 | 13F | Boston Private Wealth Llc | 14 561 | −46,09 | 81 | −45,95 | ||||
| 2025-07-08 | 13F | Gallacher Capital Management LLC | 79 994 | 1,21 | 445 | 2,07 | ||||
| 2025-08-13 | 13F | Flow Traders U.s. Llc | 42 435 | 0 | ||||||
| 2025-08-07 | 13F | HighPoint Advisor Group LLC | 21 798 | 1,49 | 121 | 11,01 | ||||
| 2025-08-01 | 13F | SYM FINANCIAL Corp | 42 927 | −2,08 | 239 | −1,24 | ||||
| 2025-08-11 | 13F | Baldwin Investment Management, LLC | 28 800 | 0,00 | 160 | 1,27 | ||||
| 2025-08-13 | 13F/A | StoneX Group Inc. | 0 | −100,00 | 0 | −100,00 | ||||
| 2025-08-27 | NP | GSIB - Themes Global Systemically Important Banks ETF | 82 692 | 113,55 | 460 | 115,49 | ||||
| 2025-07-14 | 13F | Foster Group, Inc. | 0 | −100,00 | 0 | |||||
| 2025-07-25 | 13F | Apollon Wealth Management, LLC | 45 243 | 0,00 | 252 | 0,80 | ||||
| 2025-08-14 | 13F | Aspen Grove Capital, LLC | 10 957 | 2,71 | 61 | 3,45 | ||||
| 2025-08-13 | 13F | Northern Trust Corp | 10 147 189 | 1,94 | 56 418 | 2,87 | ||||
| 2025-03-26 | NP | DFA INVESTMENT DIMENSIONS GROUP INC - International Sustainability Core 1 Portfolio Shares | 0 | −100,00 | 0 | −100,00 | ||||
| 2025-08-12 | 13F | Gladstone Institutional Advisory LLC | 35 302 | 196 | ||||||
| 2025-07-30 | 13F | Eqis Capital Management, Inc. | 106 539 | 4,23 | 592 | 5,15 | ||||
| 2025-08-14 | 13F | CIBC Asset Management Inc | 34 121 | 190 | ||||||
| 2025-08-14 | 13F | ICONIQ Capital, LLC | 86 550 | −12,98 | 481 | −12,23 | ||||
| 2025-08-14 | 13F | Aprio Wealth Management, LLC | 33 431 | −15,37 | 186 | −14,75 | ||||
| 2025-08-12 | 13F | Global Retirement Partners, LLC | 58 919 | 1 854,84 | 328 | 2 235,71 | ||||
| 2025-08-05 | 13F | Ellevest, Inc. | 22 006 | 51,99 | 122 | 54,43 | ||||
| 2025-07-31 | 13F | AlTi Global, Inc. | 15 911 | 88 | ||||||
| 2025-08-12 | 13F | Proequities, Inc. | Put | 0 | 0 | |||||
| 2025-08-12 | 13F | Proequities, Inc. | Call | 0 | 0 | |||||
| 2025-08-12 | 13F | Proequities, Inc. | 0 | 0 | ||||||
| 2025-07-23 | 13F | High Note Wealth, LLC | 48 | 0,00 | 0 | |||||
| 2025-08-05 | 13F | GHP Investment Advisors, Inc. | 0 | −100,00 | 0 | |||||
| 2025-08-07 | 13F | Allworth Financial LP | 7 693 | 16,37 | 43 | 31,25 | ||||
| 2025-07-16 | 13F | Highline Wealth Partners Llc | 1 421 | 0,85 | 8 | 0,00 | ||||
| 2025-05-12 | 13F | XY Capital Ltd | 0 | −100,00 | 0 | |||||
| 2025-07-09 | 13F | Sivia Capital Partners, LLC | 72 925 | 22,12 | 405 | 23,10 | ||||
| 2025-05-05 | 13F | Eagle Bay Advisors LLC | 0 | −100,00 | 0 | |||||
| 2025-07-28 | 13F | BRYN MAWR TRUST Co | 6 054 | −0,69 | 34 | 0,00 | ||||
| 2025-07-30 | 13F | Bleakley Financial Group, LLC | 36 584 | 0,38 | 203 | 1,50 | ||||
| 2025-07-29 | 13F | Regions Financial Corp | 338 759 | −33,12 | 1 884 | −32,51 | ||||
| 2025-07-11 | 13F | International Private Wealth Advisors LLC | 0 | −100,00 | 0 | |||||
| 2025-08-13 | 13F | Quantbot Technologies LP | 33 264 | 333,46 | 185 | 338,10 | ||||
| 2025-08-26 | NP | EHLS - Even Herd Long Short ETF | 31 616 | −53,74 | 176 | −53,46 | ||||
| 2025-08-04 | 13F | Spire Wealth Management | 355 | −93,49 | 2 | −96,67 | ||||
| 2025-08-07 | 13F | Brio Consultants, LLC | 12 716 | 5,98 | 71 | 6,06 | ||||
| 2025-08-14 | 13F | Beaird Harris Wealth Management, LLC | 242 | 1 | ||||||
| 2025-07-28 | 13F | Ritholtz Wealth Management | 113 496 | −4,49 | 631 | −3,52 | ||||
| 2025-07-31 | 13F | Glass Jacobson Investment Advisors llc | 1 000 | 0,00 | 6 | 25,00 | ||||
| 2025-08-14 | 13F | Atomi Financial Group, Inc. | 150 692 | 1,01 | 838 | 1,95 | ||||
| 2025-08-14 | 13F | Citadel Advisors Llc | Call | 0 | −100,00 | 0 | ||||
| 2025-07-09 | 13F | Riversedge Advisors, Llc | 16 962 | −7,04 | 94 | −6,00 | ||||
| 2025-08-12 | 13F | Jpmorgan Chase & Co | 677 445 | 33,35 | 3 767 | 34,55 | ||||
| 2025-07-21 | 13F | Ascent Group, LLC | 21 735 | −21,01 | 121 | −20,53 | ||||
| 2025-07-21 | 13F | Qrg Capital Management, Inc. | 407 459 | 60,89 | 2 265 | 62,37 | ||||
| 2025-08-14 | 13F | Summit Trail Advisors, Llc | 23 090 | −1,12 | 128 | 0,00 | ||||
| 2025-08-08 | 13F | Cetera Investment Advisers | 103 152 | 1,09 | 574 | 1,96 | ||||
| 2025-05-16 | 13F | Redwood Investments, LLC | 21 593 | 119 | ||||||
| 2025-08-11 | 13F | HighTower Advisors, LLC | 333 232 | −1,65 | 1 853 | −0,75 | ||||
| 2025-08-14 | 13F | Bnp Paribas Arbitrage, Sa | 220 254 | 178,65 | 1 225 | 181,38 | ||||
| 2025-08-12 | 13F | Rhumbline Advisers | 286 237 | −0,73 | 1 591 | 0,19 | ||||
| 2025-08-14 | 13F | Hrt Financial Lp | 164 517 | 186,42 | 1 | |||||
| 2025-08-05 | 13F | Bridgewater Advisors Inc. | 38 598 | −1,82 | 228 | 13,50 | ||||
| 2025-08-22 | NP | MLNIX - Global Concentrated Portfolio Class I | 1 825 584 | 149,50 | 10 150 | 151,80 | ||||
| 2025-08-12 | 13F | BlackRock, Inc. | 10 750 738 | −1,74 | 59 774 | −0,84 | ||||
| 2025-07-25 | 13F | Stephens Consulting, LLC | 313 | 2 | ||||||
| 2025-07-15 | 13F | Td Private Client Wealth Llc | 11 338 | 63 | ||||||
| 2025-08-11 | 13F | HHM Wealth Advisors, LLC | 2 350 | 0,00 | 13 | 8,33 | ||||
| 2025-07-25 | 13F | Yousif Capital Management, Llc | 152 033 | 2,20 | 845 | 3,17 | ||||
| 2025-04-21 | 13F | Catalina Capital Group, LLC | 0 | −100,00 | 0 | |||||
| 2025-07-29 | 13F | Private Trust Co Na | 2 855 | 225,91 | 16 | 275,00 | ||||
| 2025-08-11 | 13F | United Capital Financial Advisers, Llc | 143 672 | −4,05 | 799 | −3,27 | ||||
| 2025-07-29 | NP | BLUIX - BLUEPRINT GROWTH FUND Institutional Class | 77 437 | 431 | ||||||
| 2025-08-08 | 13F | Avantax Advisory Services, Inc. | 128 609 | 0,43 | 715 | 1,42 | ||||
| 2025-08-08 | 13F | Allianz Se | 590 000 | 0,00 | 3 280 | 0,92 | ||||
| 2025-07-28 | 13F | Naviter Wealth, LLC | 300 138 | 4,34 | 1 669 | 2,14 | ||||
| 2025-08-14 | 13F | UBS Group AG | 121 389 | 234,03 | 675 | 237,00 | ||||
| 2025-08-13 | 13F | Northwestern Mutual Wealth Management Co | 25 842 | 6 142,03 | 144 | 7 050,00 | ||||
| 2025-08-14 | 13F | Point72 Asset Management, L.P. | 719 400 | 1 840,13 | 4 000 | 1 860,29 | ||||
| 2025-08-12 | 13F | Seeds Investor Llc | 12 237 | 18,58 | 68 | 21,43 | ||||
| 2025-08-14 | 13F | D. E. Shaw & Co., Inc. | 20 454 | 114 | ||||||
| 2025-08-11 | 13F | Traub Capital Management LLC | 537 | 3 | ||||||
| 2025-07-16 | 13F | Magnus Financial Group LLC | 11 020 | −40,56 | 61 | −40,20 | ||||
| 2025-08-11 | 13F | Private Advisor Group, LLC | 48 954 | −3,83 | 272 | −2,86 | ||||
| 2025-08-27 | 13F/A | Squarepoint Ops LLC | 79 231 | 416,74 | 441 | 423,81 | ||||
| 2025-08-14 | 13F | Evergreen Capital Management Llc | 106 595 | 2,10 | 593 | 2,96 | ||||
| 2025-05-14 | 13F | Van Hulzen Asset Management, LLC | 0 | −100,00 | 0 | −100,00 | ||||
| 2025-08-11 | 13F | Annis Gardner Whiting Capital Advisors, LLC | 1 795 | 10 | ||||||
| 2025-08-13 | 13F | Cresset Asset Management, LLC | 11 362 | 63 | ||||||
| 2025-07-23 | 13F | Prime Capital Investment Advisors, LLC | 45 116 | −1,74 | 251 | −0,79 | ||||
| 2025-09-04 | 13F/A | Advisor Group Holdings, Inc. | 22 871 | 252,57 | 127 | 260,00 | ||||
| 2025-07-11 | 13F | Vanguard Capital Wealth Advisors This fund is a listed as child fund of Vanguard Group Inc and if that institution has disclosed ownership in this security, then these positions will not be double counted when calculating total shares and total value | 17 706 | −87,86 | 98 | −87,80 | ||||
| 2025-07-29 | 13F | Salomon & Ludwin, LLC | 150 | 1 | ||||||
| 2025-05-08 | 13F | Waldron Private Wealth LLC | 0 | −100,00 | 0 | |||||
| 2025-04-14 | 13F | Park Avenue Securities Llc | 0 | −100,00 | 0 | |||||
| 2025-07-25 | 13F | Sequoia Financial Advisors, LLC | 120 817 | 10,32 | 672 | 11,28 | ||||
| 2025-05-02 | 13F | Sachetta, LLC | 0 | −100,00 | 0 | |||||
| 2025-07-10 | 13F | Exchange Traded Concepts, Llc | 1 054 | 6 | ||||||
| 2025-07-24 | 13F | Ronald Blue Trust, Inc. | 62 536 | 144,88 | 348 | 147,86 | ||||
| 2025-07-25 | 13F | Envestnet Portfolio Solutions, Inc. | 18 205 | 36,44 | 101 | 38,36 | ||||
| 2025-08-07 | 13F | Prospect Financial Group LLC | 14 766 | −3,85 | 82 | −2,38 | ||||
| 2025-08-04 | 13F | Assetmark, Inc | 82 042 | 58,25 | 456 | 60,00 | ||||
| 2025-08-07 | 13F | Connor, Clark & Lunn Investment Management Ltd. | 360 596 | 2 005 | ||||||
| 2025-04-22 | 13F | Mendota Financial Group, LLC | 0 | −100,00 | 0 | |||||
| 2025-08-06 | 13F | First Horizon Advisors, Inc. | 805 | 115,24 | 4 | 100,00 | ||||
| 2025-07-14 | 13F | Abound Wealth Management | 108 | 0,00 | 1 | |||||
| 2025-08-14 | 13F | Fmr Llc | 19 974 350 | 7,14 | 111 057 | 8,12 | ||||
| 2025-06-26 | NP | SNTKX - Steward International Enhanced Index Fund Class A | 315 100 | 0,00 | 1 591 | −7,82 | ||||
| 2025-08-07 | 13F | Zions Bancorporation, National Association /ut/ | 378 841 | −16,96 | 2 106 | −16,20 | ||||
| 2025-08-19 | 13F/A | Pitcairn Co | 66 773 | −14,83 | 371 | −13,92 | ||||
| 2025-08-01 | 13F | First Command Advisory Services, Inc. | 248 | −49,49 | 1 | −50,00 | ||||
| 2025-08-14 | 13F | Two Sigma Investments, Lp | 35 369 | 0,00 | 197 | 1,03 | ||||
| 2025-08-04 | 13F | Simon Quick Advisors, Llc | 12 176 | −18,13 | 68 | −17,28 | ||||
| 2025-08-11 | 13F | Brown Brothers Harriman & Co | 667 | 4 | ||||||
| 2025-08-14 | 13F | Cubist Systematic Strategies, LLC | 662 928 | 3 686 | ||||||
| 2025-07-25 | 13F | Verdence Capital Advisors LLC | 225 031 | −10,73 | 1 251 | −9,87 | ||||
| 2025-08-14 | 13F/A | Skopos Labs, Inc. | 23 556 | 328,37 | 130 | 333,33 | ||||
| 2025-07-17 | 13F | HB Wealth Management, LLC | 41 444 | 22,08 | 230 | 22,99 | ||||
| 2025-08-14 | 13F | Hancock Whitney Corp | 32 793 | 4,20 | 182 | 5,20 | ||||
| 2025-08-06 | 13F | Mark Sheptoff Financial Planning, Llc | 0 | −100,00 | 0 | |||||
| 2025-07-14 | 13F | AdvisorNet Financial, Inc | 293 | 2 | ||||||
| 2025-07-17 | 13F | Barry Investment Advisors, LLC | 17 774 | 0,52 | 99 | 1,03 | ||||
| 2025-08-28 | NP | NDOW - Anydrus Advantage ETF | 0 | −100,00 | 0 | −100,00 | ||||
| 2025-08-14 | 13F | Quantinno Capital Management LP | 10 898 | −70,63 | 61 | −70,59 | ||||
| 2025-08-14 | 13F | Xponance, Inc. | 29 090 | 1,66 | 162 | 2,55 | ||||
| 2025-07-23 | 13F | Abel Hall, LLC | 22 111 | −29,22 | 123 | −29,07 | ||||
| 2025-07-16 | 13F | Brown, Lisle/cummings, Inc. | 370 | 0,00 | 2 | 0,00 | ||||
| 2025-08-08 | 13F | Pnc Financial Services Group, Inc. | 207 018 | 16,94 | 1 151 | 18,05 | ||||
| 2025-07-16 | 13F | Augustine Asset Management Inc | 831 326 | 0,11 | 4 622 | 1,03 | ||||
| 2025-08-14 | 13F | Syon Capital Llc | 53 819 | −2,07 | 299 | −0,99 | ||||
| 2025-08-12 | 13F | Atlas Capital Advisors Llc | 14 237 | −45,09 | 79 | −44,37 | ||||
| 2025-07-11 | 13F/A | Umb Bank N A/mo | 4 603 | 0,00 | 26 | 0,00 | ||||
| 2025-07-31 | 13F | Ingalls & Snyder Llc | 20 000 | 0,00 | 0 | |||||
| 2025-08-14 | 13F | Citadel Advisors Llc | 590 089 | 179 805,18 | 3 281 | 327 900,00 | ||||
| 2025-08-14 | 13F | Group One Trading, L.p. | Put | 16 100 | 159,68 | 90 | 161,76 | |||
| 2025-08-14 | 13F | Citadel Advisors Llc | Put | 10 600 | 10 500,00 | 59 | ||||
| 2025-08-14 | 13F | Group One Trading, L.p. | Call | 11 300 | 465,00 | 63 | 463,64 | |||
| 2025-08-11 | 13F | GW&K Investment Management, LLC | 1 779 | −11,54 | 0 | |||||
| 2025-08-13 | 13F | Leuthold Group, Llc | 82 038 | 0,00 | 456 | 0,88 | ||||
| 2025-05-12 | 13F | Virtu Financial LLC | 0 | −100,00 | 0 | |||||
| 2025-07-23 | 13F | Eagle Rock Investment Company, Llc | 0 | −100,00 | 0 | |||||
| 2025-08-14 | 13F | Susquehanna International Group, Llp | 73 837 | −50,66 | 411 | −50,24 | ||||
| 2025-08-07 | 13F | Altman Advisors, Inc. | 449 892 | 1,94 | 2 528 | 13,46 | ||||
| 2025-08-13 | 13F | WCG Wealth Advisors LLC | 110 110 | 612 | ||||||
| 2025-08-15 | 13F | CI Private Wealth, LLC | 146 968 | −0,98 | 817 | 0,00 | ||||
| 2025-07-30 | 13F | Jackson Thornton Asset Management, Llc | 10 723 | 59 | ||||||
| 2025-07-28 | 13F | Sagespring Wealth Partners, Llc | 26 684 | 32,55 | 148 | 34,55 | ||||
| 2025-07-09 | 13F | PFW Advisors LLC | 10 414 | −0,03 | 58 | 0,00 | ||||
| 2025-07-22 | 13F | Checchi Capital Advisers, LLC | 57 919 | −6,57 | 322 | −5,57 | ||||
| 2025-05-08 | 13F | Moors & Cabot, Inc. | 0 | −100,00 | 0 | |||||
| 2025-07-10 | 13F | Wedmont Private Capital | 25 309 | −2,78 | 139 | 14,88 | ||||
| 2025-07-24 | 13F | Jfs Wealth Advisors, Llc | 4 044 | −6,71 | 22 | −4,35 | ||||
| 2025-07-30 | 13F | Blume Capital Management, Inc. | 48 | −91,37 | 0 | −100,00 | ||||
| 2025-08-12 | 13F | LPL Financial LLC | 201 659 | 27,01 | 1 121 | 28,26 | ||||
| 2025-08-07 | 13F | Resources Investment Advisors, LLC. | 69 791 | −18,76 | 388 | −17,97 | ||||
| 2025-05-15 | 13F | CAPROCK Group, Inc. | 112 737 | 6,10 | 621 | 19,65 | ||||
| 2025-08-07 | 13F | Private Advisory Group LLC | 11 466 | 0,00 | 64 | 0,00 | ||||
| 2025-08-12 | 13F | SRS Capital Advisors, Inc. | 4 042 | 22 | ||||||
| 2025-07-30 | NP | APIE - ActivePassive International Equity ETF | 556 863 | 2,81 | 3 096 | 1,38 | ||||
| 2025-07-21 | 13F | Cromwell Holdings LLC | 30 429 | 0,00 | 169 | 1,20 | ||||
| 2025-07-22 | 13F | Clarius Group, LLC | 25 109 | 0,00 | 140 | 0,72 | ||||
| 2025-08-13 | 13F | Twin Peaks Wealth Advisors, LLC | 2 538 | 16 | ||||||
| 2025-04-11 | 13F | First Affirmative Financial Network | 45 136 | 4,64 | 249 | 18,10 | ||||
| 2025-07-09 | 13F | Sunpointe, LLC | 11 932 | 0,00 | 66 | 1,54 | ||||
| 2025-08-12 | 13F | O'shaughnessy Asset Management, Llc | 653 634 | 3,33 | 3 634 | 4,28 | ||||
| 2025-07-24 | 13F | Callan Family Office, LLC | 371 418 | 153,11 | 2 065 | 155,57 | ||||
| 2025-08-14 | 13F | Ariadne Wealth Management, LP | 46 146 | 3,72 | 295 | 30,53 | ||||
| 2025-07-30 | NP | ENDW - Cambria Endowment Style ETF | 164 | 1 | ||||||
| 2025-08-08 | NP | QGBLX - Quantified Global Fund Investor Class | 42 181 | 235 | ||||||
| 2025-08-14 | 13F | Raymond James Financial Inc | 983 309 | −5,18 | 5 467 | −4,32 | ||||
| 2025-08-06 | 13F | Walkner Condon Financial Advisors LLC | 21 362 | 3,13 | 119 | 3,51 | ||||
| 2025-08-13 | 13F | Brown Advisory Inc | 11 870 | 66 | ||||||
| 2025-08-14 | 13F | Hilltop Holdings Inc. | 18 484 | −0,67 | 103 | 0,00 | ||||
| 2025-07-11 | 13F | Pinnacle Bancorp, Inc. | 604 | 0,00 | 3 | 0,00 | ||||
| 2025-08-13 | 13F | Russell Investments Group, Ltd. | 198 587 | 52,47 | 1 104 | 53,97 | ||||
| 2025-04-23 | 13F | Continuum Advisory, LLC | 0 | −100,00 | 0 | |||||
| 2025-08-05 | 13F | Simplex Trading, Llc | Put | 500 | 400,00 | 0 | ||||
| 2025-08-05 | 13F | Simplex Trading, Llc | Call | 10 000 | 112,77 | 0 | ||||
| 2025-08-08 | 13F | Creative Planning | 1 104 332 | −8,33 | 6 140 | −7,50 | ||||
| 2025-08-14 | 13F | Headlands Technologies LLC | 1 914 | 11 | ||||||
| 2025-08-11 | 13F | Citigroup Inc | 317 499 | 18,81 | 1 765 | 19,90 | ||||
| 2025-08-13 | 13F | Centiva Capital, LP | 0 | −100,00 | 0 | |||||
| 2025-08-14 | 13F | Toroso Investments, LLC | 31 616 | −53,74 | 176 | −53,46 | ||||
| 2025-08-11 | 13F | Bell Investment Advisors, Inc | 950 | 0,00 | 5 | 0,00 | ||||
| 2025-08-13 | 13F | Fisher Asset Management, LLC | 266 074 | 7,57 | 1 479 | 8,59 | ||||
| 2025-08-13 | 13F | Cerity Partners LLC | 1 071 789 | −0,17 | 5 959 | 0,74 | ||||
| 2025-08-25 | NP | SISLX - Shelton International Select Equity Fund Investor Class | 38 900 | 216 | ||||||
| 2025-07-09 | 13F | Baron Wealth Management LLC | 0 | −100,00 | 0 | |||||
| 2025-08-14 | 13F | State Street Corp | 21 260 | 0,81 | 118 | 1,72 | ||||
| 2025-08-13 | 13F | Kayne Anderson Rudnick Investment Management Llc | 165 | 0,00 | 1 | |||||
| 2025-07-03 | 13F | Fiduciary Financial Group, Llc | 14 261 | −5,08 | 80 | 17,65 | ||||
| 2025-07-29 | 13F | Wealthstream Advisors, Inc. | 26 582 | −1,39 | 148 | −0,68 | ||||
| 2025-08-15 | 13F | Keel Point, LLC | 32 596 | 11,94 | 181 | 13,13 | ||||
| 2025-04-21 | 13F | Nelson, Van Denburg & Campbell Wealth Management Group, LLC | 0 | −100,00 | 0 | |||||
| 2025-08-14 | 13F | Mariner, LLC | 900 680 | −1,25 | 5 008 | −0,40 | ||||
| 2025-05-15 | 13F | Angeles Investment Advisors, LLC | 0 | −100,00 | 0 | −100,00 | ||||
| 2025-08-11 | 13F | Cornerstone Planning Group LLC | 1 520 | −22,21 | 9 | 0,00 | ||||
| 2025-08-11 | 13F | Integrated Quantitative Investments LLC | 155 087 | 862 | ||||||
| 2025-08-14 | 13F | Axa S.a. | 10 000 | 0,00 | 56 | 0,00 | ||||
| 2025-04-17 | 13F | Vista Wealth Management Group, LLC | 17 820 | −3,30 | 98 | 8,89 | ||||
| 2025-07-25 | 13F | JustInvest LLC | 727 006 | 6,30 | 4 042 | 7,27 | ||||
| 2025-08-12 | 13F | Franklin Resources Inc | 852 462 | −4,04 | 4 740 | −3,17 | ||||
| 2025-08-12 | 13F | Pathstone Holdings, LLC | 928 977 | −6,44 | 5 165 | −5,59 | ||||
| 2025-08-14 | 13F | Peapack Gladstone Financial Corp | 24 438 | −17,58 | 0 | |||||
| 2025-08-15 | 13F | WealthCollab, LLC | 0 | −100,00 | 0 | |||||
| 2025-04-25 | 13F | Albion Financial Group /ut | 0 | −100,00 | 0 | |||||
| 2025-07-16 | 13F | ORG Partners LLC | 500 | 3 | ||||||
| 2025-08-14 | 13F | Barometer Capital Management Inc. | 37 072 | −62,99 | 206 | −62,61 | ||||
| 2025-08-14 | 13F | Balyasny Asset Management Llc | 377 783 | 2 886,19 | 2 100 | 2 943,48 | ||||
| 2025-05-15 | 13F/A | Orion Portfolio Solutions, LLC | 554 414 | −11,23 | 3 055 | 0,00 | ||||
| 2025-08-14 | 13F | Royal Bank Of Canada | 694 144 | −18,10 | 3 860 | −17,33 | ||||
| 2025-08-14 | 13F | Wiley Bros.-aintree Capital, Llc | 53 199 | −6,32 | 296 | −8,07 | ||||
| 2025-07-31 | 13F | Nilsine Partners, LLC | 38 029 | −18,22 | 211 | −17,58 | ||||
| 2025-08-15 | 13F | Captrust Financial Advisors | 185 587 | 2,95 | 1 032 | 3,83 | ||||
| 2025-07-11 | 13F | Harbour Capital Advisors, LLC | 79 140 | −2,04 | 442 | 10,50 |
Other Listings
| DE:MZ8A | € 5,45 |