Grunnleggende statistikk
| Institusjonelle eiere | 186 total, 186 long only, 0 short only, 0 long/short - change of 3,31% MRQ |
| Gjennomsnittlig porteføljeallokering | 0.2536 % - change of −5,66% MRQ |
| Institusjonelle aksjer (Long) | 8 652 062 (ex 13D/G) - change of 1,10MM shares 14,64% MRQ |
| Institusjonell verdi (Long) | $ 626 617 USD ($1000) |
Institusjonelt eierskap og aksjonærer
iShares Trust - iShares Morningstar Mid-Cap ETF (US:IMCB) har 186 institusjonelle eiere og aksjonærer som har sendt inn 13D/G- eller 13F-skjemaer til Securities Exchange Commission (SEC). Disse institusjonene eier til sammen 8,652,062 aksjer. De største aksjonærene inkluderer UBS Group AG, Morgan Stanley, RMG Wealth Management LLC, LPL Financial LLC, Commonwealth Equity Services, Llc, Means Investment Co., Inc., Raymond James Financial Inc, Cetera Investment Advisers, Steele Capital Management, Inc., and Matrix Trust Co .
iShares Trust - iShares Morningstar Mid-Cap ETF (ARCA:IMCB) institusjonell eierstruktur viser nåværende posisjoner i selskapet fordelt på institusjoner og fond, samt de siste endringene i posisjonsstørrelse. De største aksjonærene kan være individuelle investorer, verdipapirfond, hedgefond eller institusjoner. Schedule 13D indikerer at investoren eier (eller har eid) mer enn 5 % av selskapet og har til hensikt (eller hadde til hensikt) å aktivt forfølge en endring i forretningsstrategien. Schedule 13G indikerer en passiv investering på over 5 %.
The share price as of September 10, 2025 is 82,34 / share. Previously, on September 11, 2024, the share price was 72,99 / share. This represents an increase of 12,81% over that period.

Fondssentiment-score
Fondssentiment Score (også kjent som akkumulering av eierskap poengsum) viser hvilke aksjer som er mest kjøpt av fond. Den er resultatet av en sofistikert, kvantitativ flerfaktormodell som identifiserer selskaper med de høyeste nivåene av institusjonell akkumulering. Beregningsmodellen for poeng bruker en kombinasjon av den totale økningen i antall offentliggjorte eiere, endringer i porteføljeallokeringen til disse eierne og andre beregninger. Tallet går fra 0 til 100, der høyere tall indikerer en høyere grad av akkumulering i forhold til sammenlignbare selskaper, der 50 er gjennomsnittet.
Oppdateringsfrekvens: Daglig
Sjekk ut Ownership Explorer, som inneholder en liste over de høyest rangerte selskapene.
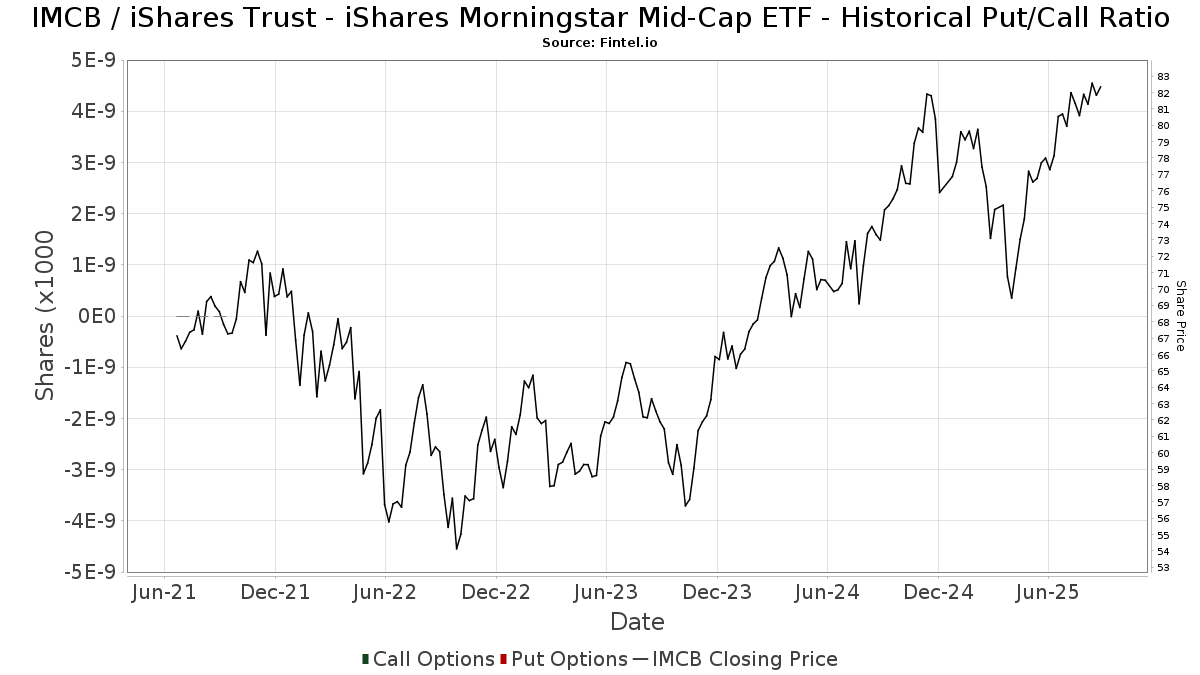
Institusjonell Put/Call-forhold
I tillegg til å rapportere standard aksje- og gjeldsemisjoner må institusjoner med mer enn 100 millioner kroner i forvaltningskapital også oppgi beholdningen av put- og callopsjoner. Siden put-opsjoner generelt indikerer et negativt sentiment, og call-opsjoner indikerer et positivt sentiment, kan vi få et inntrykk av det generelle institusjonelle sentimentet ved å plotte forholdet mellom put- og call-opsjoner. Diagrammet til høyre viser det historiske forholdet mellom put- og call-opsjoner for dette instrumentet.
Ved å bruke Put/Call-forholdet som en indikator på investorsentimentet kan man overvinne en av de viktigste svakhetene ved å bruke totalt institusjonelt eierskap, nemlig at en betydelig andel av forvaltningskapitalen investeres passivt for å følge indekser. Passivt forvaltede fond kjøper vanligvis ikke opsjoner, slik at indikatoren for put/call-forhold i større grad gjenspeiler stemningen i aktivt forvaltede fond.
13F- og NPORT-arkiveringer
Detaljer om 13F-arkiveringer er gratis. Detaljer om NP-arkiveringer krever et premium-medlemskap. Grønne rader indikerer nye posisjoner. Røde rader indikerer lukkede posisjoner. Klikk på lenke ikonet for å se hele transaksjonshistorikken.
Oppgrader
for å låse opp premiedata og eksportere til Excel. ![]() .
.
| Fildato | Kilde | Investor | Type | Gjennomsnittlig pris (estimert) |
Aksjer | Δ Aksjer (%) |
Rapportert verdi ($1000) | Verdi (%) | Portallokering (%) | |
|---|---|---|---|---|---|---|---|---|---|---|
| 2025-08-14 | 13F | Diversify Advisory Services, LLC | 8 729 | −3,06 | 706 | 7,29 | ||||
| 2025-08-06 | 13F | Hoxton Planning & Management, LLC | 5 841 | 465 | ||||||
| 2025-08-11 | 13F | Synergy Investment Management, LLC | 0 | −100,00 | 0 | |||||
| 2025-07-16 | 13F | Signaturefd, Llc | 1 596 | 1,79 | 127 | 9,48 | ||||
| 2025-07-15 | 13F | Pitti Group Wealth Management, LLC | 16 507 | −2,66 | 1 315 | 4,62 | ||||
| 2025-05-12 | 13F | C2P Capital Advisory Group, LLC d.b.a. Prosperity Capital Advisors | 0 | −100,00 | 0 | −100,00 | ||||
| 2025-07-31 | 13F | Cambridge Investment Research Advisors, Inc. | 83 538 | 4,81 | 7 | 20,00 | ||||
| 2025-08-14 | 13F | UBS Group AG | 1 309 271 | 3,80 | 104 297 | 11,61 | ||||
| 2025-08-14 | 13F | Wealth Preservation Advisors, LLC | 705 | 0,43 | 56 | 7,69 | ||||
| 2025-08-08 | 13F | Good Life Advisors, LLC | 5 076 | 0,00 | 404 | 7,45 | ||||
| 2025-08-13 | 13F | Financial Freedom, LLC | 936 | 0,00 | 75 | 7,25 | ||||
| 2025-08-05 | 13F | Sigma Planning Corp | 3 911 | 0,10 | 312 | 7,61 | ||||
| 2025-08-05 | 13F | GPS Wealth Strategies Group, LLC | 6 | 0,00 | 0 | |||||
| 2025-08-08 | 13F | Financial Gravity Companies, Inc. | 328 | 0,00 | 26 | 8,33 | ||||
| 2025-08-14 | 13F | Stifel Financial Corp | 74 517 | −1,10 | 5 936 | 6,36 | ||||
| 2025-08-11 | 13F | United Advisor Group, LLC | 22 837 | 16,99 | 1 819 | 25,80 | ||||
| 2025-08-05 | 13F | Ellevest, Inc. | 2 639 | 210 | ||||||
| 2025-07-21 | 13F | HighMark Wealth Management LLC | 1 297 | 0,00 | 103 | 7,29 | ||||
| 2025-07-21 | 13F | Barrett & Company, Inc. | 3 216 | 0,34 | 256 | 8,02 | ||||
| 2025-07-30 | 13F | Fingerlakes Wealth Management, Inc. | 2 618 | 209 | ||||||
| 2025-08-05 | 13F | Atlas Private Wealth Advisors | 3 882 | −34,82 | 309 | −29,93 | ||||
| 2025-08-11 | 13F | Rothschild Investment Llc | 1 451 | 0,00 | 116 | 7,48 | ||||
| 2025-08-19 | 13F | Advisory Services Network, LLC | 12 085 | −6,91 | 978 | 1,77 | ||||
| 2025-08-13 | 13F | Haverford Trust Co | 6 517 | 0,00 | 519 | 7,68 | ||||
| 2025-07-21 | 13F | Pacific Financial Group Inc | 64 764 | 1,21 | 5 159 | 8,84 | ||||
| 2025-08-06 | 13F | AE Wealth Management LLC | 1 348 | 97,65 | 107 | 114,00 | ||||
| 2025-07-28 | 13F | Private Wealth Asset Management, LLC | 1 245 | −23,85 | 99 | −18,18 | ||||
| 2025-08-14 | 13F | Citadel Advisors Llc | 12 425 | 990 | ||||||
| 2025-04-29 | 13F | Resources Investment Advisors, LLC. | 0 | −100,00 | 0 | −100,00 | ||||
| 2025-08-15 | 13F | Truefg, Llc | 9 332 | −0,70 | 743 | 6,75 | ||||
| 2025-07-23 | 13F | Detalus Advisors, LLC | 3 184 | 6,88 | 254 | 15,00 | ||||
| 2025-08-07 | 13F | Addison Advisors LLC | 2 650 | −33,50 | 211 | −28,47 | ||||
| 2025-07-25 | 13F | Cwm, Llc | 13 933 | 3,84 | 1 | |||||
| 2025-04-10 | 13F | EWG Elevate Inc. | 0 | −100,00 | 0 | |||||
| 2025-07-24 | 13F | Morton Brown Family Wealth, LLC | 482 | 0,21 | 38 | 8,57 | ||||
| 2025-07-23 | 13F | Opulen Financial Group LLC | 8 149 | −3,34 | 649 | 4,01 | ||||
| 2025-08-13 | 13F | Capital Analysts, Inc. | 209 | 0,00 | 0 | |||||
| 2025-08-14 | 13F | Goldman Sachs Group Inc | 43 380 | 0,00 | 3 456 | 7,53 | ||||
| 2025-08-12 | 13F | PSI Advisors, LLC | 0 | −100,00 | 0 | |||||
| 2025-08-08 | 13F | Pnc Financial Services Group, Inc. | 692 | 0,29 | 55 | 7,84 | ||||
| 2025-08-12 | 13F | Ameritas Investment Partners, Inc. | 9 380 | 39,81 | 747 | 50,30 | ||||
| 2025-08-07 | 13F | Vise Technologies, Inc. | 4 978 | 397 | ||||||
| 2025-04-24 | 13F | Loring Wolcott & Coolidge Fiduciary Advisors Llp/ma | 0 | −100,00 | 0 | |||||
| 2025-08-12 | 13F | Franklin Resources Inc | 2 000 | 0,00 | 159 | 7,43 | ||||
| 2025-07-29 | 13F | Financial Futures Ltd Liability Co. | 5 586 | 0,00 | 445 | 7,51 | ||||
| 2025-08-13 | 13F | Flow Traders U.s. Llc | 0 | −100,00 | 0 | |||||
| 2025-08-14 | 13F | Glen Eagle Advisors, LLC | 184 | 0,00 | 15 | 7,69 | ||||
| 2025-08-08 | 13F | Evolution Wealth Advisors, LLC | 4 000 | 0,00 | 319 | 7,43 | ||||
| 2025-08-14 | 13F | Mercer Global Advisors Inc /adv | 81 572 | 6 498 | ||||||
| 2025-08-05 | 13F | Huntington National Bank | 80 | 6,76 | ||||||
| 2025-08-07 | 13F | Summit Asset Management, LLC | 9 855 | 0,00 | 785 | 7,53 | ||||
| 2025-08-06 | 13F | Commonwealth Equity Services, Llc | 382 362 | −4,16 | 30 | 3,45 | ||||
| 2025-08-12 | 13F | Proequities, Inc. | 0 | 0 | ||||||
| 2025-08-26 | 13F/A | Thrivent Financial For Lutherans | 0 | −100,00 | 0 | |||||
| 2025-07-25 | 13F | Means Investment Co., Inc. | 319 053 | 5,32 | 25 416 | 13,25 | ||||
| 2025-08-07 | 13F | Allworth Financial LP | 439 | 0,00 | 35 | 9,68 | ||||
| 2025-08-14 | 13F | CoreCap Advisors, LLC | 1 360 | 0,00 | 108 | 8,00 | ||||
| 2025-08-04 | 13F | Wealth Management Associates, Inc. | 3 822 | 0,00 | 304 | 7,42 | ||||
| 2025-08-13 | 13F | Russell Investments Group, Ltd. | 382 | 5,82 | 30 | 15,38 | ||||
| 2025-07-10 | 13F | Marshall Financial Group LLC | 5 600 | −9,98 | 450 | −2,17 | ||||
| 2025-08-12 | 13F | Archer Investment Corp | 1 099 | 242,37 | 88 | 278,26 | ||||
| 2025-07-17 | 13F | Janney Montgomery Scott LLC | 11 659 | 4,57 | 1 | |||||
| 2025-07-14 | 13F | AdvisorNet Financial, Inc | 977 | 0,21 | 78 | 6,94 | ||||
| 2025-08-05 | 13F | Westside Investment Management, Inc. | 177 | 0,57 | 14 | 7,69 | ||||
| 2025-07-10 | 13F | Wealth Enhancement Advisory Services, Llc | 30 634 | −1,47 | 2 482 | 7,73 | ||||
| 2025-07-31 | 13F | Glass Jacobson Investment Advisors llc | 957 | −2,15 | 76 | 2,70 | ||||
| 2025-08-08 | 13F | Creative Planning | 4 592 | 13,95 | 366 | 22,48 | ||||
| 2025-07-14 | 13F | Matrix Trust Co | 177 216 | 1,39 | 14 | 16,67 | ||||
| 2025-07-28 | 13F | Copia Wealth Management | 10 | 0,00 | 1 | |||||
| 2025-07-25 | 13F | Yarger Wealth Strategies, Llc | 68 964 | 0,25 | 5 494 | 7,79 | ||||
| 2025-07-29 | 13F | Woodard & Co Asset Management Group Inc /adv | 48 553 | −2,79 | 3 868 | 4,51 | ||||
| 2025-08-12 | 13F | MAI Capital Management | 340 | 0,00 | 27 | 8,00 | ||||
| 2025-08-12 | 13F | Bedel Financial Consulting, Inc. | 47 512 | 2,22 | 3 785 | 10,39 | ||||
| 2025-08-11 | 13F | Aptus Capital Advisors, LLC | 108 491 | 2,80 | 8 642 | 10,54 | ||||
| 2025-08-14 | 13F | Hilltop Holdings Inc. | 7 671 | 611 | ||||||
| 2025-08-18 | 13F | Tyler-Stone Wealth Management | 3 526 | 0,00 | 281 | 7,28 | ||||
| 2025-07-24 | 13F | Blair William & Co/il | 19 | 0,00 | 2 | 0,00 | ||||
| 2025-08-13 | 13F | Northwestern Mutual Wealth Management Co | 34 308 | 5,89 | 2 733 | 13,83 | ||||
| 2025-08-19 | 13F | Asset Dedication, LLC | 42 | 0,00 | 3 | 0,00 | ||||
| 2025-08-14 | 13F | Capital Planning Advisors, LLC | 7 963 | 6,27 | 634 | 14,23 | ||||
| 2025-07-07 | 13F | Global Wealth Strategies & Associates | 1 100 | 0,00 | 88 | 7,41 | ||||
| 2025-07-18 | 13F | PFG Investments, LLC | 6 354 | 29,07 | 506 | 39,01 | ||||
| 2025-08-12 | 13F | O'shaughnessy Asset Management, Llc | 2 | 0 | ||||||
| 2025-07-28 | 13F | Harbour Investments, Inc. | 1 930 | −1,43 | 154 | 5,52 | ||||
| 2025-07-21 | 13F | Ameritas Advisory Services, LLC | 370 | 29 | ||||||
| 2025-07-30 | 13F | Financial Perspectives, Inc | 6 138 | 4,12 | 489 | 11,93 | ||||
| 2025-06-11 | 13F | Fortitude Financial, LLC | 70 502 | −85,42 | 5 223 | −85,82 | ||||
| 2025-07-22 | 13F | Olistico Wealth, LLC | 300 | 0,00 | 24 | 4,55 | ||||
| 2025-07-25 | 13F | Apollon Wealth Management, LLC | 10 838 | 0,00 | 863 | 7,61 | ||||
| 2025-08-14 | 13F | Mml Investors Services, Llc | 121 599 | 1,08 | 10 | 12,50 | ||||
| 2025-08-14 | 13F | Ameriprise Financial Inc | 113 909 | −2,91 | 9 074 | 4,46 | ||||
| 2025-08-26 | NP | EQ ADVISORS TRUST - EQ/Mid Cap Value Managed Volatility Portfolio Class IB | 7 464 | 0,00 | 595 | 7,61 | ||||
| 2025-07-25 | 13F | Atria Wealth Solutions, Inc. | 8 727 | −84,34 | 695 | −83,16 | ||||
| 2025-08-14 | 13F | Mariner, LLC | 7 121 | −3,27 | 567 | 4,04 | ||||
| 2025-05-12 | 13F | Independent Advisor Alliance | 0 | −100,00 | 0 | |||||
| 2025-08-04 | 13F | Creative Financial Designs Inc /adv | 153 163 | 2 080,88 | 12 201 | 2 246,15 | ||||
| 2025-08-13 | 13F | M&t Bank Corp | 6 162 | 69,47 | 491 | 82,16 | ||||
| 2025-08-05 | 13F | Plante Moran Financial Advisors, LLC | 1 675 | 0,00 | 133 | 7,26 | ||||
| 2025-08-12 | 13F | Global Retirement Partners, LLC | 11 938 | −16,70 | 951 | −12,92 | ||||
| 2025-08-12 | 13F | J.w. Cole Advisors, Inc. | 13 139 | 1,99 | 1 047 | 9,64 | ||||
| 2025-07-25 | 13F | Lion Street Advisors, LLC | 2 880 | −18,53 | 229 | −12,26 | ||||
| 2025-07-14 | 13F | S.A. Mason LLC | 11 930 | 0,50 | 950 | 8,08 | ||||
| 2025-08-13 | 13F | Cerity Partners LLC | 20 889 | 0,18 | 1 664 | 7,77 | ||||
| 2025-05-09 | 13F | Bouchey Financial Group Ltd | 0 | −100,00 | 0 | |||||
| 2025-08-04 | 13F | Rede Wealth, LLC | 10 445 | 2,99 | 832 | 10,79 | ||||
| 2025-09-04 | 13F/A | Advisor Group Holdings, Inc. | 128 821 | 1,29 | 10 266 | 8,91 | ||||
| 2025-08-14 | 13F | Arete Wealth Advisors, LLC | 2 707 | 0,11 | 0 | |||||
| 2025-07-18 | 13F | Liberty Capital Management, Inc. | 10 200 | 0,00 | 813 | 7,55 | ||||
| 2025-07-24 | 13F | Robertson Stephens Wealth Management, LLC | 3 560 | 0,00 | 284 | 7,60 | ||||
| 2025-07-24 | 13F | IFP Advisors, Inc | 240 | 0,00 | 19 | 11,76 | ||||
| 2025-08-05 | 13F | Tsfg, Llc | 420 | 0,00 | 0 | |||||
| 2025-08-14 | 13F | Glenview Trust Co | 3 887 | 0,00 | 310 | 7,67 | ||||
| 2025-07-14 | 13F | Signature Securities Group Corporation | 23 750 | −1,80 | 1 892 | 5,58 | ||||
| 2025-08-05 | 13F | EPG Wealth Management LLC | 1 423 | −20,86 | 113 | −15,04 | ||||
| 2025-08-14 | 13F | Wells Fargo & Company/mn | 81 593 | −21,23 | 6 500 | −15,30 | ||||
| 2025-08-05 | 13F | Integrity Financial Corp /WA | 220 | 0,00 | 18 | 6,25 | ||||
| 2025-08-05 | 13F | Sunburst Financial Group, LLC | 107 230 | 2,84 | 8 542 | 10,58 | ||||
| 2025-08-01 | 13F | Envestnet Asset Management Inc | 67 204 | 31,88 | 5 353 | 41,80 | ||||
| 2025-07-22 | 13F | Merit Financial Group, LLC | 27 254 | 10,63 | 2 171 | 18,96 | ||||
| 2025-05-08 | 13F | NorthRock Partners, LLC | 0 | −100,00 | 0 | |||||
| 2025-07-18 | 13F | Philip James Wealth Mangement, LLC | 5 694 | 0,33 | 454 | 7,86 | ||||
| 2025-08-12 | 13F | NFP Retirement, Inc. | 4 803 | 0,00 | 383 | 7,61 | ||||
| 2025-07-31 | 13F/A | Avion Wealth | 643 | 0,00 | 0 | |||||
| 2025-08-13 | 13F | Jones Financial Companies Lllp | 4 402 | 29,78 | 348 | 39,76 | ||||
| 2025-07-08 | 13F | Apella Capital, LLC | 11 532 | 0,00 | 928 | 13,60 | ||||
| 2025-08-12 | 13F | Clearwater Capital Advisors, LLC | 3 446 | 0,00 | 275 | 7,45 | ||||
| 2025-08-19 | 13F | Cape Investment Advisory, Inc. | 1 786 | 0,00 | 142 | 7,58 | ||||
| 2025-08-11 | 13F | Western Wealth Management, LLC | 0 | −100,00 | 0 | |||||
| 2025-08-12 | 13F | LPL Financial LLC | 498 843 | 9,97 | 39 738 | 18,25 | ||||
| 2025-07-17 | 13F | Global Trust Asset Management, LLC | 12 | 0,00 | 1 | |||||
| 2025-08-11 | 13F | Citigroup Inc | 4 103 | −2,10 | 327 | 5,16 | ||||
| 2025-04-30 | 13F | Sofos Investments, Inc. | 328 | 0,00 | 24 | 9,09 | ||||
| 2025-08-08 | 13F | Cetera Investment Advisers | 181 928 | 0,89 | 14 492 | 8,49 | ||||
| 2025-08-12 | 13F | CIBC Private Wealth Group, LLC | 7 264 | −23,58 | 579 | −6,92 | ||||
| 2025-08-11 | 13F | Principal Securities, Inc. | 316 | −22,55 | 25 | −19,35 | ||||
| 2025-08-14 | 13F | Matrix Private Capital Group Llc | 2 617 | −3,25 | 208 | 4,00 | ||||
| 2025-07-31 | 13F | Carnegie Capital Asset Management, LLC | 6 935 | 552 | ||||||
| 2025-07-18 | 13F | Benchmark Wealth Management, LLC | 55 403 | 0,04 | 4 413 | 7,58 | ||||
| 2025-08-04 | 13F | Jim Saulnier & Associates, Llc | 17 856 | −7,91 | 1 422 | −0,97 | ||||
| 2025-08-15 | 13F | Morgan Stanley | 1 254 715 | 5,02 | 99 951 | 12,93 | ||||
| 2025-08-12 | 13F | Howe & Rusling Inc | 1 736 | 138 | ||||||
| 2025-07-28 | 13F | RFG Advisory, LLC | 3 051 | −3,91 | 243 | 3,40 | ||||
| 2025-07-17 | 13F | Sound Income Strategies, LLC | 280 | 0,00 | 22 | 10,00 | ||||
| 2025-07-21 | 13F | Patriot Financial Group Insurance Agency, LLC | 38 738 | 8,69 | 3 086 | 16,86 | ||||
| 2025-08-01 | 13F | Boyd Watterson Asset Management Llc/oh | 184 | 0,00 | 15 | 7,69 | ||||
| 2025-08-04 | 13F | Adell Harriman & Carpenter Inc | 4 300 | 0,00 | 343 | 7,55 | ||||
| 2025-07-11 | 13F | Farther Finance Advisors, LLC | 42 691 | 1 347,15 | 3 401 | 1 452,51 | ||||
| 2025-08-11 | 13F | HighTower Advisors, LLC | 43 592 | 0,00 | 3 473 | 7,53 | ||||
| 2025-04-10 | 13F | Portside Wealth Group, LLC | 0 | −100,00 | 0 | −100,00 | ||||
| 2025-07-18 | 13F | Centricity Wealth Management, LLC | 308 | 0,00 | 25 | 9,09 | ||||
| 2025-08-14 | 13F | Integrated Wealth Concepts LLC | 6 860 | 0,18 | 546 | 7,69 | ||||
| 2025-08-14 | 13F | Fmr Llc | 14 672 | −12,54 | 1 169 | −5,96 | ||||
| 2025-08-15 | 13F | CI Private Wealth, LLC | 9 450 | 20,41 | 753 | 29,43 | ||||
| 2025-07-09 | 13F | Procyon Private Wealth Partners, LLC | 4 594 | 0,15 | 366 | 7,67 | ||||
| 2025-07-17 | 13F | XML Financial, LLC | 3 740 | −1,24 | 298 | 6,07 | ||||
| 2025-08-04 | 13F | Pensionmark Financial Group, Llc | 19 056 | −7,99 | 1 518 | −1,04 | ||||
| 2025-08-08 | 13F | Avantax Advisory Services, Inc. | 83 245 | 1,08 | 6 631 | 8,69 | ||||
| 2025-08-15 | 13F | Tower Research Capital LLC (TRC) | 0 | −100,00 | 0 | |||||
| 2025-08-07 | 13F | 49 Wealth Management, Llc | 4 790 | 0,34 | 382 | 7,93 | ||||
| 2025-08-08 | 13F | Gts Securities Llc | 0 | −100,00 | 0 | |||||
| 2025-08-14 | 13F | Raymond James Financial Inc | 317 974 | −1,15 | 25 330 | 6,29 | ||||
| 2025-08-14 | 13F | IHT Wealth Management, LLC | 4 711 | −0,32 | 375 | 7,14 | ||||
| 2025-08-06 | 13F | Decker Retirement Planning Inc. | 17 | 0,00 | 1 | 0,00 | ||||
| 2025-07-29 | 13F | Goldstein Advisors, LLC | 39 303 | 4,60 | 3 131 | 12,47 | ||||
| 2025-07-09 | 13F | Brand Asset Management Group, Inc. | 36 400 | 1,20 | 2 900 | 8,82 | ||||
| 2025-08-13 | 13F | Summit Wealth Group Llc / Co | 3 825 | 305 | ||||||
| 2025-05-14 | 13F | Jane Street Group, Llc | 0 | −100,00 | 0 | |||||
| 2025-08-14 | 13F | Bank Of America Corp /de/ | 92 496 | 3,33 | 7 368 | 11,11 | ||||
| 2025-08-12 | 13F | Jpmorgan Chase & Co | 25 892 | 3,99 | 2 063 | 11,82 | ||||
| 2025-08-14 | 13F | Comerica Bank | 6 077 | 6,15 | 484 | 14,15 | ||||
| 2025-08-08 | 13F | Foundations Investment Advisors, LLC | 3 161 | 0,00 | 252 | 7,26 | ||||
| 2025-08-06 | 13F | Savant Capital, LLC | 5 284 | 0,00 | 421 | 7,42 | ||||
| 2025-08-15 | 13F | Equitable Holdings, Inc. | 34 725 | 7,43 | 2 766 | 15,54 | ||||
| 2025-05-14 | 13F | Van Hulzen Asset Management, LLC | 0 | −100,00 | 0 | |||||
| 2025-07-18 | 13F | Truist Financial Corp | 23 209 | −1,44 | 1 849 | 5,96 | ||||
| 2025-08-14 | 13F | Royal Bank Of Canada | 53 929 | 16,56 | 4 296 | 25,32 | ||||
| 2025-07-23 | 13F | Kingswood Wealth Advisors, Llc | 0 | −100,00 | 0 | |||||
| 2025-04-21 | 13F | Nelson, Van Denburg & Campbell Wealth Management Group, LLC | 0 | −100,00 | 0 | |||||
| 2025-07-18 | 13F | Parsons Capital Management Inc/ri | 17 498 | −1,80 | 1 394 | 5,53 | ||||
| 2025-07-28 | 13F | Mutual Advisors, LLC | 4 520 | 0,00 | 372 | 13,46 | ||||
| 2025-07-30 | 13F | Whittier Trust Co Of Nevada Inc | 68 | 0,00 | 5 | 0,00 | ||||
| 2025-07-09 | 13F | Pps&v Asset Management Consultants, Inc. | 3 851 | 0,00 | 307 | 7,37 | ||||
| 2025-08-14 | 13F | Silvercrest Asset Management Group Llc | 3 089 | 0,00 | 246 | 7,89 | ||||
| 2025-07-10 | 13F | Three Seasons Wealth, LLC | 4 686 | −0,66 | 373 | 6,88 | ||||
| 2025-08-14 | 13F | Susquehanna International Group, Llp | 0 | −100,00 | 0 | |||||
| 2025-08-14 | 13F | GWM Advisors LLC | 2 001 | 0,25 | 159 | 8,16 | ||||
| 2025-08-08 | 13F | WASHINGTON TRUST Co | 0 | −100,00 | 0 | |||||
| 2025-07-22 | 13F | Steele Capital Management, Inc. | 177 217 | 1,39 | 14 117 | 9,03 | ||||
| 2025-05-28 | 13F | Silicon Valley Capital Partners | 954 | 70 | ||||||
| 2025-08-15 | 13F | Kestra Advisory Services, LLC | 47 602 | 11,28 | 3 792 | 19,63 | ||||
| 2025-08-08 | 13F | Capital Investment Advisory Services, LLC | 96 | 8 | ||||||
| 2025-08-13 | 13F | Proactive Wealth Strategies LLC | 4 256 | 0,33 | 0 | |||||
| 2025-07-31 | 13F | Briaud Financial Planning, Inc | 60 | 0,00 | 0 | |||||
| 2025-05-08 | 13F | Empirical Financial Services, LLC d.b.a. Empirical Wealth Management | 0 | −100,00 | 0 | |||||
| 2025-07-21 | 13F | Triad Wealth Partners, LLC | 7 632 | 608 | ||||||
| 2025-07-22 | 13F | Miracle Mile Advisors, LLC | 8 522 | −18,80 | 679 | −12,74 | ||||
| 2025-04-30 | 13F | Stratos Wealth Partners, LTD. | 0 | −100,00 | 0 | |||||
| 2025-08-04 | 13F | Assetmark, Inc | 2 383 | −76,52 | 190 | −74,83 | ||||
| 2025-07-23 | 13F | RMG Wealth Management LLC | 1 083 709 | 87 672 | ||||||
| 2025-07-29 | 13F | Salomon & Ludwin, LLC | 241 | 0,00 | 19 | 11,76 | ||||
| 2025-08-12 | 13F | Steward Partners Investment Advisory, Llc | 2 163 | 0,84 | 172 | 8,86 | ||||
| 2025-08-12 | 13F | Gladstone Institutional Advisory LLC | 67 124 | −0,44 | 5 347 | 7,07 | ||||
| 2025-07-14 | 13F | Farmers & Merchants Investments Inc | 3 012 | 0,00 | 240 | 7,17 | ||||
| 2025-07-31 | 13F | Schneider Downs Wealth Management Advisors, LP | 4 053 | 323 | ||||||
| 2025-07-11 | 13F | Kaydan Wealth Management, Inc. | 5 392 | 0,00 | 430 | 7,52 | ||||
| 2025-08-18 | 13F | Geneos Wealth Management Inc. | 4 480 | 100,00 | 357 | 115,76 | ||||
| 2025-05-14 | 13F | Mission Creek Capital Partners, Inc. | 0 | −100,00 | 0 | |||||
| 2025-08-05 | 13F | Bank Of Montreal /can/ | 0 | −100,00 | 0 | |||||
| 2025-07-24 | 13F | Edge Financial Advisors LLC | 3 114 | 250 | ||||||
| 2025-07-10 | 13F | Security National Bank | 100 | 0,00 | 8 | 0,00 | ||||
| 2025-08-01 | 13F | SYM FINANCIAL Corp | 228 | 18 | ||||||
| 2025-07-14 | 13F | Sowell Financial Services LLC | 38 539 | 3 070 | ||||||
| 2025-08-11 | 13F | Private Advisor Group, LLC | 2 893 | 4,82 | 230 | 12,75 |