Grunnleggende statistikk
| Institusjonelle eiere | 115 total, 115 long only, 0 short only, 0 long/short - change of −3,36% MRQ |
| Gjennomsnittlig porteføljeallokering | 0.0883 % - change of −5,66% MRQ |
| Institusjonelle aksjer (Long) | 37 968 578 (ex 13D/G) - change of −1,25MM shares −3,19% MRQ |
| Institusjonell verdi (Long) | $ 179 103 USD ($1000) |
Institusjonelt eierskap og aksjonærer
CBRE Global Real Estate Income Fund (US:IGR) har 115 institusjonelle eiere og aksjonærer som har sendt inn 13D/G- eller 13F-skjemaer til Securities Exchange Commission (SEC). Disse institusjonene eier til sammen 37,968,578 aksjer. De største aksjonærene inkluderer Morgan Stanley, UBS Group AG, Penserra Capital Management LLC, YYY - Amplify High Income ETF, Flagship Harbor Advisors, Llc, Bank Of America Corp /de/, Wells Fargo & Company/mn, Ameriprise Financial Inc, LPL Financial LLC, and Pacific Wealth Strategies Group, Inc. .
CBRE Global Real Estate Income Fund (NYSE:IGR) institusjonell eierstruktur viser nåværende posisjoner i selskapet fordelt på institusjoner og fond, samt de siste endringene i posisjonsstørrelse. De største aksjonærene kan være individuelle investorer, verdipapirfond, hedgefond eller institusjoner. Schedule 13D indikerer at investoren eier (eller har eid) mer enn 5 % av selskapet og har til hensikt (eller hadde til hensikt) å aktivt forfølge en endring i forretningsstrategien. Schedule 13G indikerer en passiv investering på over 5 %.
The share price as of September 12, 2025 is 5,15 / share. Previously, on September 13, 2024, the share price was 6,62 / share. This represents a decline of 22,21% over that period.

Fondssentiment-score
Fondssentiment Score (også kjent som akkumulering av eierskap poengsum) viser hvilke aksjer som er mest kjøpt av fond. Den er resultatet av en sofistikert, kvantitativ flerfaktormodell som identifiserer selskaper med de høyeste nivåene av institusjonell akkumulering. Beregningsmodellen for poeng bruker en kombinasjon av den totale økningen i antall offentliggjorte eiere, endringer i porteføljeallokeringen til disse eierne og andre beregninger. Tallet går fra 0 til 100, der høyere tall indikerer en høyere grad av akkumulering i forhold til sammenlignbare selskaper, der 50 er gjennomsnittet.
Oppdateringsfrekvens: Daglig
Sjekk ut Ownership Explorer, som inneholder en liste over de høyest rangerte selskapene.
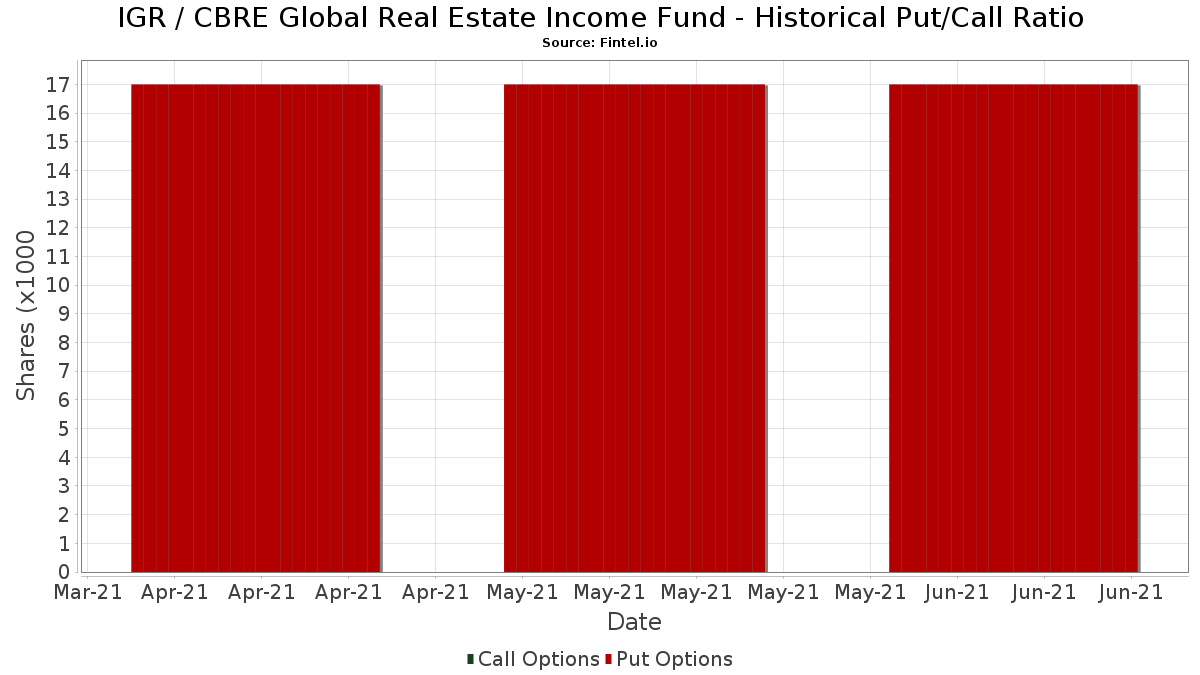
Institusjonell Put/Call-forhold
I tillegg til å rapportere standard aksje- og gjeldsemisjoner må institusjoner med mer enn 100 millioner kroner i forvaltningskapital også oppgi beholdningen av put- og callopsjoner. Siden put-opsjoner generelt indikerer et negativt sentiment, og call-opsjoner indikerer et positivt sentiment, kan vi få et inntrykk av det generelle institusjonelle sentimentet ved å plotte forholdet mellom put- og call-opsjoner. Diagrammet til høyre viser det historiske forholdet mellom put- og call-opsjoner for dette instrumentet.
Ved å bruke Put/Call-forholdet som en indikator på investorsentimentet kan man overvinne en av de viktigste svakhetene ved å bruke totalt institusjonelt eierskap, nemlig at en betydelig andel av forvaltningskapitalen investeres passivt for å følge indekser. Passivt forvaltede fond kjøper vanligvis ikke opsjoner, slik at indikatoren for put/call-forhold i større grad gjenspeiler stemningen i aktivt forvaltede fond.
13F- og NPORT-arkiveringer
Detaljer om 13F-arkiveringer er gratis. Detaljer om NP-arkiveringer krever et premium-medlemskap. Grønne rader indikerer nye posisjoner. Røde rader indikerer lukkede posisjoner. Klikk på lenke ikonet for å se hele transaksjonshistorikken.
Oppgrader
for å låse opp premiedata og eksportere til Excel. ![]() .
.
| Fildato | Kilde | Investor | Type | Gjennomsnittlig pris (estimert) |
Aksjer | Δ Aksjer (%) |
Rapportert verdi ($1000) | Verdi (%) | Portallokering (%) | |
|---|---|---|---|---|---|---|---|---|---|---|
| 2025-08-11 | 13F | Private Advisor Group, LLC | 14 953 | 0,00 | 79 | 2,60 | ||||
| 2025-08-07 | 13F | Kestra Private Wealth Services, Llc | 24 600 | 0,00 | 130 | 3,17 | ||||
| 2025-05-08 | 13F | Harbour Investments, Inc. | 0 | −100,00 | 0 | |||||
| 2025-05-08 | 13F | XTX Topco Ltd | 0 | −100,00 | 0 | |||||
| 2025-08-01 | 13F | Transcend Wealth Collective, Llc | 0 | −100,00 | 0 | |||||
| 2025-08-06 | 13F | Golden State Wealth Management, LLC | 900 | 0,00 | 5 | 0,00 | ||||
| 2025-08-14 | 13F | IHT Wealth Management, LLC | 97 489 | −0,96 | 516 | 1,58 | ||||
| 2025-07-11 | 13F | Seacrest Wealth Management, Llc | 42 345 | 7,77 | 224 | 10,89 | ||||
| 2025-08-14 | 13F | Royal Bank Of Canada | 479 852 | 31,38 | 2 538 | 34,64 | ||||
| 2025-08-07 | 13F | Samalin Investment Counsel, LLC | 90 111 | 2,12 | 477 | 4,62 | ||||
| 2025-08-14 | 13F | Mercer Global Advisors Inc /adv | 0 | −100,00 | 0 | |||||
| 2025-08-13 | 13F | Rsm Us Wealth Management Llc | 76 339 | −10,17 | 404 | −7,99 | ||||
| 2025-07-18 | 13F | Cooper Financial Group | 236 055 | 3,12 | 1 249 | 5,67 | ||||
| 2025-08-18 | 13F | Geneos Wealth Management Inc. | 40 688 | −13,00 | 215 | −10,79 | ||||
| 2025-07-22 | 13F | Merit Financial Group, LLC | 78 690 | 33,71 | 416 | 37,29 | ||||
| 2025-07-18 | 13F | SOA Wealth Advisors, LLC. | 174 | 3,57 | 1 | |||||
| 2025-05-13 | 13F | HighTower Advisors, LLC | 0 | −100,00 | 0 | −100,00 | ||||
| 2025-07-09 | 13F | Sunpointe, LLC | 84 900 | 449 | ||||||
| 2025-08-05 | 13F | Pacific Wealth Strategies Group, Inc. | 635 083 | −10,06 | 3 074 | −15,65 | ||||
| 2025-08-14 | 13F | Stifel Financial Corp | 225 100 | 1,94 | 1 191 | 4,48 | ||||
| 2025-08-14 | 13F | Ameriprise Financial Inc | 945 863 | 5,35 | 5 004 | 8,03 | ||||
| 2025-07-21 | 13F | Future Financial Wealth Managment LLC | 10 000 | 0,00 | 53 | 1,96 | ||||
| 2025-08-12 | 13F | LPL Financial LLC | 943 534 | 11,16 | 4 991 | 13,98 | ||||
| 2025-08-04 | 13F | Spire Wealth Management | 523 | 0,00 | 3 | 0,00 | ||||
| 2025-08-12 | 13F | Jpmorgan Chase & Co | 0 | −100,00 | 0 | |||||
| 2025-07-14 | 13F | Pacifica Partners Inc. | 550 | 0,00 | 3 | 0,00 | ||||
| 2025-08-11 | 13F | One Capital Management, LLC | 13 552 | 0,00 | 72 | 2,90 | ||||
| 2025-08-12 | 13F | Coldstream Capital Management Inc | 0 | −100,00 | 0 | |||||
| 2025-08-13 | 13F | Colonial Trust Advisors | 2 750 | 15 | ||||||
| 2025-08-19 | 13F | National Asset Management, Inc. | 21 093 | 1,34 | 112 | 11,00 | ||||
| 2025-08-15 | 13F | Prevail Innovative Wealth Advisors, Llc | 316 674 | 11,55 | 1 675 | 14,41 | ||||
| 2025-08-11 | 13F | PFG Private Wealth Management, LLC | 0 | −100,00 | 0 | |||||
| 2025-07-10 | 13F | Stolper Co | 105 933 | 8,33 | 1 | |||||
| 2025-08-14 | 13F | EP Wealth Advisors, Inc. | 35 249 | 0,00 | 186 | 2,76 | ||||
| 2025-07-16 | 13F | Investment Partners Asset Management, Inc. | 173 024 | −0,21 | 915 | 2,35 | ||||
| 2025-07-25 | 13F | Cwm, Llc | 3 621 | 0,00 | 0 | |||||
| 2025-08-14 | 13F | Mariner, LLC | 85 415 | 3,60 | 452 | 6,12 | ||||
| 2025-08-14 | 13F | Moneta Group Investment Advisors Llc | 0 | −100,00 | 0 | |||||
| 2025-05-12 | 13F | Fmr Llc | 0 | −100,00 | 0 | |||||
| 2025-08-05 | 13F | Bank of New York Mellon Corp | 0 | −100,00 | 0 | |||||
| 2025-08-12 | 13F | Evelyn Partners Asset Management Ltd | 2 823 | 15 | ||||||
| 2025-08-14 | 13F | Two Sigma Securities, Llc | 0 | −100,00 | 0 | |||||
| 2025-08-04 | 13F | Flagship Harbor Advisors, Llc | 1 916 196 | 3,34 | 10 137 | 5,94 | ||||
| 2025-07-25 | 13F | Hazlett, Burt & Watson, Inc. | 1 000 | 0,00 | 0 | |||||
| 2025-05-13 | 13F | SFI Advisors, LLC | 0 | −100,00 | 0 | |||||
| 2025-07-31 | 13F | 180 Wealth Advisors, Llc | 165 457 | −0,37 | 875 | 2,58 | ||||
| 2025-08-13 | 13F | Fiduciary Group LLC | 15 953 | 6,50 | 84 | 9,09 | ||||
| 2025-08-14 | 13F | GWM Advisors LLC | 42 605 | 123,18 | 225 | 129,59 | ||||
| 2025-07-24 | 13F | Leo Wealth, LLC | 13 981 | 3,60 | 74 | 5,80 | ||||
| 2025-08-14 | 13F | Bank Of America Corp /de/ | 1 845 097 | 0,13 | 9 761 | 2,65 | ||||
| 2025-07-21 | 13F | Ameriflex Group, Inc. | 4 200 | −85,31 | 22 | −85,71 | ||||
| 2025-05-14 | 13F | Susquehanna International Group, Llp | 0 | −100,00 | 0 | |||||
| 2025-08-08 | 13F | Larson Financial Group LLC | 6 000 | 0,00 | 32 | 3,33 | ||||
| 2025-08-11 | 13F | Citigroup Inc | 2 | 0,00 | 0 | |||||
| 2025-08-15 | 13F | Captrust Financial Advisors | 39 877 | 211 | ||||||
| 2025-08-11 | 13F | Actinver Wealth Management, Inc. | 22 442 | 30,43 | 119 | 34,09 | ||||
| 2025-07-23 | 13F | Clear Creek Financial Management, LLC | 0 | −100,00 | 0 | |||||
| 2025-08-13 | 13F | Baird Financial Group, Inc. | 60 734 | −8,60 | 321 | −6,14 | ||||
| 2025-07-10 | 13F | Wealth Enhancement Advisory Services, Llc | 66 389 | −1,71 | 356 | 2,01 | ||||
| 2025-08-12 | 13F | MAI Capital Management | 1 286 | 365,94 | 7 | 500,00 | ||||
| 2025-08-13 | 13F | Guggenheim Capital Llc | 64 197 | −2,40 | 340 | 0,00 | ||||
| 2025-05-12 | 13F | Peapack Gladstone Financial Corp | 0 | −100,00 | 0 | |||||
| 2025-09-09 | 13F | NWF Advisory Services Inc. | 273 500 | −0,94 | 1 447 | 1,54 | ||||
| 2025-08-12 | 13F | J.w. Cole Advisors, Inc. | 431 757 | 2,81 | 2 284 | 5,35 | ||||
| 2025-08-07 | 13F | Addison Advisors LLC | 61 | 0,00 | 0 | |||||
| 2025-08-11 | 13F | Nations Financial Group Inc, /ia/ /adv | 14 436 | 0,00 | 76 | 2,70 | ||||
| 2025-08-18 | 13F/A | National Bank Of Canada /fi/ | 55 845 | 1 560,08 | 295 | 1 629,41 | ||||
| 2025-08-06 | 13F | Commonwealth Equity Services, Llc | 80 608 | −39,27 | 0 | |||||
| 2025-04-30 | 13F | Heritage Wealth Management, Inc. /CA/ | 0 | −100,00 | 0 | |||||
| 2025-07-07 | 13F | Nova Wealth Management, Inc. | 7 897 | 0,00 | 42 | 2,50 | ||||
| 2025-08-06 | 13F | AE Wealth Management LLC | 12 700 | 67 | ||||||
| 2025-04-16 | 13F | Caldwell Securities, Inc | 0 | −100,00 | 0 | |||||
| 2025-08-04 | 13F | Creative Financial Designs Inc /adv | 1 315 | 0,00 | 7 | 0,00 | ||||
| 2025-07-17 | 13F | Janney Montgomery Scott LLC | 53 273 | 0,61 | 0 | |||||
| 2025-08-13 | 13F | Northwestern Mutual Wealth Management Co | 7 766 | 41 | ||||||
| 2025-07-31 | 13F | Cambridge Investment Research Advisors, Inc. | 52 563 | −2,92 | 0 | |||||
| 2025-08-28 | NP | YYY - Amplify High Income ETF | 3 658 899 | 2,00 | 19 356 | 4,57 | ||||
| 2025-05-16 | 13F | Jones Financial Companies Lllp | 0 | −100,00 | 0 | |||||
| 2025-08-12 | 13F | Proequities, Inc. | 0 | 0 | ||||||
| 2025-04-24 | 13F | Decker Retirement Planning Inc. | 0 | −100,00 | 0 | |||||
| 2025-07-29 | 13F | Stephens Inc /ar/ | 10 278 | −2,59 | 54 | 0,00 | ||||
| 2025-08-04 | 13F | Assetmark, Inc | 144 | 0,00 | 1 | |||||
| 2025-07-30 | 13F | Blume Capital Management, Inc. | 3 000 | 0,00 | 16 | 0,00 | ||||
| 2025-05-14 | 13F | Landscape Capital Management, L.l.c. | 0 | −100,00 | 0 | |||||
| 2025-08-08 | 13F | Schwarz Dygos Wheeler Investment Advisors Llc | 291 921 | 8,65 | 1 544 | 11,40 | ||||
| 2025-07-25 | 13F | We Are One Seven, LLC | 18 336 | 9,93 | 97 | 11,63 | ||||
| 2025-07-30 | 13F | Roman Butler Fullerton & Co | 257 529 | 1,18 | 1 282 | 6,74 | ||||
| 2025-07-14 | 13F | Sowell Financial Services LLC | 11 798 | −55,79 | 62 | −54,74 | ||||
| 2025-05-19 | 13F/A | Jane Street Group, Llc | 0 | −100,00 | 0 | −100,00 | ||||
| 2025-07-14 | 13F | GAMMA Investing LLC | 12 | 0 | ||||||
| 2025-08-15 | 13F | Tower Research Capital LLC (TRC) | 45 | 0 | ||||||
| 2025-08-14 | 13F | CoreCap Advisors, LLC | 2 153 | 0,00 | 11 | 0,00 | ||||
| 2025-08-14 | 13F | Atomi Financial Group, Inc. | 100 808 | −0,67 | 533 | 1,91 | ||||
| 2025-08-14 | 13F | Comerica Bank | 31 339 | −9,92 | 166 | −7,82 | ||||
| 2025-04-14 | 13F | Daymark Wealth Partners, Llc | 0 | −100,00 | 0 | |||||
| 2025-07-17 | 13F/A | Capital Investment Advisors, LLC | 12 982 | −7,44 | 69 | −5,56 | ||||
| 2025-07-10 | 13F | Atticus Wealth Management, Llc | 7 340 | 41,05 | 39 | 46,15 | ||||
| 2025-07-25 | 13F | Atria Wealth Solutions, Inc. | 53 750 | 0,00 | 285 | 2,53 | ||||
| 2025-07-14 | 13F | Occidental Asset Management, LLC | 15 844 | −11,42 | 84 | −9,78 | ||||
| 2025-08-13 | 13F | Level Four Advisory Services, Llc | 14 409 | −35,90 | 76 | −33,91 | ||||
| 2025-05-14 | 13F | Walleye Capital LLC | 0 | −100,00 | 0 | |||||
| 2025-08-14 | 13F | Hrt Financial Lp | 0 | −100,00 | 0 | |||||
| 2025-08-11 | 13F | Elequin Capital Lp | 0 | −100,00 | 0 | |||||
| 2025-08-14 | 13F | Raymond James Financial Inc | 166 585 | 7,17 | 881 | 9,85 | ||||
| 2025-05-09 | 13F | Shaker Financial Services, LLC | 0 | −100,00 | 0 | |||||
| 2025-05-16 | 13F | Coppell Advisory Solutions LLC | 0 | −100,00 | 0 | |||||
| 2025-05-20 | 13F/A | Colony Group, LLC | 0 | −100,00 | 0 | −100,00 | ||||
| 2025-08-11 | 13F | United Capital Financial Advisers, Llc | 10 447 | 0,00 | 55 | 3,77 | ||||
| 2025-08-08 | 13F | Good Life Advisors, LLC | 14 181 | −0,43 | 75 | 2,74 | ||||
| 2025-08-13 | 13F | WealthTrust Axiom LLC | 352 815 | 0,18 | 1 866 | 2,70 | ||||
| 2025-09-04 | 13F/A | Advisor Group Holdings, Inc. | 506 876 | 4,21 | 2 681 | 6,86 | ||||
| 2025-08-12 | 13F | Steward Partners Investment Advisory, Llc | 13 104 | −24,86 | 69 | −22,47 | ||||
| 2025-07-10 | 13F | Kozak & Associates, Inc. | 1 931 | 10 | ||||||
| 2025-08-05 | 13F | Holistic Financial Partners | 14 440 | 0,00 | 76 | 2,70 | ||||
| 2025-08-14 | 13F | Ieq Capital, Llc | 20 141 | −6,07 | 107 | −3,64 | ||||
| 2025-08-11 | 13F | WPG Advisers, LLC | 7 261 | −30,72 | 38 | −29,63 | ||||
| 2025-07-14 | 13F | Park Avenue Securities Llc | 41 403 | −13,00 | 0 | |||||
| 2025-07-21 | 13F | Ameritas Advisory Services, LLC | 19 010 | 79,17 | 101 | 92,31 | ||||
| 2025-05-09 | 13F | Cornerstone Advisors, LLC | 0 | −100,00 | 0 | −100,00 | ||||
| 2025-07-24 | 13F | Us Bancorp \de\ | 45 074 | 0,00 | 238 | 2,59 | ||||
| 2025-08-07 | 13F | Allworth Financial LP | 1 809 | 3 073,68 | 10 | |||||
| 2025-08-12 | 13F | Advisors Asset Management, Inc. | 121 136 | −60,95 | 641 | −60,00 | ||||
| 2025-08-06 | 13F | Mark Sheptoff Financial Planning, Llc | 1 000 | 0,00 | 5 | 0,00 | ||||
| 2025-07-28 | 13F | Axxcess Wealth Management, Llc | 16 538 | −4,81 | 87 | −2,25 | ||||
| 2025-08-05 | 13F | Sigma Planning Corp | 19 820 | 1,11 | 105 | 2,97 | ||||
| 2025-08-01 | 13F | Envestnet Asset Management Inc | 21 237 | 112 | ||||||
| 2025-07-30 | 13F | Whittier Trust Co | 5 | 0 | ||||||
| 2025-07-15 | 13F | Highland Financial Advisors, LLC | 11 600 | 61 | ||||||
| 2025-07-31 | 13F | Leavell Investment Management, Inc. | 12 500 | 0,00 | 66 | 3,13 | ||||
| 2025-08-29 | 13F | Centaurus Financial, Inc. | 0 | −100,00 | 0 | |||||
| 2025-07-29 | 13F | Private Trust Co Na | 1 000 | 0,00 | 5 | 0,00 | ||||
| 2025-07-25 | 13F | GFS Advisors, LLC | 0 | −100,00 | 0 | |||||
| 2025-08-06 | 13F | Moors & Cabot, Inc. | 73 113 | 2,48 | 387 | 4,89 | ||||
| 2025-08-12 | 13F | Global Retirement Partners, LLC | 22 286 | 0,02 | 118 | 9,35 | ||||
| 2025-05-02 | 13F | BlackRock, Inc. | 0 | −100,00 | 0 | |||||
| 2025-08-11 | 13F | Principal Securities, Inc. | 1 576 | 88,07 | 8 | 100,00 | ||||
| 2025-05-12 | 13F | Wolverine Asset Management Llc | 0 | −100,00 | 0 | |||||
| 2025-04-23 | 13F | Walkner Condon Financial Advisors LLC | 0 | −100,00 | 0 | |||||
| 2025-08-08 | 13F | Pnc Financial Services Group, Inc. | 36 662 | −21,09 | 194 | −19,25 | ||||
| 2025-08-15 | 13F | Morgan Stanley | 10 482 631 | −8,82 | 55 453 | −6,52 | ||||
| 2025-08-08 | 13F | Cetera Investment Advisers | 386 511 | 11,62 | 2 045 | 14,45 | ||||
| 2025-08-11 | 13F | Alteri Wealth LLC | 49 327 | 0,00 | 261 | 2,36 | ||||
| 2025-08-05 | 13F | Burney Co/ | 25 437 | 3,20 | 135 | 5,51 | ||||
| 2025-08-14 | 13F | Wells Fargo & Company/mn | 1 585 773 | 3,01 | 8 389 | 5,60 | ||||
| 2025-08-14 | 13F | UBS Group AG | 5 346 993 | −0,09 | 28 286 | 2,43 | ||||
| 2025-08-04 | 13F | Live Oak Private Wealth LLC | 54 884 | 0,00 | 290 | 2,47 | ||||
| 2025-08-05 | 13F | Tsfg, Llc | 1 500 | 0,00 | 0 | |||||
| 2025-05-06 | 13F | Readystate Asset Management Lp | 0 | −100,00 | 0 | −100,00 | ||||
| 2025-07-07 | 13F | Centurion Wealth Management LLC | 10 295 | 0,00 | 54 | 10,20 | ||||
| 2025-08-14 | 13F/A | Rockefeller Capital Management L.P. | 199 200 | 33,58 | 1 054 | 36,93 | ||||
| 2025-07-21 | 13F | Quattro Financial Advisors Llc | 40 291 | 0,00 | 213 | 2,90 | ||||
| 2025-08-06 | 13F | Penserra Capital Management LLC | 3 696 579 | 3,05 | 20 | 5,56 |