Grunnleggende statistikk
| Institusjonelle eiere | 91 total, 91 long only, 0 short only, 0 long/short - change of 1,10% MRQ |
| Gjennomsnittlig porteføljeallokering | 0.5299 % - change of −14,23% MRQ |
| Institusjonelle aksjer (Long) | 11 878 824 (ex 13D/G) - change of −0,20MM shares −1,68% MRQ |
| Institusjonell verdi (Long) | $ 262 727 USD ($1000) |
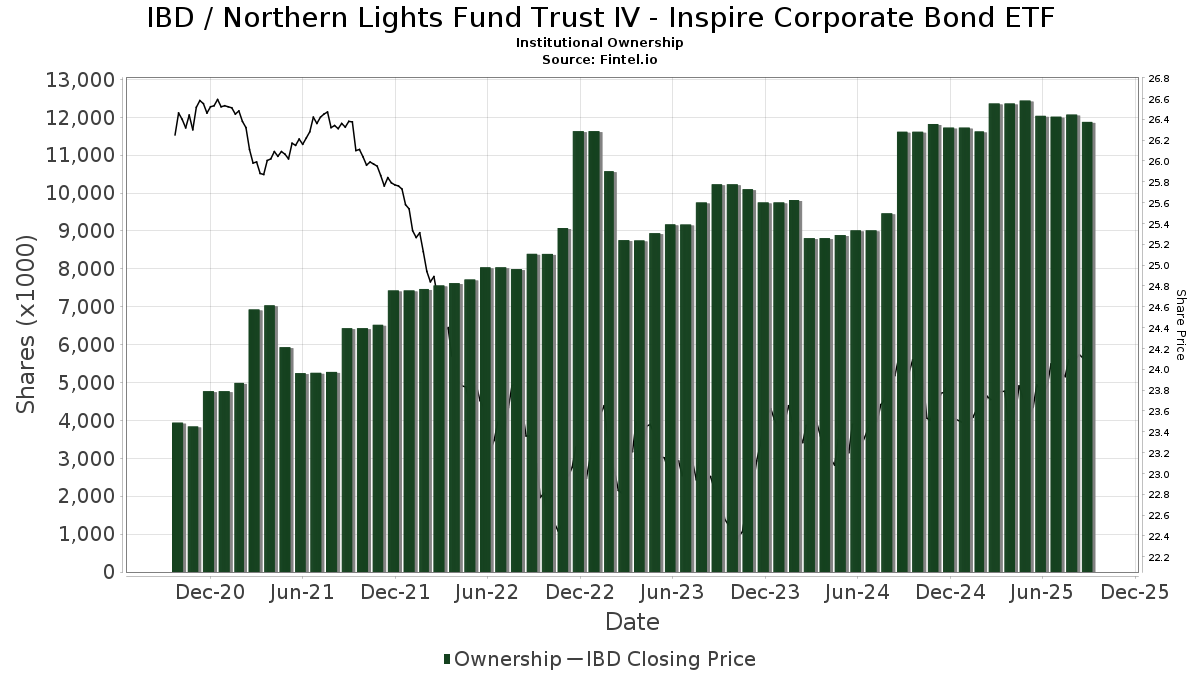
Institusjonelt eierskap og aksjonærer
Northern Lights Fund Trust IV - Inspire Corporate Bond ETF (US:IBD) har 91 institusjonelle eiere og aksjonærer som har sendt inn 13D/G- eller 13F-skjemaer til Securities Exchange Commission (SEC). Disse institusjonene eier til sammen 11,878,824 aksjer. De største aksjonærene inkluderer Inspire Advisors, LLC, Ambassador Advisors, LLC, Creative Financial Designs Inc /adv, Bare Financial Services, Inc, Change Path, LLC, CWM Advisors, LLC, Christian Investment Advisors, Inc., PAX Financial Group, LLC, LPL Financial LLC, and OneAscent Wealth Management LLC .
Northern Lights Fund Trust IV - Inspire Corporate Bond ETF (ARCA:IBD) institusjonell eierstruktur viser nåværende posisjoner i selskapet fordelt på institusjoner og fond, samt de siste endringene i posisjonsstørrelse. De største aksjonærene kan være individuelle investorer, verdipapirfond, hedgefond eller institusjoner. Schedule 13D indikerer at investoren eier (eller har eid) mer enn 5 % av selskapet og har til hensikt (eller hadde til hensikt) å aktivt forfølge en endring i forretningsstrategien. Schedule 13G indikerer en passiv investering på over 5 %.
The share price as of September 11, 2025 is 24,26 / share. Previously, on September 12, 2024, the share price was 24,17 / share. This represents an increase of 0,38% over that period.
Fondssentiment-score
Fondssentiment Score (også kjent som akkumulering av eierskap poengsum) viser hvilke aksjer som er mest kjøpt av fond. Den er resultatet av en sofistikert, kvantitativ flerfaktormodell som identifiserer selskaper med de høyeste nivåene av institusjonell akkumulering. Beregningsmodellen for poeng bruker en kombinasjon av den totale økningen i antall offentliggjorte eiere, endringer i porteføljeallokeringen til disse eierne og andre beregninger. Tallet går fra 0 til 100, der høyere tall indikerer en høyere grad av akkumulering i forhold til sammenlignbare selskaper, der 50 er gjennomsnittet.
Oppdateringsfrekvens: Daglig
Sjekk ut Ownership Explorer, som inneholder en liste over de høyest rangerte selskapene.
Institusjonell Put/Call-forhold
I tillegg til å rapportere standard aksje- og gjeldsemisjoner må institusjoner med mer enn 100 millioner kroner i forvaltningskapital også oppgi beholdningen av put- og callopsjoner. Siden put-opsjoner generelt indikerer et negativt sentiment, og call-opsjoner indikerer et positivt sentiment, kan vi få et inntrykk av det generelle institusjonelle sentimentet ved å plotte forholdet mellom put- og call-opsjoner. Diagrammet til høyre viser det historiske forholdet mellom put- og call-opsjoner for dette instrumentet.
Ved å bruke Put/Call-forholdet som en indikator på investorsentimentet kan man overvinne en av de viktigste svakhetene ved å bruke totalt institusjonelt eierskap, nemlig at en betydelig andel av forvaltningskapitalen investeres passivt for å følge indekser. Passivt forvaltede fond kjøper vanligvis ikke opsjoner, slik at indikatoren for put/call-forhold i større grad gjenspeiler stemningen i aktivt forvaltede fond.
13F- og NPORT-arkiveringer
Detaljer om 13F-arkiveringer er gratis. Detaljer om NP-arkiveringer krever et premium-medlemskap. Grønne rader indikerer nye posisjoner. Røde rader indikerer lukkede posisjoner. Klikk på lenke ikonet for å se hele transaksjonshistorikken.
Oppgrader
for å låse opp premiedata og eksportere til Excel. ![]() .
.
| Fildato | Kilde | Investor | Type | Gjennomsnittlig pris (estimert) |
Aksjer | Δ Aksjer (%) |
Rapportert verdi ($1000) | Verdi (%) | Portallokering (%) | |
|---|---|---|---|---|---|---|---|---|---|---|
| 2025-08-14 | 13F | Clarity Asset Management, Inc. | 117 | −54,12 | 3 | −66,67 | ||||
| 2025-08-06 | 13F | OneAscent Family Office, LLC | 31 805 | −9,84 | 1 | |||||
| 2025-04-29 | 13F | DT Investment Partners, LLC | 0 | −100,00 | 0 | |||||
| 2025-07-11 | 13F | Pioneer Wealth Management Group | 11 577 | 278 | ||||||
| 2025-08-14 | 13F | Royal Bank Of Canada | 8 182 | 13,17 | 196 | 13,95 | ||||
| 2025-07-18 | 13F | Vicus Capital | 78 007 | 4,05 | 1 873 | 5,17 | ||||
| 2025-07-24 | 13F | Ronald Blue Trust, Inc. | 15 940 | 0,00 | 383 | 1,06 | ||||
| 2025-07-31 | 13F | Turning Point Benefit Group, Inc. | 42 398 | 1 018 | ||||||
| 2025-08-13 | 13F | Jones Financial Companies Lllp | 134 | 3 | ||||||
| 2025-08-05 | 13F | Optivise Advisory Services LLC | 29 866 | −3,57 | 717 | −2,45 | ||||
| 2025-04-23 | 13F | AIFG Consultants Ltd. | 0 | −100,00 | 0 | |||||
| 2025-08-18 | 13F | Geneos Wealth Management Inc. | 518 | 12 | ||||||
| 2025-08-08 | 13F | Cetera Investment Advisers | 110 649 | −3,15 | 2 657 | −2,10 | ||||
| 2025-08-01 | 13F | Envestnet Asset Management Inc | 130 435 | −3,21 | 3 132 | −2,16 | ||||
| 2025-07-14 | 13F | AdvisorNet Financial, Inc | 37 | 1 | ||||||
| 2025-07-31 | 13F | Cambridge Investment Research Advisors, Inc. | 69 265 | −0,68 | 2 | 0,00 | ||||
| 2025-08-14 | 13F | Wells Fargo & Company/mn | 0 | −100,00 | 0 | |||||
| 2025-08-14 | 13F | Arete Wealth Advisors, LLC | 0 | −100,00 | 0 | |||||
| 2025-08-04 | 13F | Atria Investments Llc | 17 428 | −88,34 | 418 | −88,22 | ||||
| 2025-08-12 | 13F | Change Path, LLC | 619 922 | 0,60 | 14 884 | 1,71 | ||||
| 2025-07-18 | 13F | PFG Investments, LLC | 9 169 | −10,96 | 220 | −9,84 | ||||
| 2025-07-10 | 13F | Focus Financial Network, Inc. | 11 976 | 6,78 | 289 | 7,87 | ||||
| 2025-07-22 | 13F | Simplicity Wealth,LLC | 46 348 | 82,17 | 1 113 | 84,11 | ||||
| 2025-07-30 | 13F | Strategic Blueprint, LLC | 0 | −100,00 | 0 | |||||
| 2025-07-09 | 13F | HFG Wealth Management, LLC | 65 847 | 7,23 | 1 564 | 8,62 | ||||
| 2025-08-12 | 13F | LPL Financial LLC | 346 177 | 12,29 | 8 312 | 13,52 | ||||
| 2025-05-02 | 13F | Transcendent Capital Group LLC | 0 | −100,00 | 0 | |||||
| 2025-05-15 | 13F | Betterment LLC | 0 | −100,00 | 0 | |||||
| 2025-07-29 | 13F | Values First Advisors, Inc. | 215 | −16,34 | 5 | −16,67 | ||||
| 2025-08-07 | 13F | Allworth Financial LP | 97 088 | 86,12 | 2 331 | 88,59 | ||||
| 2025-08-06 | 13F | OneAscent Wealth Management LLC | 316 159 | −1,07 | 8 | 0,00 | ||||
| 2025-08-13 | 13F | StoneX Group Inc. | 0 | −100,00 | 0 | −100,00 | ||||
| 2025-08-13 | 13F | BCJ Capital Management, LLC | 12 420 | 6,01 | 298 | 7,19 | ||||
| 2025-08-11 | 13F | Nations Financial Group Inc, /ia/ /adv | 9 174 | 7,93 | 220 | 9,45 | ||||
| 2025-08-14 | 13F | UBS Group AG | 141 | 3 | ||||||
| 2025-08-06 | 13F | Commonwealth Equity Services, Llc | 17 290 | −61,27 | 0 | −100,00 | ||||
| 2025-07-10 | 13F | Trust Point Inc. | 42 538 | −0,26 | 1 021 | 0,89 | ||||
| 2025-08-06 | 13F | Christian Investment Advisors, Inc. | 582 857 | −33,55 | 13 994 | −33,00 | ||||
| 2025-08-13 | 13F | Summit Wealth Group Llc / Co | 27 540 | 664 | ||||||
| 2025-08-08 | 13F | Gts Securities Llc | 24 715 | 4,16 | 593 | 5,33 | ||||
| 2025-08-12 | 13F | OneAscent Investment Solutions LLC | 139 357 | −3,03 | 3 | 0,00 | ||||
| 2025-07-24 | 13F/A | McElhenny Sheffield Capital Management, LLC | 10 755 | −49,54 | 258 | −49,01 | ||||
| 2025-08-12 | 13F | Allen Capital Group, LLC | 25 111 | 17,15 | 603 | 18,27 | ||||
| 2025-07-24 | 13F | Cyndeo Wealth Partners, LLC | 12 128 | 1,00 | 291 | 2,11 | ||||
| 2025-08-13 | 13F | EverSource Wealth Advisors, LLC | 14 366 | −20,19 | 345 | −19,44 | ||||
| 2025-07-30 | 13F | D.a. Davidson & Co. | 0 | −100,00 | 0 | |||||
| 2025-08-14 | 13F | Citadel Advisors Llc | 53 298 | 5,95 | 1 280 | 7,12 | ||||
| 2025-08-13 | 13F | Continuum Advisory, LLC | 0 | −100,00 | 0 | |||||
| 2025-08-14 | 13F | Harvest Investment Services, LLC | 11 272 | −66,65 | 271 | −66,33 | ||||
| 2025-08-14 | 13F | Raymond James Financial Inc | 89 858 | −2,84 | 2 157 | −1,78 | ||||
| 2025-07-25 | 13F | Astoria Portfolio Advisors LLC. | 0 | −100,00 | 0 | |||||
| 2025-08-11 | 13F | Principal Securities, Inc. | 2 990 | 173,06 | 72 | 184,00 | ||||
| 2025-07-25 | 13F | Hobbs Group Advisors, LLC | 14 817 | 0,85 | 356 | 2,01 | ||||
| 2025-08-14 | 13F | Schwallier Wealth Management LLC | 16 014 | −2,83 | 384 | −1,79 | ||||
| 2025-08-11 | 13F | PAX Financial Group, LLC | 367 148 | −12,44 | 8 815 | −11,49 | ||||
| 2025-08-08 | 13F | Larson Financial Group LLC | 1 000 | 0,00 | 24 | 4,35 | ||||
| 2025-08-14 | 13F | Smartleaf Asset Management LLC | 373 | 0,00 | 9 | 0,00 | ||||
| 2025-08-11 | 13F | United Capital Financial Advisers, Llc | 121 541 | 58,29 | 2 918 | 60,07 | ||||
| 2025-08-14 | 13F | Jane Street Group, Llc | 79 116 | 1 900 | ||||||
| 2025-08-14 | 13F | Horizon Investments, LLC | 58 | 0,00 | 1 | 0,00 | ||||
| 2025-07-28 | 13F | Harbour Investments, Inc. | 4 725 | 0,47 | 113 | 1,80 | ||||
| 2025-08-12 | 13F | SRS Capital Advisors, Inc. | 732 | 0,00 | 18 | 0,00 | ||||
| 2025-09-02 | 13F | Pvg Asset Management Corp | 8 951 | 3,95 | 215 | 4,90 | ||||
| 2025-08-12 | 13F | OneAscent Financial Services LLC | 305 387 | −30,90 | 7 | −30,00 | ||||
| 2025-08-14 | 13F | Goldman Sachs Group Inc | 12 544 | 301 | ||||||
| 2025-07-21 | 13F | Ameritas Advisory Services, LLC | 682 | 16 | ||||||
| 2025-08-13 | 13F | Transce3nd, LLC | 14 | 0,00 | 0 | |||||
| 2025-08-14 | 13F | Old Mission Capital Llc | 0 | −100,00 | 0 | |||||
| 2025-07-17 | 13F | LifeGuide Financial Advisors, LLC | 22 533 | 1,25 | 541 | 2,46 | ||||
| 2025-08-12 | 13F | Proequities, Inc. | 0 | 0 | ||||||
| 2025-08-14 | 13F | Mml Investors Services, Llc | 14 202 | 21,75 | 0 | |||||
| 2025-07-22 | 13F | Belpointe Asset Management LLC | 0 | −100,00 | 0 | |||||
| 2025-08-11 | 13F | Mosaic Family Wealth Partners, Llc | 0 | −100,00 | 0 | |||||
| 2025-08-15 | 13F | Morgan Stanley | 32 | 60,00 | 1 | |||||
| 2025-08-14 | 13F | Benjamin Edwards Inc | 15 860 | 8,60 | 381 | 9,83 | ||||
| 2025-08-15 | 13F | Kestra Advisory Services, LLC | 24 368 | −23,67 | 585 | −22,82 | ||||
| 2025-07-25 | 13F | Atria Wealth Solutions, Inc. | 12 544 | −17,52 | 302 | −16,62 | ||||
| 2025-08-15 | 13F | Keel Point, LLC | 22 814 | 0,00 | 548 | 1,11 | ||||
| 2025-09-04 | 13F/A | Advisor Group Holdings, Inc. | 97 583 | 8,94 | 2 343 | 10,16 | ||||
| 2025-08-04 | 13F | Creative Financial Designs Inc /adv | 899 262 | 33,57 | 21 591 | 35,03 | ||||
| 2025-08-12 | 13F | Ameritas Investment Partners, Inc. | 1 466 | 0,96 | 35 | 2,94 | ||||
| 2025-08-14 | 13F | Glen Eagle Advisors, LLC | 0 | −100,00 | 0 | |||||
| 2025-07-24 | 13F | CWM Advisors, LLC | 598 053 | 2,28 | 14 359 | 3,40 | ||||
| 2025-08-14 | 13F | Stifel Financial Corp | 8 803 | −10,01 | 211 | −9,05 | ||||
| 2025-07-30 | 13F | Legacy Wealth Asset Management, LLC | 147 185 | 3,13 | 3 534 | 4,25 | ||||
| 2025-08-11 | 13F | Inspire Advisors, LLC | 2 938 025 | −0,32 | 70 542 | 0,77 | ||||
| 2025-07-15 | 13F | LVZ Advisors, Inc. | 179 970 | −3,97 | 4 321 | −2,90 | ||||
| 2025-07-08 | 13F | Range Financial Group LLC | 124 936 | 17,02 | 3 000 | 18,30 | ||||
| 2025-08-13 | 13F | Bare Financial Services, Inc | 637 196 | 3,90 | 15 299 | 5,04 | ||||
| 2025-04-15 | 13F | Noble Wealth Management PBC | 0 | −100,00 | 0 | −100,00 | ||||
| 2025-07-23 | 13F | Valmark Advisers, Inc. | 133 169 | −9,24 | 3 197 | −8,24 | ||||
| 2025-08-12 | 13F | MAI Capital Management | 1 638 | 0,00 | 39 | 2,63 | ||||
| 2025-07-03 | 13F | TrueWealth Advisors, LLC | 81 784 | 2,15 | 1 964 | 3,26 | ||||
| 2025-08-04 | 13F | AlphaStar Capital Management, LLC | 52 093 | −4,73 | 1 251 | −3,70 | ||||
| 2025-08-15 | 13F | First Heartland Consultants, Inc. | 25 717 | 43,84 | 617 | 45,52 | ||||
| 2025-05-12 | 13F | Fmr Llc | 0 | −100,00 | 0 | |||||
| 2025-07-23 | 13F | RMG Wealth Management LLC | 15 533 | 372 | ||||||
| 2025-08-04 | 13F | Creekmur Asset Management LLC | 5 651 | 53,43 | 136 | 55,17 | ||||
| 2025-08-12 | 13F | Financial Advocates Investment Management | 22 814 | 24,77 | 548 | 26,04 | ||||
| 2025-07-22 | 13F | Merit Financial Group, LLC | 16 648 | 0,82 | 400 | 1,79 | ||||
| 2025-08-14 | 13F | Ambassador Advisors, LLC | 1 463 000 | 2,36 | 35 127 | 3,48 | ||||
| 2025-08-12 | 13F | Bedel Financial Consulting, Inc. | 8 720 | 209 | ||||||
| 2025-08-14 | 13F | LaSalle St. Investment Advisors, LLC | 28 126 | −2,79 | 1 | |||||
| 2025-07-17 | 13F | E Six Thirteen, Llc | 34 789 | −6,22 | 835 | −5,22 | ||||
| 2025-08-08 | 13F | Avantax Advisory Services, Inc. | 28 693 | −0,60 | 689 | 0,44 | ||||
| 2025-08-01 | 13F | Advisory Alpha, LLC | 17 306 | 1,81 | 416 | 2,98 | ||||
| 2025-07-11 | 13F | SILVER OAK SECURITIES, Inc | 58 118 | −4,65 | 1 395 | −3,39 | ||||
| 2025-07-24 | 13F | IFP Advisors, Inc | 58 790 | 29 003,96 | 1 412 | 35 175,00 | ||||
| 2025-07-25 | 13F | Cwm, Llc | 13 232 | 0,00 | 0 |