Grunnleggende statistikk
| Institusjonelle eiere | 105 total, 105 long only, 0 short only, 0 long/short - change of −0,94% MRQ |
| Gjennomsnittlig porteføljeallokering | 0.3578 % - change of −6,26% MRQ |
| Institusjonelle aksjer (Long) | 6 776 341 (ex 13D/G) - change of 0,36MM shares 5,64% MRQ |
| Institusjonell verdi (Long) | $ 401 551 USD ($1000) |
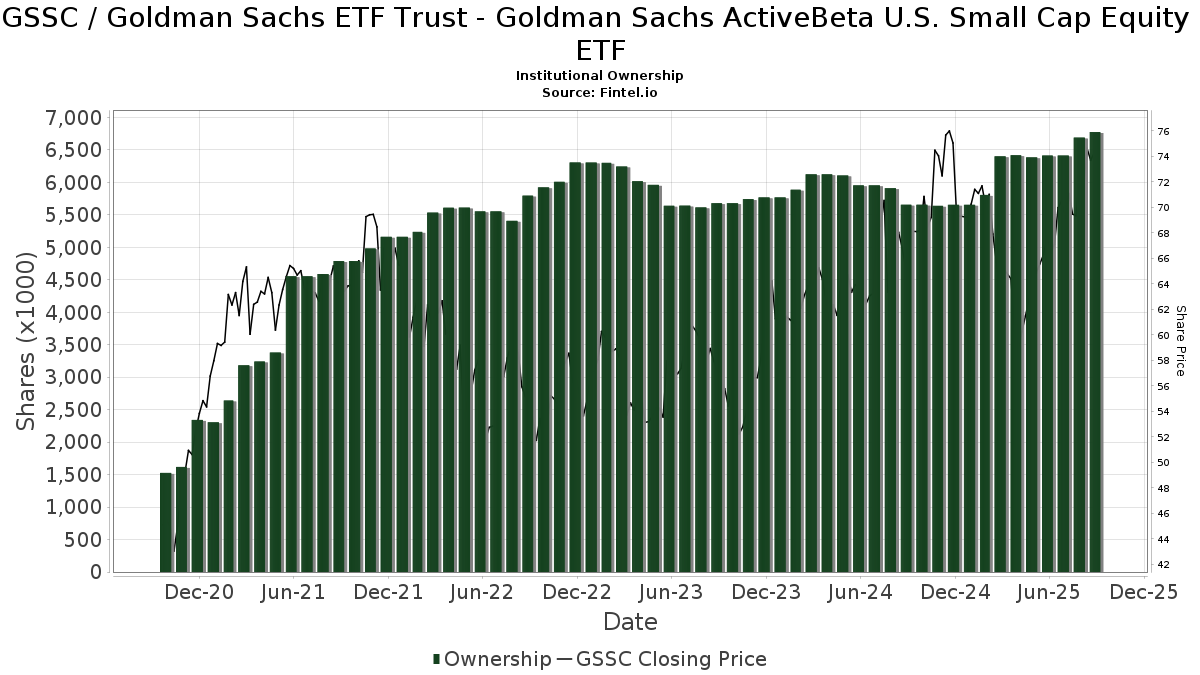
Institusjonelt eierskap og aksjonærer
Goldman Sachs ETF Trust - Goldman Sachs ActiveBeta U.S. Small Cap Equity ETF (US:GSSC) har 105 institusjonelle eiere og aksjonærer som har sendt inn 13D/G- eller 13F-skjemaer til Securities Exchange Commission (SEC). Disse institusjonene eier til sammen 6,776,341 aksjer. De største aksjonærene inkluderer Betterment LLC, LPL Financial LLC, First Foundation Advisors, American National Bank, Bank Of America Corp /de/, Richard P Slaughter Associates Inc, Envestnet Asset Management Inc, Raymond James Financial Inc, Morgan Stanley, and Brinker Capital Investments, LLC .
Goldman Sachs ETF Trust - Goldman Sachs ActiveBeta U.S. Small Cap Equity ETF (ARCA:GSSC) institusjonell eierstruktur viser nåværende posisjoner i selskapet fordelt på institusjoner og fond, samt de siste endringene i posisjonsstørrelse. De største aksjonærene kan være individuelle investorer, verdipapirfond, hedgefond eller institusjoner. Schedule 13D indikerer at investoren eier (eller har eid) mer enn 5 % av selskapet og har til hensikt (eller hadde til hensikt) å aktivt forfølge en endring i forretningsstrategien. Schedule 13G indikerer en passiv investering på over 5 %.
The share price as of September 9, 2025 is 74,34 / share. Previously, on September 10, 2024, the share price was 65,04 / share. This represents an increase of 14,31% over that period.
Fondssentiment-score
Fondssentiment Score (også kjent som akkumulering av eierskap poengsum) viser hvilke aksjer som er mest kjøpt av fond. Den er resultatet av en sofistikert, kvantitativ flerfaktormodell som identifiserer selskaper med de høyeste nivåene av institusjonell akkumulering. Beregningsmodellen for poeng bruker en kombinasjon av den totale økningen i antall offentliggjorte eiere, endringer i porteføljeallokeringen til disse eierne og andre beregninger. Tallet går fra 0 til 100, der høyere tall indikerer en høyere grad av akkumulering i forhold til sammenlignbare selskaper, der 50 er gjennomsnittet.
Oppdateringsfrekvens: Daglig
Sjekk ut Ownership Explorer, som inneholder en liste over de høyest rangerte selskapene.
Institusjonell Put/Call-forhold
I tillegg til å rapportere standard aksje- og gjeldsemisjoner må institusjoner med mer enn 100 millioner kroner i forvaltningskapital også oppgi beholdningen av put- og callopsjoner. Siden put-opsjoner generelt indikerer et negativt sentiment, og call-opsjoner indikerer et positivt sentiment, kan vi få et inntrykk av det generelle institusjonelle sentimentet ved å plotte forholdet mellom put- og call-opsjoner. Diagrammet til høyre viser det historiske forholdet mellom put- og call-opsjoner for dette instrumentet.
Ved å bruke Put/Call-forholdet som en indikator på investorsentimentet kan man overvinne en av de viktigste svakhetene ved å bruke totalt institusjonelt eierskap, nemlig at en betydelig andel av forvaltningskapitalen investeres passivt for å følge indekser. Passivt forvaltede fond kjøper vanligvis ikke opsjoner, slik at indikatoren for put/call-forhold i større grad gjenspeiler stemningen i aktivt forvaltede fond.
13F- og NPORT-arkiveringer
Detaljer om 13F-arkiveringer er gratis. Detaljer om NP-arkiveringer krever et premium-medlemskap. Grønne rader indikerer nye posisjoner. Røde rader indikerer lukkede posisjoner. Klikk på lenke ikonet for å se hele transaksjonshistorikken.
Oppgrader
for å låse opp premiedata og eksportere til Excel. ![]() .
.
| Fildato | Kilde | Investor | Type | Gjennomsnittlig pris (estimert) |
Aksjer | Δ Aksjer (%) |
Rapportert verdi ($1000) | Verdi (%) | Portallokering (%) | |
|---|---|---|---|---|---|---|---|---|---|---|
| 2025-08-11 | 13F | Blue Bell Private Wealth Management, Llc | 16 | 0,00 | 1 | 0,00 | ||||
| 2025-07-17 | 13F | HB Wealth Management, LLC | 21 190 | 0,00 | 1 454 | 8,11 | ||||
| 2025-08-13 | 13F | Lido Advisors, LLC | 7 752 | 0,00 | 532 | 8,15 | ||||
| 2025-08-13 | 13F | Maia Wealth LLC | 5 844 | −1,96 | 401 | 13,31 | ||||
| 2025-08-11 | 13F | Principal Securities, Inc. | 90 763 | 12,88 | 6 227 | 12,04 | ||||
| 2025-08-12 | 13F | Segall Bryant & Hamill, Llc | 0 | −100,00 | 0 | |||||
| 2025-07-10 | 13F | Sovran Advisors, LLC | 9 255 | −3,56 | 648 | 14,49 | ||||
| 2025-07-29 | 13F | Stephens Inc /ar/ | 28 190 | 0,00 | 1 934 | 8,17 | ||||
| 2025-08-13 | 13F | EverSource Wealth Advisors, LLC | 381 | 0,26 | 26 | 8,33 | ||||
| 2025-07-31 | 13F | Wealthfront Advisers Llc | 11 155 | −18,19 | 765 | −11,46 | ||||
| 2025-08-05 | 13F | Bank of New York Mellon Corp | 7 097 | 4,74 | 487 | 13,29 | ||||
| 2025-07-09 | 13F | Dynamic Advisor Solutions LLC | 39 166 | −21,64 | 2 687 | −15,24 | ||||
| 2025-08-07 | 13F | SFE Investment Counsel | 0 | −100,00 | 0 | |||||
| 2025-08-14 | 13F | First Foundation Advisors | 564 889 | −5,38 | 38 757 | 2,34 | ||||
| 2025-07-08 | 13F | Richard P Slaughter Associates Inc | 298 022 | −6,21 | 20 447 | 1,45 | ||||
| 2025-07-21 | 13F | Quent Capital, LLC | 0 | −100,00 | 0 | |||||
| 2025-07-15 | 13F | McCarthy & Cox | 144 227 | 3,63 | 9 895 | 12,10 | ||||
| 2025-07-17 | 13F | Fifth Third Securities, Inc. | 8 198 | −13,08 | 562 | −6,02 | ||||
| 2025-07-14 | 13F | Gries Financial Llc | 3 029 | 208 | ||||||
| 2025-05-15 | 13F | Stonehaven Wealth & Tax Solutions, Llc | 0 | −100,00 | 0 | |||||
| 2025-08-11 | 13F | TD Waterhouse Canada Inc. | 0 | −100,00 | 0 | |||||
| 2025-07-31 | 13F | CNB Bank | 170 | 0,00 | 12 | 10,00 | ||||
| 2025-08-14 | 13F | Glenview Trust Co | 11 630 | −0,03 | 798 | 8,14 | ||||
| 2025-08-11 | 13F | Citigroup Inc | 2 | 0 | ||||||
| 2025-08-14 | 13F | Bank Of America Corp /de/ | 316 676 | −2,39 | 21 727 | 5,59 | ||||
| 2025-07-28 | 13F | Mutual Advisors, LLC | 4 079 | −8,54 | 286 | 4,76 | ||||
| 2025-08-14 | 13F | Integrated Wealth Concepts LLC | 3 810 | 4,01 | 261 | 12,50 | ||||
| 2025-08-07 | 13F | Verus Capital Partners, Llc | 24 870 | 1 706 | ||||||
| 2025-08-14 | 13F | Susquehanna International Group, Llp | 0 | −100,00 | 0 | |||||
| 2025-07-11 | 13F/A | Umb Bank N A/mo | 116 | −54,86 | 8 | −56,25 | ||||
| 2025-07-24 | 13F | Louisbourg Investments Inc. | 30 | 0,00 | 2 | 100,00 | ||||
| 2025-07-25 | 13F | Envestnet Portfolio Solutions, Inc. | 39 010 | −0,49 | 2 676 | 7,64 | ||||
| 2025-08-06 | 13F | AE Wealth Management LLC | 43 | 59,26 | 3 | 100,00 | ||||
| 2025-08-11 | 13F | Paul R. Ried Financial Group, LLC | 164 732 | −18,41 | 11 302 | −11,75 | ||||
| 2025-08-15 | 13F | Morgan Stanley | 178 181 | 11,99 | 12 225 | 21,14 | ||||
| 2025-08-07 | 13F | Vise Technologies, Inc. | 0 | −100,00 | 0 | |||||
| 2025-07-31 | 13F | Hixon Zuercher, LLC | 38 609 | −17,74 | 2 649 | −11,05 | ||||
| 2025-07-21 | 13F | Ameritas Advisory Services, LLC | 649 | 45 | ||||||
| 2025-04-30 | 13F | Axxcess Wealth Management, Llc | 0 | −100,00 | 0 | |||||
| 2025-08-14 | 13F | LifePlan Investment Advisors, Inc. | 6 380 | 39,82 | 438 | 51,21 | ||||
| 2025-05-16 | 13F | Coppell Advisory Solutions LLC | 0 | −100,00 | 0 | |||||
| 2025-08-14 | 13F | Comerica Bank | 194 | 0,00 | 13 | 8,33 | ||||
| 2025-08-04 | 13F | Linscomb & Williams, Inc. | 48 556 | 5,49 | 3 331 | 14,11 | ||||
| 2025-08-14 | 13F | Fmr Llc | 917 | −34,17 | 63 | −29,55 | ||||
| 2025-08-04 | 13F | Kovack Advisors, Inc. | 3 000 | 206 | ||||||
| 2025-07-23 | 13F | Heck Capital Advisors, LLC | 168 642 | 0,05 | 11 571 | 8,22 | ||||
| 2025-08-01 | 13F | Strategic Financial Services, Inc, | 105 706 | 79,39 | 7 252 | 94,06 | ||||
| 2025-08-12 | 13F | Jpmorgan Chase & Co | 161 | 0,00 | 11 | 10,00 | ||||
| 2025-08-07 | 13F | CENTRAL TRUST Co | 25 636 | −16,36 | 1 759 | −9,57 | ||||
| 2025-07-29 | NP | EBI - Longview Advantage ETF | 0 | −100,00 | 0 | −100,00 | ||||
| 2025-08-14 | 13F | Betterment LLC | 762 667 | 27,97 | 52 | 40,54 | ||||
| 2025-07-22 | 13F | Miracle Mile Advisors, LLC | 6 484 | −42,69 | 445 | −38,08 | ||||
| 2025-08-14 | 13F | Raymond James Financial Inc | 231 414 | 12,02 | 15 877 | 21,17 | ||||
| 2025-09-04 | 13F/A | Advisor Group Holdings, Inc. | 50 258 | 280,14 | 3 448 | 311,46 | ||||
| 2025-05-06 | 13F | Venturi Wealth Management, LLC | 0 | −100,00 | 0 | |||||
| 2025-08-14 | 13F | Two Sigma Investments, Lp | 0 | −100,00 | 0 | |||||
| 2025-04-22 | 13F | Private Wealth Partners, LLC | 0 | −100,00 | 0 | |||||
| 2025-08-27 | 13F/A | Brinker Capital Investments, LLC | 177 845 | 0,18 | 12 202 | 8,36 | ||||
| 2025-05-15 | 13F | Citadel Advisors Llc | 0 | −100,00 | 0 | |||||
| 2025-08-11 | 13F | Private Advisor Group, LLC | 21 427 | −9,80 | 1 470 | −2,39 | ||||
| 2025-08-12 | 13F | Proequities, Inc. | 0 | 0 | ||||||
| 2025-08-12 | 13F | O'shaughnessy Asset Management, Llc | 94 | 46,88 | 6 | 50,00 | ||||
| 2025-07-28 | 13F | Morris Financial Concepts, Inc. | 3 545 | −23,98 | 243 | −17,63 | ||||
| 2025-07-21 | 13F | Financial Architects, LLC | 170 750 | −2,23 | 11 715 | 5,75 | ||||
| 2025-07-21 | 13F | Monticello Wealth Management, Llc | 143 342 | −2,12 | 9 835 | 5,87 | ||||
| 2025-08-11 | 13F | Aptus Capital Advisors, LLC | 992 | 0,00 | 68 | 9,68 | ||||
| 2025-07-28 | 13F | Harbour Investments, Inc. | 665 | −11,33 | 46 | −4,26 | ||||
| 2025-08-11 | 13F | HHM Wealth Advisors, LLC | 196 | −40,24 | 13 | −35,00 | ||||
| 2025-05-15 | 13F/A | Orion Portfolio Solutions, LLC | 177 532 | 1,74 | 11 261 | −6,65 | ||||
| 2025-08-12 | 13F | Steward Partners Investment Advisory, Llc | 408 | 0,00 | 28 | 8,00 | ||||
| 2025-07-24 | 13F | Blair William & Co/il | 218 | 0,00 | 15 | 7,69 | ||||
| 2025-07-24 | 13F | IFP Advisors, Inc | 173 626 | 4,10 | 11 913 | 12,60 | ||||
| 2025-05-01 | 13F | Freedom Day Solutions, LLC | 0 | −100,00 | 0 | −100,00 | ||||
| 2025-07-11 | 13F | Spence Asset Management | 38 107 | 4,20 | 3 | 0,00 | ||||
| 2025-08-14 | 13F | GWM Advisors LLC | 6 937 | 8,83 | 476 | 17,57 | ||||
| 2025-07-10 | 13F | Community Trust & Investment Co | 3 866 | 0,00 | 265 | 8,16 | ||||
| 2025-08-15 | 13F | CI Private Wealth, LLC | 10 947 | −19,08 | 751 | −12,47 | ||||
| 2025-07-24 | 13F | Us Bancorp \de\ | 33 | 0,00 | 2 | 0,00 | ||||
| 2025-08-04 | 13F | Great Lakes Retirement, Inc. | 109 821 | −39,21 | 7 535 | −34,25 | ||||
| 2025-07-22 | 13F/A | Duncan Williams Asset Management, LLC | 134 394 | 420,79 | 9 221 | 463,57 | ||||
| 2025-08-21 | 13F | Aveo Capital Partners, LLC | 0 | −100,00 | 0 | |||||
| 2025-07-25 | 13F | Cwm, Llc | 50 | 0 | ||||||
| 2025-08-12 | 13F | MAI Capital Management | 1 813 | 0,00 | 124 | 8,77 | ||||
| 2025-07-30 | 13F | Syntegra Private Wealth Group, LLC | 17 104 | 1 174 | ||||||
| 2025-07-14 | 13F | U.S. Capital Wealth Advisors, LLC | 3 240 | 0,00 | 222 | 8,29 | ||||
| 2025-07-10 | 13F | Wealth Enhancement Advisory Services, Llc | 30 842 | −35,63 | 2 179 | −28,33 | ||||
| 2025-04-21 | 13F | Nelson, Van Denburg & Campbell Wealth Management Group, LLC | 0 | −100,00 | 0 | |||||
| 2025-08-14 | 13F | Wells Fargo & Company/mn | 391 | 551,67 | 27 | 766,67 | ||||
| 2025-08-04 | 13F | Creative Financial Designs Inc /adv | 8 | 1 | ||||||
| 2025-08-12 | 13F | Gladstone Institutional Advisory LLC | 15 486 | 6,67 | 1 062 | 15,43 | ||||
| 2025-08-13 | 13F | Northwestern Mutual Wealth Management Co | 42 | 0,00 | 3 | 0,00 | ||||
| 2025-08-06 | 13F | Commonwealth Equity Services, Llc | 107 352 | 4,42 | 7 | 16,67 | ||||
| 2025-08-05 | 13F | Bank Of Montreal /can/ | 50 | 0,00 | 3 | 0,00 | ||||
| 2025-08-14 | 13F | CoreCap Advisors, LLC | 38 121 | 1,74 | 2 616 | 10,06 | ||||
| 2025-07-23 | 13F | Sax Wealth Advisors, Llc | 3 590 | 246 | ||||||
| 2025-08-15 | 13F | Equitable Holdings, Inc. | 0 | −100,00 | 0 | |||||
| 2025-05-14 | 13F | Ameriprise Financial Inc | 0 | −100,00 | 0 | −100,00 | ||||
| 2025-08-12 | 13F | Coldstream Capital Management Inc | 0 | −100,00 | 0 | |||||
| 2025-08-12 | 13F | Global Retirement Partners, LLC | 2 785 | −73,61 | 191 | −73,80 | ||||
| 2025-08-06 | 13F | Ethos Financial Group, LLC | 3 047 | 209 | ||||||
| 2025-08-08 | 13F | Cetera Investment Advisers | 121 886 | 3,78 | 8 363 | 12,26 | ||||
| 2025-05-07 | 13F | WMS Partners, LLC | 0 | −100,00 | 0 | |||||
| 2025-08-01 | 13F | Envestnet Asset Management Inc | 290 428 | 8,10 | 19 926 | 16,93 | ||||
| 2025-08-12 | 13F | LPL Financial LLC | 647 204 | 5,03 | 44 405 | 13,60 | ||||
| 2025-08-14 | 13F | Goldman Sachs Group Inc | 12 406 | −0,59 | 851 | 7,59 | ||||
| 2025-07-08 | 13F | Apella Capital, LLC | 3 549 | 0,14 | 247 | 15,49 | ||||
| 2025-07-16 | 13F | American National Bank | 460 771 | −8,21 | 31 613 | −0,71 | ||||
| 2025-08-12 | 13F | SRS Capital Advisors, Inc. | 0 | −100,00 | 0 | |||||
| 2025-08-14 | 13F | Royal Bank Of Canada | 90 047 | 5,66 | 6 178 | 14,30 | ||||
| 2025-08-14 | 13F | UBS Group AG | 133 | −96,44 | 9 | −96,20 | ||||
| 2025-07-24 | 13F | Edge Financial Advisors LLC | 3 653 | −25,14 | 253 | −18,45 | ||||
| 2025-08-18 | 13F | Hollencrest Capital Management | 29 | 2 | ||||||
| 2025-08-07 | 13F | Allworth Financial LP | 303 | 0,00 | 21 | 11,11 | ||||
| 2025-08-14 | 13F | Smartleaf Asset Management LLC | 0 | −100,00 | 0 | |||||
| 2025-07-29 | 13F | Private Trust Co Na | 599 | 49,75 | 41 | 64,00 | ||||
| 2025-08-13 | 13F | Russell Investments Group, Ltd. | 49 | −78,22 | 3 | −78,57 | ||||
| 2025-07-17 | 13F | Wagner Wealth Management, Llc | 2 | 0,00 | 0 | |||||
| 2025-08-12 | 13F | Ameritas Investment Partners, Inc. | 36 | 2 | ||||||
| 2025-08-08 | 13F | Crossmark Global Holdings, Inc. | 29 945 | 2,67 | 2 051 | 10,99 | ||||
| 2025-08-18 | 13F | Tyler-Stone Wealth Management | 3 600 | −23,40 | 247 | −17,45 | ||||
| 2025-07-25 | 13F | PrairieView Partners, LLC | 11 | 0,00 | 0 | |||||
| 2025-08-12 | 13F | Inscription Capital, LLC | 0 | −100,00 | 0 | |||||
| 2025-07-30 | 13F | Gables Capital Management Inc. | 6 | 0,00 | 0 | |||||
| 2025-07-09 | 13F | High Probability Advisors, LLC | 148 937 | 14,48 | 10 219 | 23,82 | ||||
| 2025-05-12 | 13F | Independent Advisor Alliance | 0 | −100,00 | 0 | |||||
| 2025-07-29 | 13F | Aire Advisors, Llc | 5 000 | 0,00 | 343 | 8,20 | ||||
| 2025-08-12 | 13F | Change Path, LLC | 12 955 | −12,23 | 889 | −5,13 | ||||
| 2025-05-07 | 13F | David R. Rahn & Associates Inc. | 0 | −100,00 | 0 | |||||
| 2025-07-08 | 13F | Nbc Securities, Inc. | 3 493 | 0,00 | 0 | |||||
| 2025-08-11 | 13F | Bell Investment Advisors, Inc | 96 836 | 11,12 | 6 644 | 20,19 | ||||
| 2025-08-14 | 13F | Keebeck Wealth Management, LLC | 9 698 | 665 | ||||||
| 2025-07-25 | 13F | Atria Wealth Solutions, Inc. | 4 303 | −55,39 | 295 | −51,72 |