Grunnleggende statistikk
| Institusjonelle eiere | 263 total, 260 long only, 0 short only, 3 long/short - change of −2,59% MRQ |
| Gjennomsnittlig porteføljeallokering | 0.1117 % - change of 14,90% MRQ |
| Institusjonelle aksjer (Long) | 72 977 774 (ex 13D/G) - change of −3,50MM shares −4,57% MRQ |
| Institusjonell verdi (Long) | $ 1 511 968 USD ($1000) |
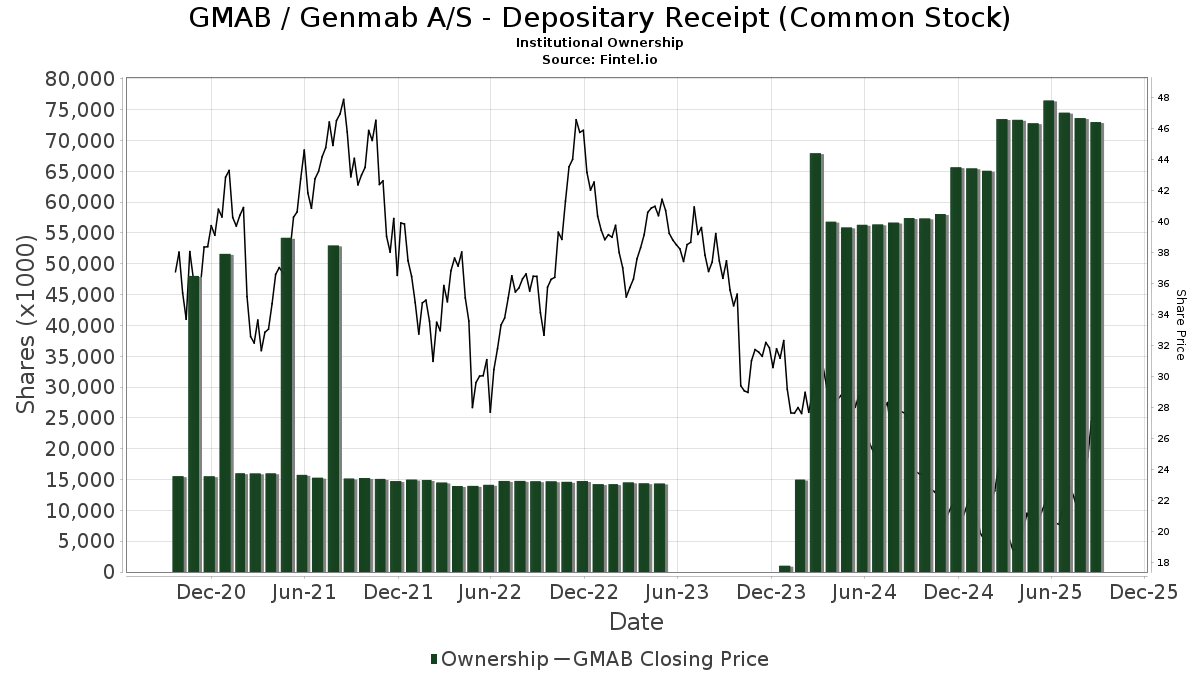
Institusjonelt eierskap og aksjonærer
Genmab A/S - Depositary Receipt (Common Stock) (US:GMAB) har 263 institusjonelle eiere og aksjonærer som har sendt inn 13D/G- eller 13F-skjemaer til Securities Exchange Commission (SEC). Disse institusjonene eier til sammen 72,977,774 aksjer. De største aksjonærene inkluderer Alliancebernstein L.p., Orbis Allan Gray Ltd, APGAX - AB LARGE CAP GROWTH FUND INC Class A, Citadel Advisors Llc, Arrowstreet Capital, Limited Partnership, BlackRock, Inc., Harding Loevner Lp, Renaissance Technologies Llc, Morgan Stanley, and IBB - iShares Nasdaq Biotechnology ETF .
Genmab A/S - Depositary Receipt (Common Stock) (NasdaqGS:GMAB) institusjonell eierstruktur viser nåværende posisjoner i selskapet fordelt på institusjoner og fond, samt de siste endringene i posisjonsstørrelse. De største aksjonærene kan være individuelle investorer, verdipapirfond, hedgefond eller institusjoner. Schedule 13D indikerer at investoren eier (eller har eid) mer enn 5 % av selskapet og har til hensikt (eller hadde til hensikt) å aktivt forfølge en endring i forretningsstrategien. Schedule 13G indikerer en passiv investering på over 5 %.
The share price as of September 11, 2025 is 28,61 / share. Previously, on September 12, 2024, the share price was 26,49 / share. This represents an increase of 8,00% over that period.
Fondssentiment-score
Fondssentiment Score (også kjent som akkumulering av eierskap poengsum) viser hvilke aksjer som er mest kjøpt av fond. Den er resultatet av en sofistikert, kvantitativ flerfaktormodell som identifiserer selskaper med de høyeste nivåene av institusjonell akkumulering. Beregningsmodellen for poeng bruker en kombinasjon av den totale økningen i antall offentliggjorte eiere, endringer i porteføljeallokeringen til disse eierne og andre beregninger. Tallet går fra 0 til 100, der høyere tall indikerer en høyere grad av akkumulering i forhold til sammenlignbare selskaper, der 50 er gjennomsnittet.
Oppdateringsfrekvens: Daglig
Sjekk ut Ownership Explorer, som inneholder en liste over de høyest rangerte selskapene.
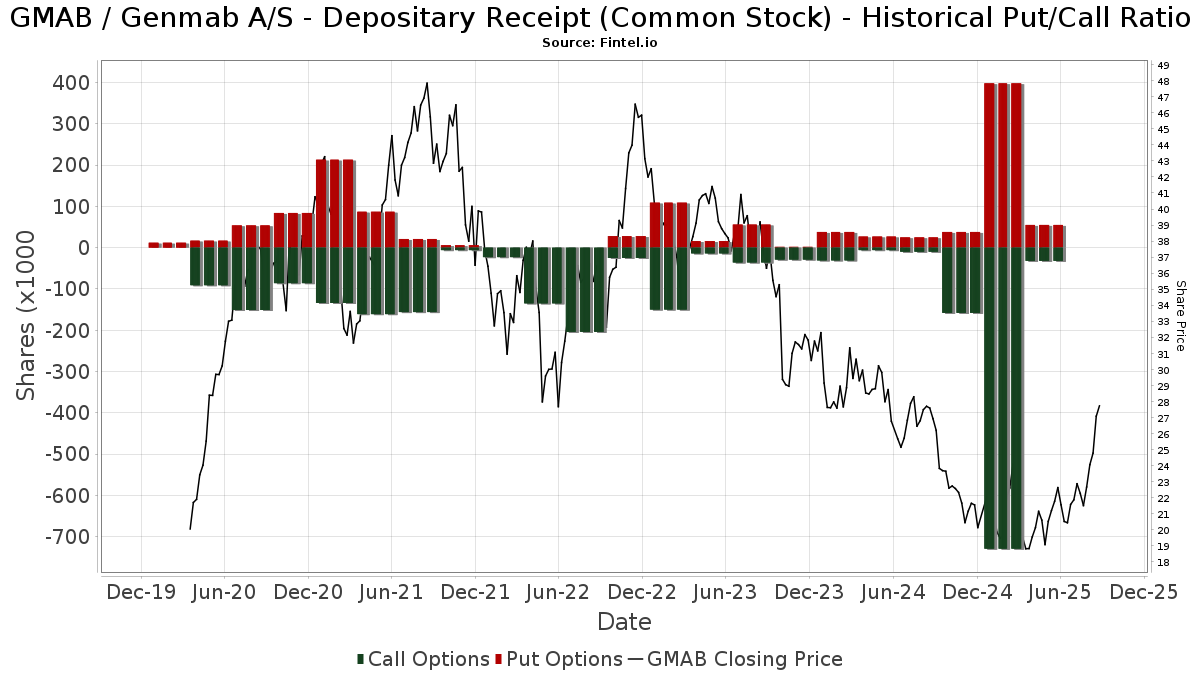
Institusjonell Put/Call-forhold
I tillegg til å rapportere standard aksje- og gjeldsemisjoner må institusjoner med mer enn 100 millioner kroner i forvaltningskapital også oppgi beholdningen av put- og callopsjoner. Siden put-opsjoner generelt indikerer et negativt sentiment, og call-opsjoner indikerer et positivt sentiment, kan vi få et inntrykk av det generelle institusjonelle sentimentet ved å plotte forholdet mellom put- og call-opsjoner. Diagrammet til høyre viser det historiske forholdet mellom put- og call-opsjoner for dette instrumentet.
Ved å bruke Put/Call-forholdet som en indikator på investorsentimentet kan man overvinne en av de viktigste svakhetene ved å bruke totalt institusjonelt eierskap, nemlig at en betydelig andel av forvaltningskapitalen investeres passivt for å følge indekser. Passivt forvaltede fond kjøper vanligvis ikke opsjoner, slik at indikatoren for put/call-forhold i større grad gjenspeiler stemningen i aktivt forvaltede fond.
13F- og NPORT-arkiveringer
Detaljer om 13F-arkiveringer er gratis. Detaljer om NP-arkiveringer krever et premium-medlemskap. Grønne rader indikerer nye posisjoner. Røde rader indikerer lukkede posisjoner. Klikk på lenke ikonet for å se hele transaksjonshistorikken.
Oppgrader
for å låse opp premiedata og eksportere til Excel. ![]() .
.
| Fildato | Kilde | Investor | Type | Gjennomsnittlig pris (estimert) |
Aksjer | Δ Aksjer (%) |
Rapportert verdi ($1000) | Verdi (%) | Portallokering (%) | |
|---|---|---|---|---|---|---|---|---|---|---|
| 2025-08-06 | 13F | Golden State Wealth Management, LLC | 0 | −100,00 | 0 | |||||
| 2025-08-12 | 13F | XTX Topco Ltd | 0 | −100,00 | 0 | |||||
| 2025-08-13 | 13F | Quadrant Capital Group Llc | 27 518 | −7,54 | 569 | −2,41 | ||||
| 2025-08-14 | 13F/A | Rockefeller Capital Management L.P. | 12 931 | 267 | ||||||
| 2025-08-08 | 13F | Grandfield & Dodd, Llc | 38 503 | −3,48 | 795 | 1,79 | ||||
| 2025-08-13 | 13F | First Trust Advisors Lp | 1 770 310 | 3,54 | 36 575 | 9,25 | ||||
| 2025-08-08 | 13F | Atlantic Trust, LLC | 199 | 4 | ||||||
| 2025-07-25 | 13F | JustInvest LLC | 52 684 | 24,67 | 1 088 | 31,56 | ||||
| 2025-08-14 | 13F | Group One Trading, L.p. | 8 | 0 | ||||||
| 2025-08-26 | NP | AZBAX - AllianzGI Small-Cap Fund Class A | 27 495 | 568 | ||||||
| 2025-08-05 | 13F | NewSquare Capital LLC | 299 | 1 200,00 | 6 | |||||
| 2025-08-14 | 13F | Harding Loevner Lp | 2 923 439 | 1,48 | 60 419 | 7,06 | ||||
| 2025-08-12 | 13F | Atlas Capital Advisors Llc | 189 | 0,00 | 4 | 0,00 | ||||
| 2025-08-04 | 13F | Assetmark, Inc | 216 | −0,92 | 4 | 0,00 | ||||
| 2025-08-06 | NP | LINCOLN VARIABLE INSURANCE PRODUCTS TRUST - LVIP T. Rowe Price Growth Stock Fund Standard Class | 205 222 | −3,10 | 4 240 | 2,24 | ||||
| 2025-06-18 | NP | REAYX - Equity Income Fund Class Y | 17 667 | 8,10 | 374 | 16,20 | ||||
| 2025-08-13 | 13F | Russell Investments Group, Ltd. | 934 067 | −13,52 | 19 298 | −8,75 | ||||
| 2025-08-14 | 13F | Mml Investors Services, Llc | 38 576 | −17,44 | 1 | |||||
| 2025-08-12 | 13F | Clear Street Markets Llc | 152 832 | 3 158 | ||||||
| 2025-08-08 | 13F | Creative Planning | 65 132 | 11,79 | 1 346 | 17,98 | ||||
| 2025-07-30 | 13F | Cullen/frost Bankers, Inc. | 75 | −87,24 | 2 | −90,91 | ||||
| 2025-08-14 | 13F | Point72 Asia (Singapore) Pte. Ltd. | 258 | −23,21 | 5 | −16,67 | ||||
| 2025-07-08 | 13F | Parallel Advisors, LLC | 3 720 | 377,54 | 77 | 406,67 | ||||
| 2025-08-13 | 13F | Cresset Asset Management, LLC | 0 | −100,00 | 0 | |||||
| 2025-08-14 | 13F | Ameriprise Financial Inc | 56 714 | 1 172 | ||||||
| 2025-08-07 | 13F | Addison Advisors LLC | 300 | −21,88 | 6 | −14,29 | ||||
| 2025-08-04 | 13F | Keybank National Association/oh | 28 864 | 1,03 | 596 | 6,62 | ||||
| 2025-08-14 | 13F | Jane Street Group, Llc | 360 489 | 155,97 | 7 448 | 170,11 | ||||
| 2025-08-13 | 13F | Tema Etfs Llc | 130 217 | 26,73 | 2 690 | 33,76 | ||||
| 2025-08-14 | 13F | Jane Street Group, Llc | Put | 11 300 | −74,83 | 233 | −73,49 | |||
| 2025-08-15 | 13F | CI Private Wealth, LLC | 0 | −100,00 | 0 | |||||
| 2025-08-08 | 13F | Geode Capital Management, Llc | 27 127 | 0,41 | 560 | 6,06 | ||||
| 2025-05-05 | 13F | Creekmur Asset Management LLC | 0 | −100,00 | 0 | |||||
| 2025-08-14 | 13F | Wells Fargo & Company/mn | 9 765 | 3,05 | 202 | 8,65 | ||||
| 2025-08-14 | 13F | Daiwa Securities Group Inc. | 159 | 0,00 | 0 | |||||
| 2025-08-14 | 13F | Engineers Gate Manager LP | 78 151 | −12,55 | 1 615 | −7,72 | ||||
| 2025-08-14 | 13F | Macquarie Group Ltd | 0 | −100,00 | 0 | −100,00 | ||||
| 2025-06-18 | NP | RETSX - Tax-Managed U.S. Large Cap Fund Class S | 508 504 | 10 755 | ||||||
| 2025-07-14 | 13F | UMA Financial Services, Inc. | 95 | 2 | ||||||
| 2025-07-30 | NP | APIE - ActivePassive International Equity ETF | 30 008 | −40,38 | 629 | −44,96 | ||||
| 2025-08-14 | 13F | Nfj Investment Group, Llc | 48 | −99,44 | 1 | −100,00 | ||||
| 2025-08-06 | 13F | First Horizon Advisors, Inc. | 625 | −8,49 | 13 | −7,69 | ||||
| 2025-08-14 | 13F | Verition Fund Management LLC | 168 647 | 163,57 | 3 484 | 178,27 | ||||
| 2025-08-11 | 13F | Pin Oak Investment Advisors Inc | 381 | 0,00 | 0 | |||||
| 2025-08-12 | 13F | Deutsche Bank Ag\ | 4 | 0 | ||||||
| 2025-05-14 | 13F | Pilgrim Partners Asia Pte Ltd | 0 | −100,00 | 0 | |||||
| 2025-05-16 | 13F/A | Kestra Investment Management, LLC | 0 | −100,00 | 0 | |||||
| 2025-07-16 | 13F | Eagle Global Advisors Llc | 210 295 | 0,48 | 4 345 | 6,03 | ||||
| 2025-08-08 | 13F/A | Sterling Capital Management LLC | 18 914 | −5,14 | 391 | 0,00 | ||||
| 2025-08-14 | 13F | Schonfeld Strategic Advisors LLC | 0 | −100,00 | 0 | |||||
| 2025-08-05 | 13F | Huntington National Bank | 563 | 3,30 | 12 | 10,00 | ||||
| 2025-05-15 | 13F | Bridgefront Capital, LLC | 0 | −100,00 | 0 | |||||
| 2025-08-14 | 13F/A | Barclays Plc | 5 006 | 58,72 | 0 | |||||
| 2025-07-24 | 13F | Us Bancorp \de\ | 88 158 | −18,03 | 1 821 | −13,49 | ||||
| 2025-07-28 | NP | AVSD - Avantis Responsible International Equity ETF | 2 893 | 0,00 | 61 | −7,69 | ||||
| 2025-04-29 | 13F | Callan Capital, LLC | 14 361 | 281 | ||||||
| 2025-07-24 | 13F | IFP Advisors, Inc | 100 | −16,67 | 2 | 0,00 | ||||
| 2025-08-13 | 13F | Renaissance Technologies Llc | 2 766 750 | 22,30 | 57 161 | 29,04 | ||||
| 2025-07-14 | 13F | GAMMA Investing LLC | 1 919 | 12,22 | 40 | 18,18 | ||||
| 2025-08-14 | 13F | Alliancebernstein L.p. | 10 662 375 | −27,59 | 220 285 | −23,60 | ||||
| 2025-07-16 | 13F | Signaturefd, Llc | 9 124 | −13,30 | 188 | −8,74 | ||||
| 2025-06-26 | NP | DFIV - Dimensional International Value ETF | 9 780 | 0,00 | 207 | 7,29 | ||||
| 2025-08-14 | 13F | Capstone Investment Advisors, Llc | 0 | −100,00 | 0 | −100,00 | ||||
| 2025-05-13 | 13F | United Capital Financial Advisers, Llc | 0 | −100,00 | 0 | |||||
| 2025-04-25 | NP | ONEQ - Fidelity Nasdaq Composite Index Tracking Stock This fund is a listed as child fund of Fmr Llc and if that institution has disclosed ownership in this security, then these positions will not be double counted when calculating total shares and total value | 16 836 | 2,61 | 382 | 8,24 | ||||
| 2025-08-11 | 13F | Hexagon Capital Partners LLC | 0 | −100,00 | 0 | |||||
| 2025-08-12 | 13F | MAI Capital Management | 539 | 290,58 | 11 | 450,00 | ||||
| 2025-08-07 | 13F | Campbell & CO Investment Adviser LLC | 107 217 | 293,14 | 2 215 | 315,57 | ||||
| 2025-07-11 | 13F | Farther Finance Advisors, LLC | 422 | 93,58 | 9 | 100,00 | ||||
| 2025-07-31 | 13F | CVA Family Office, LLC | 0 | −100,00 | 0 | |||||
| 2025-08-14 | 13F | Aqr Capital Management Llc | 29 963 | 619 | ||||||
| 2025-07-28 | NP | AVIV - Avantis International Large Cap Value ETF This fund is a listed as child fund of American Century Companies Inc and if that institution has disclosed ownership in this security, then these positions will not be double counted when calculating total shares and total value | 17 483 | 366 | ||||||
| 2025-08-05 | 13F | Bank Of Montreal /can/ | 40 056 | −1,12 | 828 | 4,29 | ||||
| 2025-07-25 | 13F | Yousif Capital Management, Llc | 10 943 | 7,78 | 226 | 14,14 | ||||
| 2025-08-07 | 13F | Zions Bancorporation, National Association /ut/ | 23 | −51,06 | 0 | |||||
| 2025-08-14 | 13F | Qube Research & Technologies Ltd | 0 | −100,00 | 0 | |||||
| 2025-04-28 | NP | CNCR - Loncar Cancer Immunotherapy ETF | 5 921 | −6,02 | 134 | −0,74 | ||||
| 2025-07-28 | 13F | Harbour Investments, Inc. | 133 | 0,00 | 3 | 0,00 | ||||
| 2025-06-26 | NP | APGAX - AB LARGE CAP GROWTH FUND INC Class A | 4 102 116 | −4,81 | 86 760 | 2,35 | ||||
| 2025-08-14 | 13F | Two Sigma Investments, Lp | 1 618 544 | −14,80 | 33 439 | −10,10 | ||||
| 2025-08-12 | 13F | SRS Capital Advisors, Inc. | 7 | 0,00 | 3 | |||||
| 2025-07-18 | 13F | Founders Capital Management | 1 000 | 21 | ||||||
| 2025-08-12 | 13F | Trexquant Investment LP | 363 114 | −22,28 | 7 502 | −17,99 | ||||
| 2025-08-14 | 13F | Private Wealth Advisors, LLC | 148 336 | 3 065 | ||||||
| 2025-08-06 | 13F | True Wealth Design, LLC | 50 | 56,25 | 1 | |||||
| 2025-08-14 | 13F | Mariner, LLC | 37 153 | −9,51 | 768 | −4,60 | ||||
| 2025-05-15 | 13F | Bridger Management, Llc | 0 | −100,00 | 0 | |||||
| 2025-08-13 | 13F | Rsm Us Wealth Management Llc | 25 794 | −0,94 | 533 | 4,52 | ||||
| 2025-08-14 | 13F | Avidity Partners Management LP | 650 000 | 13 429 | ||||||
| 2025-05-15 | 13F | Rise Advisors, LLC | 0 | −100,00 | 0 | |||||
| 2025-08-15 | 13F | Morgan Stanley | 2 697 135 | −4,99 | 55 723 | 0,24 | ||||
| 2025-08-12 | 13F | Dimensional Fund Advisors Lp | 53 105 | 4,49 | 1 097 | 10,25 | ||||
| 2025-05-09 | 13F | R Squared Ltd | 0 | −100,00 | 0 | |||||
| 2025-07-31 | 13F | Whipplewood Advisors, LLC | 18 | −89,16 | 0 | −100,00 | ||||
| 2025-07-24 | NP | FNCMX - Fidelity Nasdaq Composite Index Fund This fund is a listed as child fund of Fmr Llc and if that institution has disclosed ownership in this security, then these positions will not be double counted when calculating total shares and total value | 27 016 | 0,00 | 566 | −7,68 | ||||
| 2025-07-16 | 13F | Highline Wealth Partners Llc | 0 | −100,00 | 0 | |||||
| 2025-08-05 | 13F | Advisors Preferred, LLC | 0 | −100,00 | 0 | |||||
| 2025-08-12 | 13F | American Century Companies Inc | 308 437 | −19,66 | 6 372 | −15,22 | ||||
| 2025-08-14 | 13F | Woodline Partners LP | 493 506 | 10 196 | ||||||
| 2025-08-12 | 13F | Charles Schwab Investment Management Inc | 76 491 | 25,50 | 1 580 | 32,44 | ||||
| 2025-03-27 | NP | AGRFX - AB Growth Fund Class A | 129 000 | 0,00 | 2 537 | −11,88 | ||||
| 2025-07-17 | 13F | Alpine Bank Wealth Management | 0 | −100,00 | 0 | |||||
| 2025-08-14 | 13F | Caption Management, LLC | Put | 0 | −100,00 | 0 | ||||
| 2025-08-11 | 13F | Brown Brothers Harriman & Co | 544 | 0,00 | 11 | 10,00 | ||||
| 2025-08-14 | 13F | Caption Management, LLC | Call | 0 | −100,00 | 0 | ||||
| 2025-08-06 | NP | LINCOLN VARIABLE INSURANCE PRODUCTS TRUST - LVIP Blended Large Cap Growth Managed Volatility Fund Standard Class | 107 119 | −0,82 | 2 213 | 4,68 | ||||
| 2025-08-14 | 13F | Caption Management, LLC | 0 | −100,00 | 0 | |||||
| 2025-08-13 | 13F | NEOS Investment Management LLC | 130 217 | 26,73 | 2 690 | 33,76 | ||||
| 2025-07-30 | NP | ENDW - Cambria Endowment Style ETF | 20 | 0 | ||||||
| 2025-05-13 | 13F | Vestmark Advisory Solutions, Inc. | 0 | −100,00 | 0 | |||||
| 2025-08-06 | 13F | Baillie Gifford & Co | 12 | −77,78 | 0 | −100,00 | ||||
| 2025-07-24 | NP | Tema ETF Trust - Tema Oncology ETF | 116 562 | −2,22 | 2 442 | −9,69 | ||||
| 2025-08-14 | 13F | Graham Capital Management, L.P. | 0 | −100,00 | 0 | |||||
| 2025-05-15 | 13F | Glenmede Trust Co Na | 13 193 | 19,83 | 258 | 12,66 | ||||
| 2025-08-12 | 13F | Coldstream Capital Management Inc | 0 | −100,00 | 0 | |||||
| 2025-08-14 | 13F | Royal Bank Of Canada | 117 288 | −2,72 | 2 423 | 2,63 | ||||
| 2025-07-30 | 13F | Whittier Trust Co Of Nevada Inc | 0 | −100,00 | 0 | |||||
| 2025-08-14 | 13F | UBS Group AG | 484 867 | −10,38 | 10 017 | −5,43 | ||||
| 2025-07-21 | 13F | Hardman Johnston Global Advisors LLC | 0 | −100,00 | 0 | |||||
| 2025-08-12 | 13F | Advisors Asset Management, Inc. | 0 | −100,00 | 0 | |||||
| 2025-08-14 | 13F | Bank Of America Corp /de/ | 567 795 | −16,87 | 11 731 | −12,29 | ||||
| 2025-08-15 | 13F | Captrust Financial Advisors | 22 442 | 2,40 | 464 | 7,93 | ||||
| 2025-08-28 | 13F | China Universal Asset Management Co., Ltd. | 18 421 | −60,13 | 381 | −57,96 | ||||
| 2025-08-11 | 13F | GW&K Investment Management, LLC | 140 | 0,00 | 0 | |||||
| 2025-08-11 | 13F | Cornerstone Planning Group LLC | 97 | 193,94 | 2 | |||||
| 2025-08-14 | 13F | Stifel Financial Corp | 22 748 | −63,92 | 470 | −61,99 | ||||
| 2025-05-15 | 13F | PenderFund Capital Management Ltd. | 0 | −100,00 | 0 | |||||
| 2025-07-11 | 13F | Pinnacle Bancorp, Inc. | 733 | 0,00 | 15 | 7,14 | ||||
| 2025-07-15 | 13F | Fifth Third Bancorp | 41 425 | −1,72 | 856 | 3,64 | ||||
| 2025-08-13 | 13F | Mount Yale Investment Advisors, LLC | 280 | 6 | ||||||
| 2025-08-13 | 13F | Natixis Advisors, L.p. | 130 445 | 1,49 | 3 | 0,00 | ||||
| 2025-08-14 | 13F | Cubist Systematic Strategies, LLC | 384 546 | −69,44 | 7 945 | −67,75 | ||||
| 2025-08-13 | 13F | Bare Financial Services, Inc | 0 | −100,00 | 0 | |||||
| 2025-08-14 | 13F | Quantinno Capital Management LP | 158 132 | 64,88 | 3 267 | 74,05 | ||||
| 2025-08-25 | 13F/A | Neuberger Berman Group LLC | 47 093 | 6,33 | 973 | 12,11 | ||||
| 2025-08-19 | NP | RIFAX - U.S. Strategic Equity Fund | 25 963 | 0,00 | 536 | 5,51 | ||||
| 2025-08-29 | NP | WDNA - WisdomTree BioRevolution Fund N/A | 967 | −0,51 | 20 | 0,00 | ||||
| 2025-07-24 | 13F | Callan Family Office, LLC | 31 681 | 655 | ||||||
| 2025-08-08 | 13F | Wealth Alliance | 14 455 | 2,31 | 299 | 7,97 | ||||
| 2025-08-11 | 13F | Principal Securities, Inc. | 2 231 | −16,35 | 46 | −16,36 | ||||
| 2025-08-13 | 13F | Northern Trust Corp | 803 602 | 28,55 | 16 602 | 35,65 | ||||
| 2025-04-22 | 13F | Mendota Financial Group, LLC | 0 | −100,00 | 0 | |||||
| 2025-08-14 | 13F | Tang Capital Management Llc | 200 000 | 0,00 | 4 132 | 5,52 | ||||
| 2025-08-28 | NP | DTLGX - Large Company Growth Portfolio Investment Class | 9 954 | −0,99 | 206 | 4,59 | ||||
| 2025-08-12 | 13F | Nemes Rush Group LLC | 60 | 1 | ||||||
| 2025-08-14 | 13F/A | Skopos Labs, Inc. | 7 354 | 73,20 | 152 | 81,93 | ||||
| 2025-07-15 | 13F | Fortitude Family Office, LLC | 0 | −100,00 | 0 | |||||
| 2025-05-08 | NP | QGBLX - Quantified Global Fund Investor Class | 4 481 | 74,83 | 88 | 7,41 | ||||
| 2025-08-19 | 13F/A | Pitcairn Co | 12 266 | −20,20 | 253 | −15,67 | ||||
| 2025-09-04 | 13F/A | Advisor Group Holdings, Inc. | 1 603 | 37,83 | 33 | 50,00 | ||||
| 2025-07-31 | 13F | DDD Partners, LLC | 0 | −100,00 | 0 | |||||
| 2025-08-14 | 13F | Raymond James Financial Inc | 31 146 | 48,08 | 643 | 56,45 | ||||
| 2025-05-13 | 13F | Ethic Inc. | 0 | −100,00 | 0 | |||||
| 2025-08-14 | 13F | Point72 Asset Management, L.P. | 538 500 | −41,71 | 11 125 | −38,50 | ||||
| 2025-08-13 | 13F | Northwestern Mutual Wealth Management Co | 38 | 1 | ||||||
| 2025-08-14 | 13F | Orbis Allan Gray Ltd | 7 920 400 | 38,69 | 163 635 | 46,34 | ||||
| 2025-06-18 | NP | RSEAX - U.S. Strategic Equity Fund Class A | 138 075 | 12,48 | 2 920 | 20,96 | ||||
| 2025-08-12 | 13F | Global Retirement Partners, LLC | 1 956 | −2,88 | 40 | −4,76 | ||||
| 2025-08-13 | 13F | Mackenzie Financial Corp | 31 910 | −3,33 | 659 | 2,01 | ||||
| 2025-08-12 | 13F | Brandywine Global Investment Management, LLC | 1 744 769 | 1,59 | 36 047 | 7,20 | ||||
| 2025-08-13 | 13F | Twin Peaks Wealth Advisors, LLC | 187 | 4 | ||||||
| 2025-07-30 | 13F | FNY Investment Advisers, LLC | 2 | 0 | ||||||
| 2025-08-28 | NP | SEUIX - Simt Large Cap Value Fund Class I | 99 887 | 7,05 | 2 064 | 12,92 | ||||
| 2025-08-13 | 13F | Capital Fund Management S.a. | 226 584 | 110,73 | 4 681 | 122,38 | ||||
| 2025-07-22 | 13F | Gf Fund Management Co. Ltd. | 1 073 | 0,00 | 22 | 4,76 | ||||
| 2025-08-11 | 13F | Citigroup Inc | 87 471 | 337,03 | 1 807 | 362,15 | ||||
| 2025-08-04 | 13F | Creative Financial Designs Inc /adv | 0 | −100,00 | 0 | |||||
| 2025-08-08 | 13F | Crossmark Global Holdings, Inc. | 41 813 | −6,77 | 864 | −1,71 | ||||
| 2025-08-12 | 13F | BlackRock, Inc. | 3 166 021 | −10,00 | 65 410 | −5,04 | ||||
| 2025-05-12 | 13F | Aigen Investment Management, Lp | 0 | −100,00 | 0 | |||||
| 2025-06-26 | NP | DFALX - Large Cap International Portfolio - Institutional Class This fund is a listed as child fund of Dimensional Fund Advisors Lp and if that institution has disclosed ownership in this security, then these positions will not be double counted when calculating total shares and total value | 1 009 | 0,00 | 21 | 10,53 | ||||
| 2025-05-15 | 13F | Deep Track Capital, LP | 0 | −100,00 | 0 | |||||
| 2025-07-21 | 13F | Ameritas Advisory Services, LLC | 100 | 2 | ||||||
| 2025-05-15 | 13F | Hrt Financial Lp | 0 | −100,00 | 0 | |||||
| 2025-07-25 | 13F | Sequoia Financial Advisors, LLC | 20 419 | −7,70 | 422 | −2,77 | ||||
| 2025-08-07 | 13F | Sierra Ocean, Llc | 211 | 12,83 | 4 | 33,33 | ||||
| 2025-07-21 | 13F | Credential Qtrade Securities Inc. | 0 | −100,00 | 0 | −100,00 | ||||
| 2025-08-14 | 13F | Headlands Technologies LLC | 10 166 | 551,67 | 210 | 600,00 | ||||
| 2025-05-15 | 13F | WPG Advisers, LLC | 0 | −100,00 | 0 | −100,00 | ||||
| 2025-07-29 | 13F | Regions Financial Corp | 12 483 | −6,14 | 258 | −1,15 | ||||
| 2025-07-30 | 13F | Bogart Wealth, LLC | 146 | 0,00 | 3 | 50,00 | ||||
| 2025-08-08 | 13F | Gts Securities Llc | 114 743 | 2 371 | ||||||
| 2025-05-12 | 13F | Nomura Asset Management Co Ltd | 0 | 0 | ||||||
| 2025-08-15 | 13F | Binnacle Investments Inc | 39 | 143,75 | 1 | |||||
| 2025-06-26 | NP | DFSI - Dimensional International Sustainability Core 1 ETF | 2 300 | 0,00 | 49 | 6,67 | ||||
| 2025-07-17 | 13F | Park Place Capital Corp | 156 | 0,00 | 3 | 0,00 | ||||
| 2025-07-10 | 13F | Exchange Traded Concepts, Llc | 0 | −100,00 | 0 | |||||
| 2025-05-06 | 13F | Venturi Wealth Management, LLC | 0 | −100,00 | 0 | |||||
| 2025-08-14 | 13F | Voloridge Investment Management, Llc | 949 178 | −27,72 | 19 610 | −23,74 | ||||
| 2025-08-01 | 13F | Y-Intercept (Hong Kong) Ltd | 29 329 | −9,69 | 606 | −4,72 | ||||
| 2025-08-12 | 13F | Country Trust Bank | 0 | −100,00 | 0 | |||||
| 2025-05-12 | 13F | Capital International Investors | 0 | −100,00 | 0 | |||||
| 2025-08-26 | NP | FBT - First Trust NYSE Arca Biotechnology Index Fund This fund is a listed as child fund of First Trust Advisors Lp and if that institution has disclosed ownership in this security, then these positions will not be double counted when calculating total shares and total value | 1 679 981 | −0,66 | 34 708 | 4,82 | ||||
| 2025-07-11 | 13F/A | Umb Bank N A/mo | 928 | 206,27 | 19 | 280,00 | ||||
| 2025-04-25 | 13F | Mather Group, Llc. | 0 | −100,00 | 0 | |||||
| 2025-08-14 | 13F | Wetherby Asset Management Inc | 0 | −100,00 | 0 | |||||
| 2025-08-14 | 13F | Scientech Research LLC | 35 077 | 1,35 | 725 | 6,94 | ||||
| 2025-08-14 | 13F | Barometer Capital Management Inc. | 19 137 | 395 | ||||||
| 2025-07-14 | 13F | Park Avenue Securities Llc | 14 940 | 5,90 | 0 | |||||
| 2025-08-26 | NP | AB VARIABLE PRODUCTS SERIES FUND, INC. - AB Large Cap Growth Portfolio Class A | 147 067 | 0,00 | 3 038 | 5,52 | ||||
| 2025-06-26 | NP | DFAI - Dimensional International Core Equity Market ETF | 22 620 | 0,00 | 478 | 7,66 | ||||
| 2025-08-12 | 13F | Franklin Resources Inc | 30 154 | −3,38 | 623 | 1,80 | ||||
| 2025-08-08 | 13F | Pnc Financial Services Group, Inc. | 18 622 | −81,48 | 385 | −80,49 | ||||
| 2025-08-12 | 13F | Rhumbline Advisers | 17 207 | 1,48 | 355 | 7,25 | ||||
| 2025-07-31 | 13F | Ingalls & Snyder Llc | 119 484 | −19,98 | 2 | 0,00 | ||||
| 2025-08-14 | 13F | Point72 Hong Kong Ltd | 15 377 | 318 | ||||||
| 2025-08-26 | NP | FTQI - First Trust Hedged BuyWrite Income ETF This fund is a listed as child fund of First Trust Advisors Lp and if that institution has disclosed ownership in this security, then these positions will not be double counted when calculating total shares and total value | 63 536 | 2 802,51 | 1 313 | 1 480,72 | ||||
| 2025-06-27 | NP | SUNAMERICA SERIES TRUST - SA AB Growth Portfolio Class 1 | 288 808 | 5,69 | 6 108 | 13,64 | ||||
| 2025-07-30 | 13F | Financial Perspectives, Inc | 1 333 | 0,00 | 28 | 3,85 | ||||
| 2025-08-14 | 13F | Bnp Paribas Arbitrage, Sa | 48 139 | −77,33 | 995 | −76,09 | ||||
| 2025-08-14 | 13F | GWM Advisors LLC | 93 | −99,19 | 2 | −99,56 | ||||
| 2025-08-08 | 13F | POM Investment Strategies, LLC | 0 | −100,00 | 0 | |||||
| 2025-08-14 | 13F | Vident Advisory, LLC | 31 482 | 154,36 | 650 | 168,60 | ||||
| 2025-08-15 | 13F | Tower Research Capital LLC (TRC) | 46 653 | 4 407,54 | 964 | 4 715,00 | ||||
| 2025-08-08 | 13F | Mitsubishi UFJ Trust & Banking Corp | 52 872 | 374,32 | 1 092 | 400,92 | ||||
| 2025-08-11 | 13F | Rothschild Investment Llc | 746 | 9,22 | 15 | 15,38 | ||||
| 2025-08-14 | 13F | Evergreen Capital Management Llc | 9 697 | 200 | ||||||
| 2025-08-12 | 13F | AlphaCore Capital LLC | 2 122 | 44 | ||||||
| 2025-05-15 | 13F | StoneX Group Inc. | 0 | −100,00 | 0 | −100,00 | ||||
| 2025-07-29 | 13F | Salomon & Ludwin, LLC | 12 | 0 | ||||||
| 2025-08-14 | 13F | Mercer Global Advisors Inc /adv | 32 467 | −35,27 | 671 | −31,77 | ||||
| 2025-08-15 | 13F | Provenance Wealth Advisors, LLC | 0 | −100,00 | 0 | |||||
| 2025-08-12 | 13F | CIBC Private Wealth Group, LLC | 783 | −52,86 | 16 | −44,83 | ||||
| 2025-08-26 | NP | GMOI - GMO International Value ETF | 4 239 | 88 | ||||||
| 2025-03-24 | 13F/A | Wellington Management Group Llp | 0 | −100,00 | 0 | |||||
| 2025-08-04 | 13F | Hantz Financial Services, Inc. | 5 428 | 1 590,97 | 0 | |||||
| 2025-08-12 | 13F | Steward Partners Investment Advisory, Llc | 80 | 0,00 | 2 | 0,00 | ||||
| 2025-07-28 | 13F | BRYN MAWR TRUST Co | 0 | −100,00 | 0 | |||||
| 2025-08-13 | 13F | Continuum Advisory, LLC | 0 | −100,00 | 0 | |||||
| 2025-07-22 | 13F | DAVENPORT & Co LLC | 33 826 | 6,78 | 699 | 12,58 | ||||
| 2025-08-12 | 13F | Folketrygdfondet | 172 796 | 1,42 | 3 570 | 6,98 | ||||
| 2025-08-13 | 13F | Arrowstreet Capital, Limited Partnership | 3 454 378 | 152,25 | 71 367 | 166,17 | ||||
| 2025-08-06 | 13F | Mark Sheptoff Financial Planning, Llc | 1 400 | 0,00 | 29 | 3,70 | ||||
| 2025-04-28 | NP | ADGAX - AB CORE OPPORTUNITIES FUND, INC. Class A | 29 174 | −4,81 | 662 | 0,46 | ||||
| 2025-08-14 | 13F | Glenmede Investment Management, LP | 13 859 | 286 | ||||||
| 2025-07-29 | NP | CAVAX - Catholic Values Equity Fund Class F, effective 1-31-2017 (formerly Class A) | 0 | −100,00 | 0 | −100,00 | ||||
| 2025-08-11 | 13F | Madison Asset Management, LLC | 62 930 | 0,91 | 1 300 | 6,47 | ||||
| 2025-06-26 | NP | DFIC - Dimensional International Core Equity 2 ETF | 1 800 | 0,00 | 38 | 8,57 | ||||
| 2025-08-14 | 13F | Susquehanna International Group, Llp | 30 394 | 628 | ||||||
| 2025-08-14 | 13F | Susquehanna International Group, Llp | Call | 14 200 | −62,92 | 293 | −60,88 | |||
| 2025-08-14 | 13F | Citadel Advisors Llc | 3 569 184 | −19,37 | 73 739 | −14,92 | ||||
| 2025-08-14 | 13F | Susquehanna International Group, Llp | Put | 16 900 | 33,07 | 349 | 40,73 | |||
| 2025-08-14 | 13F | Two Sigma Advisers, Lp | 1 821 000 | −7,74 | 37 622 | −2,65 | ||||
| 2025-08-13 | 13F | Cerity Partners LLC | 22 834 | −44,18 | 472 | −41,12 | ||||
| 2025-08-13 | 13F | EverSource Wealth Advisors, LLC | 2 114 | 124,89 | 44 | 138,89 | ||||
| 2025-08-08 | 13F | SBI Securities Co., Ltd. | 307 | 42,13 | 6 | 50,00 | ||||
| 2025-07-25 | 13F | Envestnet Portfolio Solutions, Inc. | 11 658 | −16,79 | 241 | −12,41 | ||||
| 2025-05-15 | 13F | Wiley Bros.-aintree Capital, Llc | 0 | −100,00 | 0 | |||||
| 2025-07-25 | 13F | Stephens Consulting, LLC | 79 | 2 | ||||||
| 2025-08-27 | 13F/A | Squarepoint Ops LLC | 94 233 | 636,25 | 1 947 | 678,40 | ||||
| 2025-07-15 | 13F | Td Private Client Wealth Llc | 6 308 | −21,80 | 130 | −17,20 | ||||
| 2025-07-28 | NP | BIB - ProShares Ultra Nasdaq Biotechnology | 1 542 | −14,95 | 32 | −21,95 | ||||
| 2025-08-14 | 13F | Citadel Advisors Llc | Call | 18 300 | −62,03 | 378 | −59,92 | |||
| 2025-08-14 | 13F | Citadel Advisors Llc | Put | 26 800 | −29,47 | 554 | −25,67 | |||
| 2025-08-14 | 13F | Goldman Sachs Group Inc | 889 275 | 25,54 | 18 372 | 32,47 | ||||
| 2025-08-15 | 13F | Kestra Advisory Services, LLC | 0 | −100,00 | 0 | |||||
| 2025-07-29 | NP | SCPAX - Siit Large Cap Disciplined Equity Fund - Class A | 67 210 | 4,79 | 1 408 | −3,16 | ||||
| 2025-08-14 | 13F | Camber Capital Management LP | 0 | −100,00 | 0 | |||||
| 2025-07-28 | NP | AVDEX - Avantis International Equity Fund Institutional Class This fund is a listed as child fund of American Century Companies Inc and if that institution has disclosed ownership in this security, then these positions will not be double counted when calculating total shares and total value | 17 015 | 215,09 | 356 | 191,80 | ||||
| 2025-07-21 | 13F | Ameriflex Group, Inc. | 0 | −100,00 | 0 | |||||
| 2025-07-24 | 13F | Jfs Wealth Advisors, Llc | 129 | −9,79 | 3 | 0,00 | ||||
| 2025-08-27 | 13F/A | Brinker Capital Investments, LLC | 19 252 | −9,46 | 398 | −4,57 | ||||
| 2025-08-14 | 13F | Point72 Europe (London) LLP | 471 700 | 9 745 | ||||||
| 2025-05-15 | 13F | Millennium Management Llc | Call | 0 | −100,00 | 0 | −100,00 | |||
| 2025-08-18 | 13F/A | Hudson Bay Capital Management LP | 300 000 | −1,64 | 6 198 | 3,80 | ||||
| 2025-07-10 | 13F | Wealth Enhancement Advisory Services, Llc | 12 685 | 257 | ||||||
| 2025-07-21 | 13F | Qrg Capital Management, Inc. | 65 902 | −11,95 | 1 362 | −7,10 | ||||
| 2025-08-14 | 13F | Smartleaf Asset Management LLC | 6 008 | 4,09 | 123 | 7,89 | ||||
| 2025-05-12 | 13F | Prestige Wealth Management Group LLC | 0 | −100,00 | 0 | |||||
| 2025-07-25 | 13F | LRI Investments, LLC | 558 | 0,00 | 12 | 10,00 | ||||
| 2025-08-13 | 13F | Foresight Group Ltd Liability Partnership | 48 007 | −1,47 | 9 933 | 5,07 | ||||
| 2025-05-05 | 13F | Lindbrook Capital, Llc | 901 | −51,32 | 18 | −55,26 | ||||
| 2025-07-08 | 13F | Gallacher Capital Management LLC | 17 348 | 20,93 | 358 | 27,86 | ||||
| 2025-08-11 | 13F | Annis Gardner Whiting Capital Advisors, LLC | 122 | 3 | ||||||
| 2025-08-28 | NP | SLGAX - SIMT Large Cap Fund Class F | 82 643 | 30,59 | 1 707 | 37,77 | ||||
| 2025-08-14 | 13F | Avidity Partners Management LP | Call | 0 | −100,00 | 0 | −100,00 | |||
| 2025-05-14 | 13F | OMERS ADMINISTRATION Corp | 0 | −100,00 | 0 | |||||
| 2025-08-11 | 13F | Bell Investment Advisors, Inc | 164 | 105,00 | 3 | 200,00 | ||||
| 2025-05-02 | 13F | Concord Wealth Partners | 0 | −100,00 | 0 | |||||
| 2025-08-15 | 13F | WealthCollab, LLC | 357 | −32,26 | 7 | −30,00 | ||||
| 2025-07-07 | 13F | Versant Capital Management, Inc | 10 567 | 21,13 | 218 | 28,24 | ||||
| 2025-08-14 | 13F | Principia Wealth Advisory, LLC | 13 | 0 | ||||||
| 2025-07-21 | 13F | Mirae Asset Global Investments Co., Ltd. | 1 620 | −94,94 | 33 | −94,76 | ||||
| 2025-07-28 | 13F | Private Wealth Asset Management, LLC | 35 | 0,00 | 1 | |||||
| 2025-08-01 | 13F | Envestnet Asset Management Inc | 749 603 | 1,80 | 15 487 | 7,41 | ||||
| 2025-07-31 | 13F | Washington Trust Advisors, Inc. | 196 | 0,00 | 4 | 33,33 | ||||
| 2025-08-08 | 13F | Hartland & Co., LLC | 71 | 0,00 | 1 | 0,00 | ||||
| 2025-07-02 | 13F | Marotta Asset Management | 12 084 | −10,70 | 250 | −24,32 | ||||
| 2025-08-13 | 13F | Quadrature Capital Ltd | 0 | −100,00 | 0 | |||||
| 2025-08-07 | 13F | Allworth Financial LP | 983 | 35,77 | 20 | 42,86 | ||||
| 2025-08-07 | 13F | Parkside Financial Bank & Trust | 334 | 73,96 | 7 | 100,00 | ||||
| 2025-08-14 | 13F | Jain Global LLC | 35 281 | 56,44 | 729 | 65,08 | ||||
| 2025-07-31 | 13F | Caitong International Asset Management Co., Ltd | 5 809 | 200,83 | 120 | 224,32 | ||||
| 2025-08-12 | 13F | LPL Financial LLC | 250 829 | 22,73 | 5 182 | 29,52 | ||||
| 2025-08-13 | 13F | Quantbot Technologies LP | 0 | −100,00 | 0 | |||||
| 2025-08-21 | NP | MNCSX - Mercer Non-US Core Equity Fund Class I | 179 676 | 3 712 | ||||||
| 2025-08-05 | 13F | Simplex Trading, Llc | 5 630 | −91,13 | 0 | −100,00 | ||||
| 2025-07-30 | 13F | Legacy Wealth Asset Management, LLC | 47 018 | −4,76 | 971 | 0,52 | ||||
| 2025-08-14 | 13F | Optiver Holding B.V. | 155 954 | 3 222 | ||||||
| 2025-08-18 | 13F | Geneos Wealth Management Inc. | 509 | 2,21 | 11 | 11,11 | ||||
| 2025-07-24 | 13F | Ronald Blue Trust, Inc. | 9 871 | 33,16 | 204 | 40,00 | ||||
| 2025-08-12 | 13F | Pathstone Holdings, LLC | 14 002 | −9,07 | 289 | −3,99 | ||||
| 2025-08-14 | 13F | Riggs Asset Managment Co. Inc. | 50 | 0,00 | 1 | |||||
| 2025-08-07 | 13F | Vise Technologies, Inc. | 14 458 | 12,15 | 299 | 10,78 | ||||
| 2025-08-08 | 13F | SG Americas Securities, LLC | 16 314 | −28,74 | 0 | |||||
| 2025-08-22 | NP | FENI - Fidelity Enhanced International ETF | 232 753 | 9,21 | 4 809 | 15,22 | ||||
| 2025-08-12 | 13F | Jpmorgan Chase & Co | 933 309 | 17,03 | 19 282 | 23,49 | ||||
| 2025-05-15 | 13F | Bamco Inc /ny/ | 0 | −100,00 | 0 | −100,00 | ||||
| 2025-08-15 | 13F | Great West Life Assurance Co /can/ | 2 526 | 11,57 | 0 | |||||
| 2025-08-14 | 13F | Ubs Oconnor Llc | 158 719 | 120,82 | 3 279 | 133,05 | ||||
| 2025-08-11 | 13F | Anderson Financial Strategies, LLC | 0 | −100,00 | 0 | |||||
| 2025-08-01 | 13F | Bessemer Group Inc | 231 | 0,00 | 0 | |||||
| 2025-08-04 | 13F | Atria Investments Llc | 30 565 | −1,53 | 631 | 3,95 | ||||
| 2025-08-13 | 13F | Walleye Capital LLC | 0 | −100,00 | 0 | |||||
| 2025-08-13 | 13F | Jones Financial Companies Lllp | 1 511 | 13,78 | 31 | 15,38 | ||||
| 2025-08-12 | 13F | AIMZ Investment Advisors, LLC | 165 880 | −1,13 | 3 427 | 4,32 | ||||
| 2025-08-13 | 13F | Level Four Advisory Services, Llc | 64 925 | 24,77 | 1 341 | 31,73 | ||||
| 2025-08-05 | 13F | Bank of New York Mellon Corp | 56 202 | 4,95 | 1 161 | 10,78 | ||||
| 2025-08-11 | 13F | NewEdge Wealth, LLC | 0 | −100,00 | 0 | |||||
| 2025-08-08 | 13F | Abc Arbitrage Sa | 447 055 | 9 236 | ||||||
| 2025-06-26 | NP | DFAX - Dimensional World ex U.S. Core Equity 2 ETF | 1 020 | 0,00 | 22 | 5,00 | ||||
| 2025-08-27 | NP | TPIAX - Timothy Plan International Fund Class A | 100 000 | 0,00 | 2 066 | 5,52 | ||||
| 2025-07-29 | 13F | Private Trust Co Na | 8 | 0,00 | 0 | |||||
| 2025-05-15 | 13F/A | Orion Portfolio Solutions, LLC | 21 263 | 22,37 | 416 | 14,92 | ||||
| 2025-08-14 | 13F | Synovus Financial Corp | 34 798 | 7,60 | 719 | 13,43 | ||||
| 2025-08-13 | 13F | Skandinaviska Enskilda Banken AB (publ) | 23 887 | 0,00 | 494 | 5,57 | ||||
| 2025-07-18 | 13F | Truist Financial Corp | 26 526 | −8,50 | 548 | −3,35 | ||||
| 2025-07-28 | NP | IBBQ - Invesco Nasdaq Biotechnology ETF This fund is a listed as child fund of Invesco Ltd. and if that institution has disclosed ownership in this security, then these positions will not be double counted when calculating total shares and total value | 1 655 | 3,63 | 35 | −5,56 | ||||
| 2025-08-13 | 13F | Marshall Wace, Llp | 1 907 284 | −12,57 | 39 404 | −7,75 | ||||
| 2025-05-15 | 13F | Old Mission Capital Llc | 0 | −100,00 | 0 | −100,00 | ||||
| 2025-05-15 | 13F | Aquatic Capital Management LLC | 0 | −100,00 | 0 | |||||
| 2025-08-08 | 13F | Avantax Advisory Services, Inc. | 71 635 | −1,05 | 1 480 | 4,38 | ||||
| 2025-08-07 | 13F | Acadian Asset Management Llc | 0 | −100,00 | 0 | |||||
| 2025-07-21 | 13F | Cromwell Holdings LLC | 648 | 13 | ||||||
| 2025-08-28 | NP | IBB - iShares Nasdaq Biotechnology ETF | 2 512 991 | −15,81 | 51 918 | −11,17 | ||||
| 2025-05-13 | 13F | Employees Retirement System of Texas | 0 | −100,00 | 0 | |||||
| 2025-08-14 | 13F | Sei Investments Co | 62 111 | 1,56 | 1 283 | 7,18 | ||||
| 2025-07-28 | NP | AVDE - Avantis International Equity ETF This fund is a listed as child fund of American Century Companies Inc and if that institution has disclosed ownership in this security, then these positions will not be double counted when calculating total shares and total value | 198 035 | 32,86 | 4 149 | 22,72 | ||||
| 2025-07-14 | 13F | Abound Wealth Management | 7 | 0,00 | 0 | |||||
| 2025-07-31 | 13F | Oppenheimer Asset Management Inc. | 254 551 | 2,04 | 5 259 | 7,68 | ||||
| 2025-08-14 | 13F | Fmr Llc | 680 533 | 40,36 | 14 060 | 48,10 | ||||
| 2025-08-12 | 13F | Proequities, Inc. | 0 | 0 | ||||||
| 2025-08-14 | 13F | Millennium Management Llc | 386 296 | −55,54 | 7 981 | −53,09 | ||||
| 2025-07-25 | 13F | Cwm, Llc | 1 797 | 50,50 | 0 |
Other Listings
| DE:GE91 | € 23,60 |