Grunnleggende statistikk
| Institusjonelle eiere | 107 total, 107 long only, 0 short only, 0 long/short - change of 9,09% MRQ |
| Gjennomsnittlig porteføljeallokering | 0.5780 % - change of −14,33% MRQ |
| Institusjonelle aksjer (Long) | 3 973 340 (ex 13D/G) - change of −0,02MM shares −0,47% MRQ |
| Institusjonell verdi (Long) | $ 242 759 USD ($1000) |
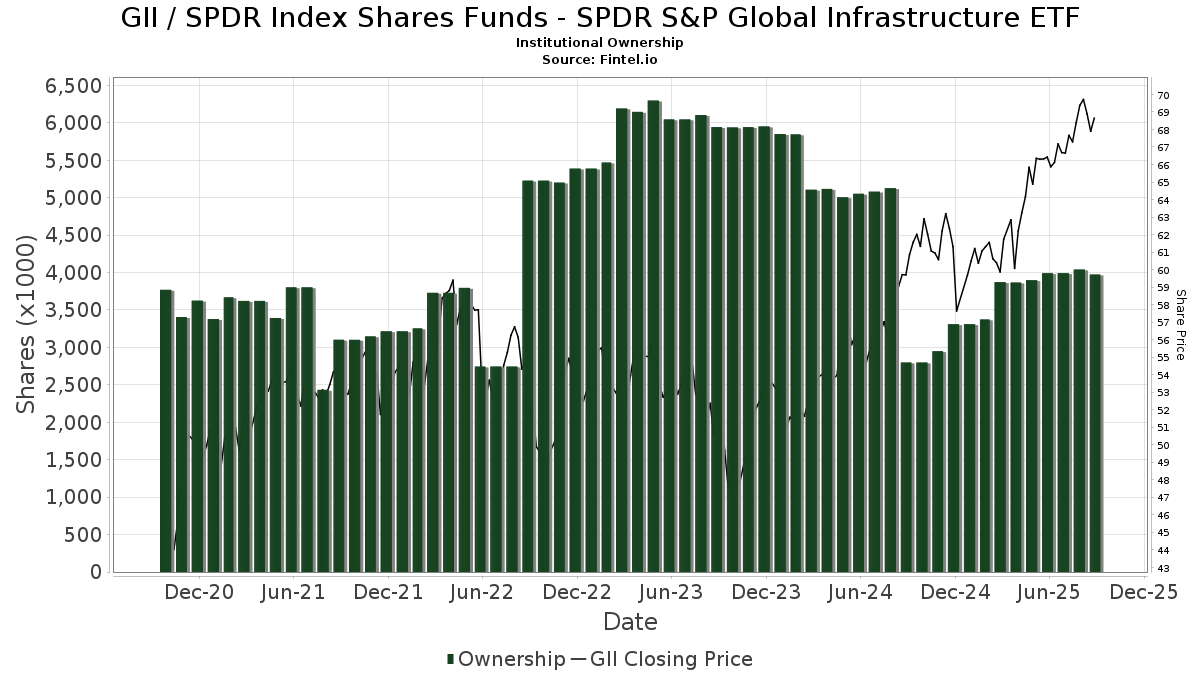
Institusjonelt eierskap og aksjonærer
SPDR Index Shares Funds - SPDR S&P Global Infrastructure ETF (US:GII) har 107 institusjonelle eiere og aksjonærer som har sendt inn 13D/G- eller 13F-skjemaer til Securities Exchange Commission (SEC). Disse institusjonene eier til sammen 3,973,340 aksjer. De største aksjonærene inkluderer RLY - SPDR SSGA Multi-Asset Real Return ETF, Wealth Architects, LLC, LPL Financial LLC, Mariner, LLC, Hills Bank & Trust Co, Wharton Business Group, LLC, Warren Street Wealth Advisors, LLC, Baker Avenue Asset Management, LP, TOWER TRUST & INVESTMENT Co, and INKM - SPDR SSGA Income Allocation ETF .
SPDR Index Shares Funds - SPDR S&P Global Infrastructure ETF (ARCA:GII) institusjonell eierstruktur viser nåværende posisjoner i selskapet fordelt på institusjoner og fond, samt de siste endringene i posisjonsstørrelse. De største aksjonærene kan være individuelle investorer, verdipapirfond, hedgefond eller institusjoner. Schedule 13D indikerer at investoren eier (eller har eid) mer enn 5 % av selskapet og har til hensikt (eller hadde til hensikt) å aktivt forfølge en endring i forretningsstrategien. Schedule 13G indikerer en passiv investering på over 5 %.
The share price as of September 11, 2025 is 69,39 / share. Previously, on September 12, 2024, the share price was 60,02 / share. This represents an increase of 15,61% over that period.
Fondssentiment-score
Fondssentiment Score (også kjent som akkumulering av eierskap poengsum) viser hvilke aksjer som er mest kjøpt av fond. Den er resultatet av en sofistikert, kvantitativ flerfaktormodell som identifiserer selskaper med de høyeste nivåene av institusjonell akkumulering. Beregningsmodellen for poeng bruker en kombinasjon av den totale økningen i antall offentliggjorte eiere, endringer i porteføljeallokeringen til disse eierne og andre beregninger. Tallet går fra 0 til 100, der høyere tall indikerer en høyere grad av akkumulering i forhold til sammenlignbare selskaper, der 50 er gjennomsnittet.
Oppdateringsfrekvens: Daglig
Sjekk ut Ownership Explorer, som inneholder en liste over de høyest rangerte selskapene.
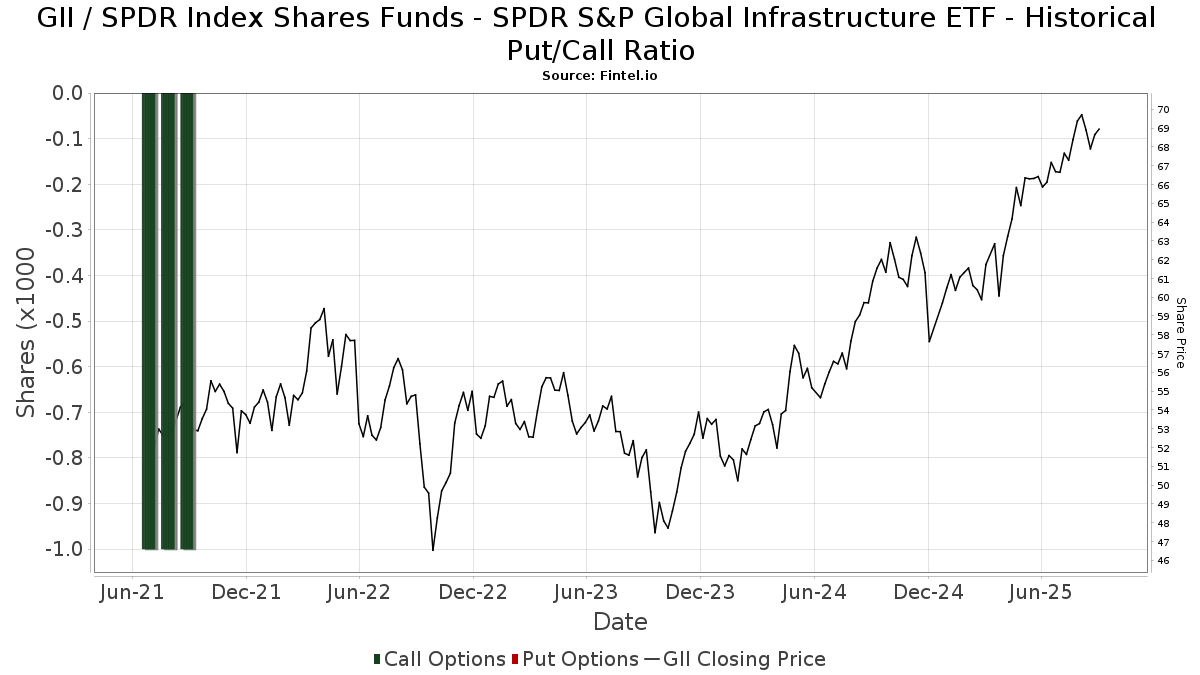
Institusjonell Put/Call-forhold
I tillegg til å rapportere standard aksje- og gjeldsemisjoner må institusjoner med mer enn 100 millioner kroner i forvaltningskapital også oppgi beholdningen av put- og callopsjoner. Siden put-opsjoner generelt indikerer et negativt sentiment, og call-opsjoner indikerer et positivt sentiment, kan vi få et inntrykk av det generelle institusjonelle sentimentet ved å plotte forholdet mellom put- og call-opsjoner. Diagrammet til høyre viser det historiske forholdet mellom put- og call-opsjoner for dette instrumentet.
Ved å bruke Put/Call-forholdet som en indikator på investorsentimentet kan man overvinne en av de viktigste svakhetene ved å bruke totalt institusjonelt eierskap, nemlig at en betydelig andel av forvaltningskapitalen investeres passivt for å følge indekser. Passivt forvaltede fond kjøper vanligvis ikke opsjoner, slik at indikatoren for put/call-forhold i større grad gjenspeiler stemningen i aktivt forvaltede fond.
13F- og NPORT-arkiveringer
Detaljer om 13F-arkiveringer er gratis. Detaljer om NP-arkiveringer krever et premium-medlemskap. Grønne rader indikerer nye posisjoner. Røde rader indikerer lukkede posisjoner. Klikk på lenke ikonet for å se hele transaksjonshistorikken.
Oppgrader
for å låse opp premiedata og eksportere til Excel. ![]() .
.
| Fildato | Kilde | Investor | Type | Gjennomsnittlig pris (estimert) |
Aksjer | Δ Aksjer (%) |
Rapportert verdi ($1000) | Verdi (%) | Portallokering (%) | |
|---|---|---|---|---|---|---|---|---|---|---|
| 2025-08-14 | 13F | Royal Bank Of Canada | 9 072 | 58,80 | 611 | 72,60 | ||||
| 2025-07-16 | 13F | Paragon Capital Management Ltd | 5 142 | 0,67 | 346 | 9,49 | ||||
| 2025-08-15 | 13F | Morgan Stanley | 62 602 | 45,17 | 4 215 | 57,69 | ||||
| 2025-08-08 | 13F | Altfest L J & Co Inc | 3 340 | 0,81 | 225 | 9,27 | ||||
| 2025-08-13 | 13F | Marshall Wace, Llp | 16 171 | 1 089 | ||||||
| 2025-07-18 | 13F | Naples Global Advisors, Llc | 40 890 | 3,61 | 2 753 | 12,55 | ||||
| 2025-08-08 | 13F | Austin Wealth Management, LLC | 3 821 | 0,00 | 257 | 4,92 | ||||
| 2025-08-14 | 13F | Kovitz Investment Group Partners, LLC | 7 521 | 506 | ||||||
| 2025-08-13 | 13F | Northwestern Mutual Wealth Management Co | 7 482 | −2,12 | 504 | 6,34 | ||||
| 2025-07-24 | 13F | Comprehensive Money Management Services LLC | 15 854 | −2,93 | 1 067 | 5,43 | ||||
| 2025-08-07 | 13F | Prime Buchholz LLC | 30 509 | 0,10 | 2 054 | 8,73 | ||||
| 2025-08-05 | 13F | Advisors Preferred, LLC | 684 | 46 | ||||||
| 2025-07-28 | 13F | Harbour Investments, Inc. | 104 | 0,97 | 7 | 0,00 | ||||
| 2025-08-12 | 13F | EFG Asset Management (Americas) Corp. | 11 599 | 1,11 | 781 | 9,85 | ||||
| 2025-08-14 | 13F | CoreCap Advisors, LLC | 2 | 0,00 | 0 | |||||
| 2025-08-01 | 13F | Liberty Wealth Management Llc | 3 225 | 217 | ||||||
| 2025-08-04 | 13F | Keybank National Association/oh | 11 598 | 5,21 | 781 | 14,20 | ||||
| 2025-05-01 | 13F | Key FInancial Inc | 0 | −100,00 | 0 | |||||
| 2025-08-08 | 13F | Emerald Investment Partners, Llc | 39 | 3 | ||||||
| 2025-08-14 | 13F | Hilltop Holdings Inc. | 5 243 | 5,05 | 353 | 14,24 | ||||
| 2025-08-14 | 13F | Raymond James Financial Inc | 33 533 | −4,66 | 2 258 | 3,53 | ||||
| 2025-08-12 | 13F | Global Retirement Partners, LLC | 38 146 | 12,25 | 2 568 | 27,76 | ||||
| 2025-08-12 | 13F | Steward Partners Investment Advisory, Llc | 5 345 | 5,95 | 360 | 15,06 | ||||
| 2025-07-31 | 13F | Richards, Merrill & Peterson, Inc. | 0 | −100,00 | 0 | |||||
| 2025-08-13 | 13F | Townsquare Capital Llc | 0 | −100,00 | 0 | |||||
| 2025-07-25 | 13F | Sequoia Financial Advisors, LLC | 47 743 | 1,04 | 3 215 | 9,73 | ||||
| 2025-07-21 | 13F | Ameritas Advisory Services, LLC | 15 091 | −4,86 | 1 016 | 3,46 | ||||
| 2025-07-08 | 13F | Boltwood Capital Management | 3 520 | 1,44 | 237 | 10,23 | ||||
| 2025-08-14 | 13F | Wharton Business Group, LLC | 252 220 | 1,39 | 17 | 6,67 | ||||
| 2025-07-24 | 13F | IFP Advisors, Inc | 0 | −100,00 | 0 | −100,00 | ||||
| 2025-05-14 | 13F | Vertex Planning Partners, LLC | 0 | −100,00 | 0 | |||||
| 2025-08-08 | 13F | Citizens Financial Group Inc/ri | 67 197 | 2,41 | 4 524 | 11,21 | ||||
| 2025-08-14 | 13F | Mml Investors Services, Llc | 8 110 | 1 | ||||||
| 2025-08-01 | 13F | Austin Private Wealth, LLC | 5 560 | 5,38 | 374 | 14,37 | ||||
| 2025-08-15 | 13F | Provenance Wealth Advisors, LLC | 15 375 | 1 035 | ||||||
| 2025-08-14 | 13F | CIBC World Markets Inc. | 27 691 | 1,51 | 1 864 | 10,23 | ||||
| 2025-07-16 | 13F | Signature Resources Capital Management, LLC | 212 | 0,00 | 14 | 7,69 | ||||
| 2025-08-04 | 13F | Assetmark, Inc | 24 | −7,69 | 2 | 0,00 | ||||
| 2025-08-01 | 13F | Brookwood Investment Group LLC | 16 193 | 9,13 | 1 090 | 18,61 | ||||
| 2025-08-14 | 13F | UBS Group AG | 36 692 | −3,48 | 2 471 | 4,84 | ||||
| 2025-07-16 | 13F | TOWER TRUST & INVESTMENT Co | 122 596 | −1,66 | 8 254 | 3,18 | ||||
| 2025-08-14 | 13F | D. E. Shaw & Co., Inc. | 4 363 | −28,19 | 294 | −22,07 | ||||
| 2025-05-15 | 13F/A | Orion Portfolio Solutions, LLC | 10 729 | 129,99 | 665 | 140,94 | ||||
| 2025-08-18 | 13F/A | National Bank Of Canada /fi/ | 1 125 | 0,00 | 76 | 8,70 | ||||
| 2025-08-12 | 13F | Jpmorgan Chase & Co | 1 148 | 0,26 | 77 | 10,00 | ||||
| 2025-07-25 | 13F | Cwm, Llc | 1 124 | 253,46 | 0 | |||||
| 2025-07-09 | 13F | Breakwater Investment Management | 31 649 | 0,47 | 2 131 | 9,06 | ||||
| 2025-07-16 | 13F | Twelve Points Wealth Management LLC | 5 862 | 5,56 | 395 | 14,53 | ||||
| 2025-08-12 | 13F | Wayfinding Financial, LLC | 0 | −100,00 | 0 | |||||
| 2025-05-12 | 13F | C2P Capital Advisory Group, LLC d.b.a. Prosperity Capital Advisors | 0 | −100,00 | 0 | |||||
| 2025-05-14 | 13F | Jane Street Group, Llc | 0 | −100,00 | 0 | |||||
| 2025-08-08 | 13F | Hedeker Wealth, LLC | 24 968 | 3,22 | 1 681 | 12,14 | ||||
| 2025-07-16 | 13F/A | CX Institutional | 67 511 | −25,26 | 5 | −20,00 | ||||
| 2025-07-18 | 13F | Warren Street Wealth Advisors, LLC | 170 913 | 5,28 | 11 508 | 14,33 | ||||
| 2025-08-11 | 13F | Principal Securities, Inc. | 4 921 | 428,57 | 331 | 501,82 | ||||
| 2025-04-01 | 13F | Hobart Private Capital, LLC | 0 | −100,00 | 0 | |||||
| 2025-08-11 | 13F | HighTower Advisors, LLC | 35 656 | −30,74 | 2 401 | −24,81 | ||||
| 2025-08-11 | 13F | TD Waterhouse Canada Inc. | 592 | 0,00 | 40 | 8,33 | ||||
| 2025-05-15 | 13F | Gts Securities Llc | 0 | −100,00 | 0 | |||||
| 2025-07-30 | 13F | Whittier Trust Co | 939 | 0,00 | 63 | 8,62 | ||||
| 2025-08-08 | 13F | Avantax Advisory Services, Inc. | 11 253 | 4,62 | 758 | 13,66 | ||||
| 2025-08-14 | 13F | Wells Fargo & Company/mn | 48 701 | 3,29 | 3 279 | 12,18 | ||||
| 2025-08-14 | 13F | Citadel Advisors Llc | 0 | −100,00 | 0 | |||||
| 2025-08-06 | 13F | First Horizon Advisors, Inc. | 118 | 8 | ||||||
| 2025-08-28 | NP | INKM - SPDR SSGA Income Allocation ETF This fund is a listed as child fund of State Street Corp and if that institution has disclosed ownership in this security, then these positions will not be double counted when calculating total shares and total value | 91 914 | −15,33 | 6 189 | −8,05 | ||||
| 2025-08-11 | 13F | Private Advisor Group, LLC | 3 112 | 210 | ||||||
| 2025-05-05 | 13F | Eagle Bay Advisors LLC | 0 | −100,00 | 0 | −100,00 | ||||
| 2025-08-18 | 13F | N.E.W. Advisory Services LLC | 319 | 0,00 | 21 | 10,53 | ||||
| 2025-08-12 | 13F | Pathstone Holdings, LLC | 28 902 | 8,16 | 1 946 | 17,52 | ||||
| 2025-09-04 | 13F/A | Advisor Group Holdings, Inc. | 6 018 | −4,51 | 405 | 3,85 | ||||
| 2025-04-28 | NP | MPAY - Akros Monthly Payout ETF | 1 881 | 911,29 | 114 | 927,27 | ||||
| 2025-08-27 | 13F/A | Brinker Capital Investments, LLC | 11 683 | 8,89 | 787 | 18,20 | ||||
| 2025-07-22 | 13F | Sage Financial Group Inc | 5 458 | −38,38 | 367 | −33,15 | ||||
| 2025-07-16 | 13F | Ascent Capital Management, LLC | 10 849 | 1,46 | 730 | 10,27 | ||||
| 2025-07-25 | 13F | NorthRock Partners, LLC | 1 125 | 0,00 | 76 | 8,70 | ||||
| 2025-08-14 | 13F | Bank Of America Corp /de/ | 20 358 | 11,50 | 1 371 | 21,02 | ||||
| 2025-08-11 | 13F | Ironsides Asset Advisors, LLC | 84 740 | −1,50 | 5 706 | 6,98 | ||||
| 2025-08-13 | 13F | Beacon Pointe Advisors, LLC | 71 598 | −0,79 | 4 821 | 7,73 | ||||
| 2025-08-13 | 13F | Consultiva Wealth Management, Corp. | 290 | 20 | ||||||
| 2025-08-14 | 13F | GWM Advisors LLC | 10 | 0,00 | 1 | |||||
| 2025-08-14 | 13F | State Street Corp | 51 700 | 53,87 | 3 481 | 67,11 | ||||
| 2025-08-08 | 13F | Pnc Financial Services Group, Inc. | 585 | 0,00 | 39 | 8,33 | ||||
| 2025-08-14 | 13F | Oxford Financial Group Ltd | 56 516 | −0,38 | 3 805 | 8,19 | ||||
| 2025-08-14 | 13F | Newport Capital Group, LLC | 31 363 | 1,22 | 2 112 | 9,89 | ||||
| 2025-08-12 | 13F | Park Square Financial Group, LLC | 10 | 1 | ||||||
| 2025-07-25 | 13F | Wealth Architects, LLC | 628 942 | 0,03 | 42 348 | 8,63 | ||||
| 2025-08-14 | 13F | Colony Group, LLC | 4 335 | 292 | ||||||
| 2025-08-08 | 13F | Cetera Investment Advisers | 15 355 | 98,18 | 1 034 | 115,21 | ||||
| 2025-08-12 | 13F | LPL Financial LLC | 483 305 | 44,13 | 32 542 | 56,53 | ||||
| 2025-08-13 | 13F | Nicolet Advisory Services, Llc | 14 203 | −16,01 | 958 | −5,34 | ||||
| 2025-08-07 | 13F | Rathbone Brothers plc | 48 439 | −1,68 | 3 261 | 6,78 | ||||
| 2025-07-23 | 13F | Nbt Bank N A /ny | 1 | 0,00 | 0 | |||||
| 2025-07-11 | 13F | Farther Finance Advisors, LLC | 157 | −0,63 | 11 | 11,11 | ||||
| 2025-08-12 | 13F | Proequities, Inc. | 0 | 0 | ||||||
| 2025-08-13 | 13F | Scotia Capital Inc. | 43 559 | −2,03 | 2 933 | 6,39 | ||||
| 2025-08-06 | 13F | Commonwealth Equity Services, Llc | 27 834 | 0,03 | 2 | 0,00 | ||||
| 2025-07-08 | 13F | Parallel Advisors, LLC | 300 | 0,00 | 20 | 11,11 | ||||
| 2025-07-23 | 13F | Castle Rock Wealth Management, LLC | 3 860 | −1,78 | 260 | 7,00 | ||||
| 2025-08-14 | 13F | Fmr Llc | 19 318 | −26,10 | 1 301 | −19,75 | ||||
| 2025-08-13 | 13F | Flow Traders U.s. Llc | 0 | −100,00 | 0 | |||||
| 2025-04-23 | 13F | Creative Financial Designs Inc /adv | 0 | −100,00 | 0 | −100,00 | ||||
| 2025-07-28 | 13F | Copia Wealth Management | 728 | 49 | ||||||
| 2025-08-19 | 13F | Advisory Services Network, LLC | 3 807 | 0,69 | 256 | 8,97 | ||||
| 2025-07-08 | 13F | Lowe Wealth Advisors, LLC | 28 112 | 56,92 | 1 893 | 70,45 | ||||
| 2025-08-07 | 13F | Allworth Financial LP | 0 | −100,00 | 0 | |||||
| 2025-08-14 | 13F | Mariner, LLC | 314 035 | 2,21 | 21 145 | 11,00 | ||||
| 2025-08-12 | 13F | Virtu Financial LLC | 0 | −100,00 | 0 | |||||
| 2025-08-05 | 13F | Hills Bank & Trust Co | 257 006 | 6,00 | 17 305 | 15,11 | ||||
| 2025-08-14 | 13F | Federation des caisses Desjardins du Quebec | 657 | 0,00 | 44 | 10,00 | ||||
| 2025-07-31 | 13F | Waldron Private Wealth LLC | 15 770 | 0,00 | 1 062 | 8,60 | ||||
| 2025-08-27 | NP | RLY - SPDR SSGA Multi-Asset Real Return ETF This fund is a listed as child fund of State Street Corp and if that institution has disclosed ownership in this security, then these positions will not be double counted when calculating total shares and total value | 1 731 681 | −2,45 | 116 598 | 5,94 | ||||
| 2025-07-14 | 13F | Park Avenue Securities Llc | 5 981 | 0 | ||||||
| 2025-08-08 | NP | QALTX - Quantified Alternative Investment Fund Investor Class Shares | 684 | −93,79 | 46 | −93,23 | ||||
| 2025-08-14 | 13F | Susquehanna International Group, Llp | 0 | −100,00 | 0 | |||||
| 2025-08-05 | 13F | Bank Of Montreal /can/ | 13 555 | −83,67 | 913 | −82,27 | ||||
| 2025-08-14 | 13F | Clark Capital Management Group, Inc. | 79 627 | 5 361 | ||||||
| 2025-08-13 | 13F | Jones Financial Companies Lllp | 3 725 | 3,67 | 249 | 12,22 | ||||
| 2025-08-12 | 13F | AlphaCore Capital LLC | 256 | 0,00 | 17 | 13,33 | ||||
| 2025-07-31 | 13F | Cambridge Investment Research Advisors, Inc. | 3 292 | 0 | ||||||
| 2025-07-30 | 13F | D.a. Davidson & Co. | 25 468 | 521,17 | 1 715 | 574,80 | ||||
| 2025-08-13 | 13F | Capital Analysts, Inc. | 350 | 0,00 | 0 | |||||
| 2025-08-13 | 13F | Baker Avenue Asset Management, LP | 123 269 | −5,40 | 8 300 | 2,72 | ||||
| 2025-07-29 | 13F | Private Trust Co Na | 138 | −12,66 | 9 | 0,00 | ||||
| 2025-07-29 | 13F | Sincerus Advisory, LLC | 7 276 | 13,05 | 491 | 22,81 | ||||
| 2025-08-01 | 13F | Envestnet Asset Management Inc | 61 761 | 210,09 | 4 159 | 236,95 |